

Abstract
Background: Multi-cancer detection (MCD) tests can improve the efficacy of existing screening tests by detecting a greater number of cancers. For exerting a clinical impact, however, it is important that the MCD is able to accurately detect early-stage cancers, a feature that is limited in currently available tests. We had previously developed an alternate approach that combined serum metabolomics with machine learning-powered data analytics. Using this approach we have developed an MCD test that could concurrently detect 30 cancers with high accuracy. The goal of the present study was to clinically validate the performance of this test.
Patients and methods: A prospective, multicenter, observational study was conducted in which de-identified blood samples were collected from 10,074 participants with (n = 7246, 72%) and without (n = 2828, 28%) cancer. A blinded arm was also included to validate test performance. Sensitivity and specificity of cancer detection, and the accuracy of tissue of origin (TOO) identification was measured.
Results: The overall sensitivity obtained for cancer detection was 98.55% while the specificity was >99%. The assay demonstrated encouraging sensitivity for detecting early-stage cancers, although these findings require further validation in prospective screening studies, which ranged from 95% to 100% for different cancers. The overall sensitivity obtained for TOO was 95.62%, with accuracies ranging from 90% to 100% for early-stage cancers.
Conclusion: This study validates that our serum-based MCD test is uniquely capable of detecting early-stages of diverse cancers with high sensitivity and specificity, while also ascribing TOO with high fidelity. This test may potentially complement existing single-cancer screening approaches; however, prospective population-based implementation studies are required to establish its clinical utility, effectiveness, and impact on patient outcomes.
Clinical trial ID: CT/MD/2024/000007
Keywords
Cancer, Multi-cancer detection, Mass spectrometry, Metabolomics, Liquid biopsy, Machine learning
Introduction
While the number of cancer cases continues to increase globally each year [1,2], the stage at which the cancer is diagnosed continues to be the main factor influencing prognosis [3]. Detecting cancer when it is still localized, with no detectable metastatic spread, offers the best chance of reducing cancer-associated mortality [4,5]. Although early-stage detection can be aided by cancer screening tests, the US Preventive Services Task Force (USPSTF) has recommended guidelines only for four cancers (breast, cervical, colorectal, and lung cancers) [6]. Single screening for these cancers has reduced mortality due to these malignancies. However, about 70% of cancer deaths are from cancers for which recommended screening tests do not exist [7]. Consequently, there is a need to develop effective methods for detecting these cancers.
Multi-cancer detection (MCD) tests provide an attractive new paradigm in cancer screening because they use readily accessible body fluids such as blood to concurrently screen for multiple cancers including those for which screening tests are presently unavailable [8–10]. Current MCD tests primarily rely on blood-based detection of either circulating tumor cells (CTCs), circulating tumor DNA (ctDNA/cfDNA), or other molecular components released by tumors [11–16]. While these tests have shown promise, inherent limitations, however, compromise their efficacy. These include the low circulating concentration of bioanalytes in early stages of the cancers, which limits the detection sensitivity [17,18], and complications due to cancer-specific variability in the degree of shedding of these bioanalytes [19,20]. Indeed, being integral to the core methodology, it is possible that such limitations may forestall the potential of current MCD tests from being fully realized.
We had adopted an alternate strategy for MCD test development based on interrogation of the serum metabolome. Our rationale was founded on the knowledge that metabolomes – which constitute the complete set of metabolites in a biological system – directly reflect the underlying biochemical activity that exemplifies the functional states of cells/tissues, thus providing a snapshot of the organism’s physiological state [21,22]. Consequently, monitoring modulations in metabolome composition offered an attractive strategy for accurately capturing phenotypic changes that correlate with disease development and/or progression [23–25]. Furthermore, using metabolomics as a tool for cancer detection also seemed relevant since metabolic reprogramming constitutes a key hallmark of cancers [26,27]. Because the metabolome profile of blood provides a systemic perspective on metabolic activity, and modulations therein, we use the term “whole body physiome mapping” to describe this approach.
We employed untargeted serum metabolomics [28,29] by liquid chromatography coupled with high-resolution mass spectrometry (LC/MS), to obtain maximal coverage of the metabolites present. Interrogation of the resulting data to detect metabolite patterns that correlated with the presence of cancer was then achieved through the use of our in-house developed suite of machine learning algorithms [30–32]. Following initial proof-of-concept studies targeting the four women-specific cancers of the breast, endometrium, cervix, and ovary [30,33], we sequentially expanded the scope of the test to eventually cover a total of 30 cancers in both men and women [31,32]. This approach significantly yielded a powerful tool for detecting early-stage cancers with high sensitivity (98%) and specificity (>98%). Additionally, the tissue of origin (TOO) could also be localized with reasonable fidelity [30,33].
Here, we aimed to validate the performance of our 30-cancer detection test. For this, we conducted a prospective, observational, multi-center study involving a total of 10,074 study participants comprising of treatment-naïve cancer patients (n = 7246), as well as non-cancer volunteers (n = 2828). The study protocol also included a blinding component wherein serum samples obtained from ~35% of the subjects (n = 3524) were independently blinded prior to submission for analysis. For cancer detection, the average sensitivity obtained for all 30 cancers was again ~98% whereas the specificity was >99%. TOO determination was also achieved with an average accuracy of 95%. Importantly, results obtained for both the blinded and non-blinded sample subsets were comparable, thus providing strong clinical validation for our test.
Materials and Methods
Study design
We conducted a prospective, multicenter, observational study (CT/MD/2024/000007) in which de-identified blood samples were collected from 10,074 participants with (n = 7246, 72%) and without (n = 2828, 28%) cancer. All participants were required to provide informed consent and Institutional Review Board, or independent ethics committee approval was obtained at each participating site. The study was conducted in accordance with Good Clinical Practice Guidelines of the International Conference on Harmonization for Good Clinical Practice guidelines and the Declaration of Helsinki.
Serum was first separated from each of these samples for subsequent analysis. Samples obtained from the study were divided into two groups for the purposes of: (i) evaluation of test efficacy, and (ii) clinical validation of test performance. The first group comprised of samples from 65% of the subjects (n = 6550) of which 4673 samples were from cancer patients and 1877 were from non-cancer controls. This sample subset was employed for determining test performance, in terms of sensitivity and specificity, for both cancer detection and TOO identification. The second group of samples were randomly blinded prior to submission for analysis. This was done to rigorously validate the test performance. The clinical validation group comprised of serum samples from ~35% of the subjects (n =3524), of which 2573 samples were from individuals with cancer and 951 samples were from non-cancer volunteers. Here, each sample was assigned a unique number as a part of the blinding procedure and, besides gender and age, no additional information on either the study group or patient/subject details were provided at the time of submission for analysis. Sample blinding, and subsequent unblinding, was performed by an independent agency that was approved by the Expert Committee of the Central Drugs Standard Control Organization (CDSCO), Ministry of Health, Government of India.
Patients
Adults (≥18 years of age) were enrolled for the study. Patients eligible for the cancer arm included histologically confirmed cases of either of the thirty cancers under study, but who were treatment naive (chemotherapy, immunotherapy, radiotherapy, etc.). The non-cancer participants enrolled were derived from two broad categories. The first consisted of apparently healthy volunteers (n = 2623) whereas the second non-cancer participant group (n = 205) – broadly categorized as inflammatory disease cases - consisted of subjects who were diagnosed either with high-grade dysplasia, chronic kidney disease, or an autoimmune disease. This latter group was deliberately included in our study to determine whether chronic inflammatory conditions interfered with the test results. Eligibility and exclusion criteria for all these subject groups are described in the Supplementary Table S1 available online.
Study objectives
The primary objective of this study was to first to evaluate the performance of our test using the non-blinded sample set obtained from ~65% of the enrolled subjects (n = 6550 with 4673 cancer-positives and 1877 non-cancer controls), followed by clinical validation of test performance with the independently blinded sample set (n = 3524 with 2573 cancer-positives and 951 non-cancer controls). In this latter case, results generated by our test were sent to the independent blinding/unblinding team who then unblinded the sample codes and determined test accuracy.
Test performance was measured in terms of the sensitivity and specificity of cancer detection, as well as the accuracy of TOO identification. Prediction of TOO was, however, restricted to 21 of the 30 cancers that were screened for by our test. The remaining 9 cancers, which represent the rarer cancers (multiple myeloma, germ cell tumors, cancer of unknown primary origin, and cancers of the anus, penis, vagina, vulva, testis, and squamous cell carcinoma), were grouped under a common head of “Other” cancers and identified as such (see Table 3). Sensitivity and specificity of cancer detection by the test were calculated using the equations given below:
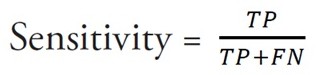
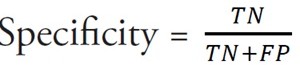
Here, TP denotes true positives whereas FN denotes false negatives. TN denotes true negatives and FP denotes false positives.
Double class prediction accuracy was obtained from the model by using the following formula:

The Positive Predictive Value (PPV) and Negative Predictive Value were calculated based on the prevalence rate of cancer in India, which was recently estimated to be 100.4 per 100,000 [34].
PPV = (Sensitivity x Prevalence)/ (Sensitivity x Prevalence + [(1-Specificity) x (1-Prevalence)
NPV = Specificity x (1-Prevalence)/ [Specificity x (1-Prevalence)] + [(1-Sensitivity) x Prevalence]
Sample processing, data generation and analysis
Sample processing, untargeted metabolome profiling by LC/MS, and subsequent processing of the mass spectrometric data were done as previously described [30–32]. For distinguishing cancer positive samples from non-cancer controls, we employed the cancer detection artificial intelligence (CDAI) that we had previously developed [32]. TOO identification was achieved through an adaptation of our earlier described multiclass AI model (TOOAI) [31] to cover the cancer classes targeted in this study.
Statistical analysis
Statistical analyses were performed using the Statistical Analysis System (SAS). Diagnostic performance was evaluated using sensitivity, specificity, positive predictive value (PPV), negative predictive value (NPV), and tissue-of-origin (TOO) prediction accuracy. Point estimates are reported with 95% confidence intervals (CIs), which were calculated using the Wilson score method on the chi-square distribution. Machine learning models were evaluated on independent non-blinded and blinded validation cohorts using these predefined performance metrics. As the analyses focused on predefined diagnostic endpoints rather than multiple hypothesis testing of individual metabolites or features, correction for multiple testing was not required. The locked machine learning model utilized for the clinical study was previously published and was evaluated k-fold cross-validation (k = 20) to assess model robustness and generalizability. The trained classification function was applied to the training-testing-validation datasets. The model achieved a sensitivity of 97.5% (97.48%, 97.58%), 99.2% (99.18%, 99.23%) specificity, and 98.4% (98.46%, 98.52%) accuracy, AUC-ROC score of 0.99 for the validation dataset.
Results
Characteristics of study participants
A total of 10,074 adult subjects (≥18 years of age) were enrolled in the study (median age, 50 years). Of these, 4,719 (46.84%) were females and 5,355 (53.16%) were males. The demographic and baseline features of the study participants are summarized in Table 1. Notably, majority of the cancer patients (88.2%) were either in stage-1 or stage-2 of the disease. This bias was deliberately exercised during subject enrolment since our emphasis was to determine test accuracy especially for early-stage cancers. Of the 7,246 cancer subjects enrolled, 19.94% were in stage-1 and 68.27% were in stage-2 whereas patients in stage-3 and stage-4 constituted only 6.7% and 4.49% respectively. Description of the number of enrolled cancer patients in each cancer class, and their distribution as a function of gender and clinical stage of the disease is provided in Supplementary Table S2A, whereas subjects recruited in the noncancer arm of the study are described in Supplementary Table S2B. The segregation of subject-derived serum samples between the non-blinded and blinded sample sets is summarized in Supplementary Table S3A and S3B.
|
|
Cancer (n = 7246) |
Non-cancer (n = 2828) |
Total (n = 10,074) |
|
Age Group 20–30 years 31–40 years 41–50 years 51–60 years 61–70 years >70 years |
675 1047 1752 1974 1338 460 |
640 516 577 499 405 191 |
1315 1563 2329 2473 1743 651 |
|
Gender Female Male |
3499 3747 |
1220 1608 |
4721 5353 |
|
Body mass index (kg/m2) <30 >30 |
7111 135 |
2584 244 |
9695 379 |
|
Clinical cancer stage I II III IV NS* |
1443 4949 484 325 45 |
|
|
|
NS*:- Cancers for which stage-specific information was not available |
|||
Analysis of the non-blinded subset of subject-derived serum samples
Untargeted metabolome profiles for serum samples from each of the subjects were generated by UPLC-MS/MS, and the resulting data processed to yield the final set of features as previously described [32]. The earlier developed CDAI model [32] was then employed to distinguish between cancer and non-cancerous samples by using the y-score cut-off of zero and the results obtained are shown in Tables 2A and 2B. Sensitivity of detection as a function of cancer class is shown in Table 2A and it is evident that all 30 cancers were detected with a uniformly high sensitivity that ranged from ~95% to 100%, with an average sensitivity of 98.97% (Table 2A). Important in this context was the fact that specificity was 100%, indicating a low false-positive rate (Table 2B). A notable aspect of Table 2A was that majority of the cancers listed here were those for which screening tests are not presently available. Furthermore, this list also includes those cancers that are considered as particularly lethal, causing over half of the cancer deaths worldwide [35]. In this scenario, the high detection sensitivity coupled with high specificity was particularly encouraging. Thus, among the lethal cancers that currently lack a screening test, the detection sensitivities (at 95% CI) were as follows: lung cancer, 98.92% (97.69, 100); liver and bile cancer, 100% (100, 100); ovarian cancer, 98.64% (97.09, 100); brain and CNS cancer, 98.08% (94.22, 100); prostate cancer, 99.21% (98.12, 100); and pancreatic cancer, 98.71% (97.25, 100).
|
No. |
Cancer Class |
Total No. of Samples |
No. of Test Positive Samples |
No. of Test Negative Samples |
Sensitivity (95% CI)
|
|
1 |
Breast |
229 |
226 |
3 |
98.69 (97.21, 100) |
|
2 |
Cervical |
215 |
213 |
2 |
99.07 (97.78, 100) |
|
3 |
Endometrial |
249 |
247 |
2 |
99.2 (98.08, 100) |
|
4 |
Ovarian |
220 |
217 |
3 |
98.64 (97.09, 100) |
|
5 |
Liver & Bile |
220 |
220 |
0 |
100 (100, 100) |
|
6 |
Lung |
277 |
274 |
3 |
98.92 (97.69, 100) |
|
7 |
Kidney |
237 |
237 |
0 |
100 (100, 100) |
|
8 |
Thyroid |
234 |
231 |
3 |
98.72 (97.27, 100) |
|
9 |
Pancreatic |
233 |
230 |
3 |
98.71 (97.25, 100) |
|
10 |
Leukemia |
219 |
216 |
3 |
98.63 (97.08, 100) |
|
11 |
Colorectal |
223 |
218 |
5 |
97.76 (95.8, 99.72) |
|
12 |
Lymphoma |
248 |
244 |
4 |
98.39 (96.81, 99.97) |
|
13 |
Gastric |
218 |
215 |
3 |
98.62 (97.07, 100) |
|
14 |
Melanoma |
219 |
219 |
0 |
100 (100, 100) |
|
15 |
Prostate |
254 |
252 |
2 |
99.21 (98.12, 100) |
|
16 |
Head & Neck |
272 |
269 |
3 |
98.9 (97.65, 100) |
|
17 |
Esophageal |
246 |
245 |
1 |
99.59 (98.79, 100) |
|
18 |
Bladder |
40 |
40 |
0 |
100 (100, 100) |
|
19 |
Brain and CNS |
52 |
51 |
1 |
98.08 (94.22, 100) |
|
20 |
Multiple Myeloma |
37 |
36 |
1 |
97.3 (91.82, 100) |
|
21 |
Cancer of the Vulva |
39 |
39 |
0 |
100 (100, 100) |
|
22 |
Gall Bladder |
132 |
131 |
1 |
99.24 (97.74, 100) |
|
23 |
Sarcoma + Chondrosarcoma |
83 |
82 |
1 |
98.8 (96.4, 100) |
|
24 |
Penis |
39 |
39 |
0 |
100 (100, 100) |
|
25 |
Vagina |
39 |
37 |
2 |
94.87 (87.63, 100) |
|
26 |
Unknown Primary |
45 |
44 |
1 |
97.78 (93.3, 100) |
|
27 |
Squamous cell carcinoma |
38 |
38 |
0 |
100 (100, 100) |
|
28 |
Anal |
38 |
38 |
0 |
100 (100, 100) |
|
29 |
Germ cell tumor |
39 |
39 |
0 |
100 (100, 100) |
|
30 |
Testicular |
39 |
38 |
1 |
97.44 (92.25, 100) |
|
|
Total |
4,673 |
4,625 |
48 |
|
|
|
Average Sensitivity (95% CI) |
|
|
|
98.97 (98.68, 99.26) |
|
No. |
Sample Type |
Total No. of Samples Tested |
Specificity (95% CI) |
|
1 |
Healthy |
1,743 |
100.0 (100, 100) |
|
2 |
Inflammatory Disease Conditions |
134 |
100.0 (100, 100) |
For TOO determination, the double-class prediction TOOAI model described earlier [31] was employed for TOO identification wherein the two most likely cancer types were predicted. TOO determination was then considered to be correct if the cancer class from which the test sample was derived corresponded to either of the two predictions. Results obtained from this analysis are given in Table 3. The sensitivity of TOO identification obtained was relatively high for all the cancer classes, ranging from a low of 92.17% for pancreatic cancer, to a high of >97% for breast, endometrial, liver & bile, kidney, and prostate cancers (Table 3). The average sensitivity obtained was 96.17% (Table 3). The cumulative results in Table 2 and Table 3, thus, confirm that our serum metabolomics-based MCD test indeed detects all 30 cancers with high sensitivity and specificity, in addition to also accurately predicting the TOO of the target subset of 21 cancers.
|
No. |
Cancer Class |
Total No. of Samples |
No. Correctly Classified |
No. Mis-classified |
Sensitivity (95% CI)
|
|
1 |
Breast |
226 |
220 |
6 |
97.35 (95.23, 99.46) |
|
2 |
Cervical |
213 |
206 |
7 |
96.71 (94.3, 99.13) |
|
3 |
Endometrial |
247 |
242 |
5 |
97.98 (96.21, 99.74) |
|
4 |
Ovarian |
217 |
207 |
10 |
95.39 (92.58, 98.2) |
|
5 |
Liver & Bile |
220 |
218 |
2 |
99.09 (97.83, 100) |
|
6 |
Lung |
274 |
259 |
15 |
94.53 (91.82, 97.24) |
|
7 |
Kidney |
237 |
236 |
1 |
99.58 (98.75, 100) |
|
8 |
Thyroid |
231 |
222 |
9 |
96.1 (93.59, 98.62) |
|
9 |
Pancreatic |
230 |
212 |
18 |
92.17 (88.68, 95.67) |
|
10 |
Leukemia |
216 |
204 |
12 |
94.44 (91.37, 97.52) |
|
11 |
Colorectal |
218 |
208 |
10 |
95.41 (92.61, 98.21) |
|
12 |
Lymphoma |
244 |
235 |
9 |
96.31 (93.93, 98.69) |
|
13 |
Gastric |
215 |
202 |
13 |
93.95 (90.74, 97.17) |
|
14 |
Melanoma |
219 |
219 |
0 |
100 (100, 100) |
|
15 |
Prostate |
252 |
245 |
7 |
97.22 (95.18, 99.27) |
|
16 |
Head & Neck |
269 |
260 |
9 |
96.65 (94.49, 98.82) |
|
17 |
Esophageal |
245 |
232 |
13 |
94.69 (91.87, 97.52) |
|
18 |
Bladder |
40 |
38 |
2 |
95 (87.94, 100) |
|
19 |
Brain and CNS |
51 |
49 |
2 |
96.08 (90.56, 100) |
|
20 |
Gall Bladder |
131 |
124 |
7 |
94.65 (92.37, 96.41) |
|
21 |
Sarcoma + Chondrosarcoma |
82 |
79 |
3 |
96.34 (92.19, 100) |
|
22 |
Others* |
348 |
334 |
14 |
95.98 (93.9, 98.05) |
|
|
Total |
4,625 |
4,451 |
174 |
|
|
|
Average Sensitivity (95% CI) |
|
|
|
96.17 (95.23, 96.38) |
|
Others*:- Nine cancers (Multiple myeloma, Anal, Testis, Vulva, Penis, Germ cell tumor, Vagina, Unknown primary, and Squamous cell carcinoma) were grouped under the category of “Others” and TOO identification accuracy was calculated on the basis of their assignment to this group. |
|||||
Analysis of the blinded subset of subject-derived serum samples
While the results described in Tables 2 and 3 confirm the high-fidelity performance of our MCD test, its validation with results from the blinded sample group was also important. Tables 4A and 4B give the results that were obtained for cancer detection using the CDAI model. Consistent with the findings for the non-blinded sample set, cancer detection sensitivities were also uniformly high in this case and, similarly, ranged from ~95% to 100% (Table 4A). Furthermore, again in similarity with results in Table 2A, detection sensitivities were also exceptionally high (at 95% CI) for the representative examples of more lethal cancers. The sensitivities obtained in these cases were as follows: lung cancer, 98.0% (95.73, 100); liver and bile cancer, 95.83% (92.21, 99.46); ovarian cancer, 97.48% (94.62, 100); brain and CNS cancer, 98.0% (93.98, 100); prostate cancer, 97.16% (94.39, 99.94); and pancreatic cancer, 97.64% (94.96, 100). The average sensitivity obtained, at 95% CI, was 97.86% (97.30, 98.42) (Table 4A) whereas the specificity was 99.68% (Table 4B).
|
No. |
Cancer Class |
Total No. of Samples |
No. of Test Positive Samples |
No. of Test Negative Samples |
Sensitivity (95% CI)
|
|
1 |
Breast |
124 |
122 |
2 |
98.39 (96.14, 100) |
|
2 |
Cervical |
122 |
119 |
3 |
97.54 (94.75, 100) |
|
3 |
Endometrial |
135 |
133 |
2 |
98.52 (96.45, 100) |
|
4 |
Ovarian |
119 |
116 |
3 |
97.48 (94.62, 100) |
|
5 |
Liver & Bile |
120 |
115 |
5 |
95.83 (92.21, 99.46) |
|
6 |
Lung |
150 |
147 |
3 |
98 (95.73, 100) |
|
7 |
Kidney |
118 |
117 |
1 |
99.15 (97.47, 100) |
|
8 |
Thyroid |
128 |
125 |
3 |
97.66 (95, 100) |
|
9 |
Pancreatic |
127 |
124 |
3 |
97.64 (94.96, 100) |
|
10 |
Leukemia |
118 |
113 |
5 |
95.76 (92.07, 99.45) |
|
11 |
Colorectal |
118 |
115 |
3 |
97.46 (94.58, 100) |
|
12 |
Lymphoma |
132 |
131 |
1 |
99.24 (97.74, 100) |
|
13 |
Gastric |
129 |
125 |
4 |
96.9 (93.87, 99.93) |
|
14 |
Melanoma |
118 |
116 |
2 |
98.31 (95.94, 100) |
|
15 |
Prostate |
141 |
137 |
4 |
97.16 (94.39, 99.94) |
|
16 |
Head & Neck |
148 |
146 |
2 |
98.65 (96.77, 100) |
|
17 |
Esophageal |
134 |
133 |
1 |
99.25 (97.78, 100) |
|
18 |
Bladder |
21 |
21 |
0 |
100 (100, 100) |
|
19 |
Brain and CNS |
50 |
49 |
1 |
98 (93.98, 100) |
|
20 |
Multiple Myeloma |
23 |
22 |
1 |
95.65 (86.64, 100) |
|
21 |
Cancer of the Vulva |
21 |
20 |
1 |
95.24 (85.3, 100) |
|
22 |
Gall Bladder |
75 |
73 |
2 |
97.33 (93.6, 100) |
|
23 |
Sarcoma + Chondrosarcoma |
47 |
46 |
1 |
97.87 (93.59, 100) |
|
24 |
Penis |
21 |
21 |
0 |
100 (100, 100) |
|
25 |
Vagina |
21 |
20 |
1 |
95.24 (85.3, 100) |
|
26 |
Unknown Primary |
24 |
23 |
1 |
95.83 (87.21, 100) |
|
27 |
Squamous cell carcinoma |
25 |
25 |
0 |
100 (100, 100) |
|
28 |
Anal |
22 |
22 |
0 |
100 (100, 100) |
|
29 |
Germ cell tumor |
21 |
21 |
0 |
100 (100, 100) |
|
30 |
Testicular |
21 |
21 |
0 |
100 (100, 100) |
|
|
Total |
2,573 |
2,518 |
55 |
|
|
|
Average Sensitivity (95% CI) |
|
|
|
97.86 (97.30, 98.42) |
|
No. |
|
Sample Type |
Total No. of Samples |
No. of False Positives |
Specificity (95% CI)
|
|
1 |
|
Healthy |
880 |
3 |
99.66 (99.27, 100) |
|
2 |
|
Inflammatory Disease Conditions |
71 |
NIL |
100 (100, 100) |
Results from the TOO prediction analysis of the blinded sample group are shown in Table 5. It is evident here that the detection sensitivity remained comparably high across all cancer classes, ranging from a low of 85.71% for bladder cancer to as high as ~97% for breast, liver and bile, and pancreatic cancers (Table 5). The average sensitivity obtained across all cancer classes was 94.65%, which was comparable to the corresponding value obtained for the non-blinded sample set in Table 3. Notably, TOO detection sensitivities were also high for the more lethal cancers of lung (95.92%), liver and bile (97.39%), ovary (92.24%), brain and CNS (91.84%), prostate (94.89%), and pancreas (97.58%) (Table 5). Thus, the high accuracy of cancer detection and TOO prediction obtained with the blinded samples, which was comparable to that obtained for the non-blinded subset, serves to clinically validate our 30-cancer MCD.
|
No. |
Cancer Class |
Total No. of Samples |
No. Correctly Classified |
No. Mis-classified |
Sensitivity (95% CI)
|
|
1 |
Breast |
122 |
119 |
3 |
97.54 (94.75, 100) |
|
2 |
Cervical |
119 |
111 |
8 |
93.28 (88.71, 97.84) |
|
3 |
Endometrial |
133 |
127 |
6 |
95.49 (91.92, 99.06) |
|
4 |
Ovarian |
116 |
107 |
9 |
92.24 (87.3, 97.18) |
|
5 |
Liver & Bile |
115 |
112 |
3 |
97.39 (94.43, 100) |
|
6 |
Lung |
147 |
141 |
6 |
95.92 (92.68, 99.15) |
|
7 |
Kidney |
117 |
108 |
9 |
92.31 (87.41, 97.21) |
|
8 |
Thyroid |
125 |
117 |
8 |
93.6 (89.25, 97.95) |
|
9 |
Pancreatic |
124 |
121 |
3 |
97.58 (94.84, 100) |
|
10 |
Leukemia |
113 |
107 |
6 |
94.69 (90.49, 98.89) |
|
11 |
Colorectal |
115 |
111 |
4 |
96.52 (93.12, 99.92) |
|
12 |
Lymphoma |
131 |
127 |
4 |
96.95 (93.96, 99.93) |
|
13 |
Gastric |
125 |
118 |
7 |
94.4 (90.31, 98.49) |
|
14 |
Melanoma |
116 |
107 |
9 |
92.24 (87.3, 97.18) |
|
15 |
Prostate |
137 |
130 |
7 |
94.89 (91.16, 98.62) |
|
16 |
Head & Neck |
146 |
141 |
5 |
96.58 (93.59, 99.56) |
|
17 |
Esophageal |
133 |
128 |
5 |
96.24 (92.97, 99.52) |
|
18 |
Bladder |
21 |
18 |
3 |
85.71 (69.39, 100) |
|
19 |
Brain and CNS |
49 |
45 |
4 |
91.84 (83.89, 99.78) |
|
20 |
Gall Bladder |
73 |
70 |
3 |
95.89 (91.23, 100) |
|
21 |
Sarcoma + Chondrosarcoma |
46 |
44 |
2 |
95.65 (89.53, 100) |
|
22 |
Others* |
195 |
186 |
9 |
95.38 (92.41, 98.36) |
|
|
Total |
2518 |
2395 |
123 |
|
|
|
Average Sensitivity (95% CI) |
|
|
|
94.65 (94.27, 95.96) |
|
Others*:- Nine cancers (Multiple myeloma, Anal, Testis, Vulva, Penis, Germ cell tumor, Vagina, Unknown primary, and Squamous cell carcinoma) were grouped under “Other cancers” and TOO identification accuracy was calculated on the basis of their assignment to this group. |
|||||
Assessing overall test performance and detection accuracy for early-stage cancers
To assess the overall test performance, we combined results of both the non-blinded and blinded cohorts and these results for cancer detection sensitivities are given in Supplementary Table S4A whereas the results for specificity are provided in Supplementary Table S4B. The average sensitivity, across all 30 cancers, obtained for the combined dataset was 98.55% (98.3, 98.85), whereas the specificity was >99.5%. For TOO prediction, the combined dataset yielded an average sensitivity of 95.62% (95.38, 96.31) (Supplementary Table S5). More notably, Supplementary Table S6 distinguishes the cancer detection sensitivities as a function of the clinical stage of disease, for each of the cancer classes. Here, the exceptionally high sensitivities obtained for the detection of early-stage cancers are notable. Thus, for Stage-I, the detection sensitivity ranged from 95% to 100% for all the cancers, including those generally considered to be either more lethal, or harder to detect (Supplementary Table S6). Similarly, the detection sensitivity also ranged from 95% to 100% for Stage-II cancers, except for multiple myeloma and vaginal cancer where the sensitivity was between 94% to 95% (Supplementary Table S6). TOO prediction sensitivity was also high, ranging between 90% to 100 % for both Stage-I and II, except for Stage-I cervical cancer where the sensitivity was 85.2% (Supplementary Table S7). The distribution of sensitivities, for both cancer detection and TOO identification, across the individual cancer classes is depicted in Figure 1. The demographic and clinical profile, the y-scores generated by the CDAI model, and the TOO identification results for each of the individual study participants are provided in Supplementary Table S8.
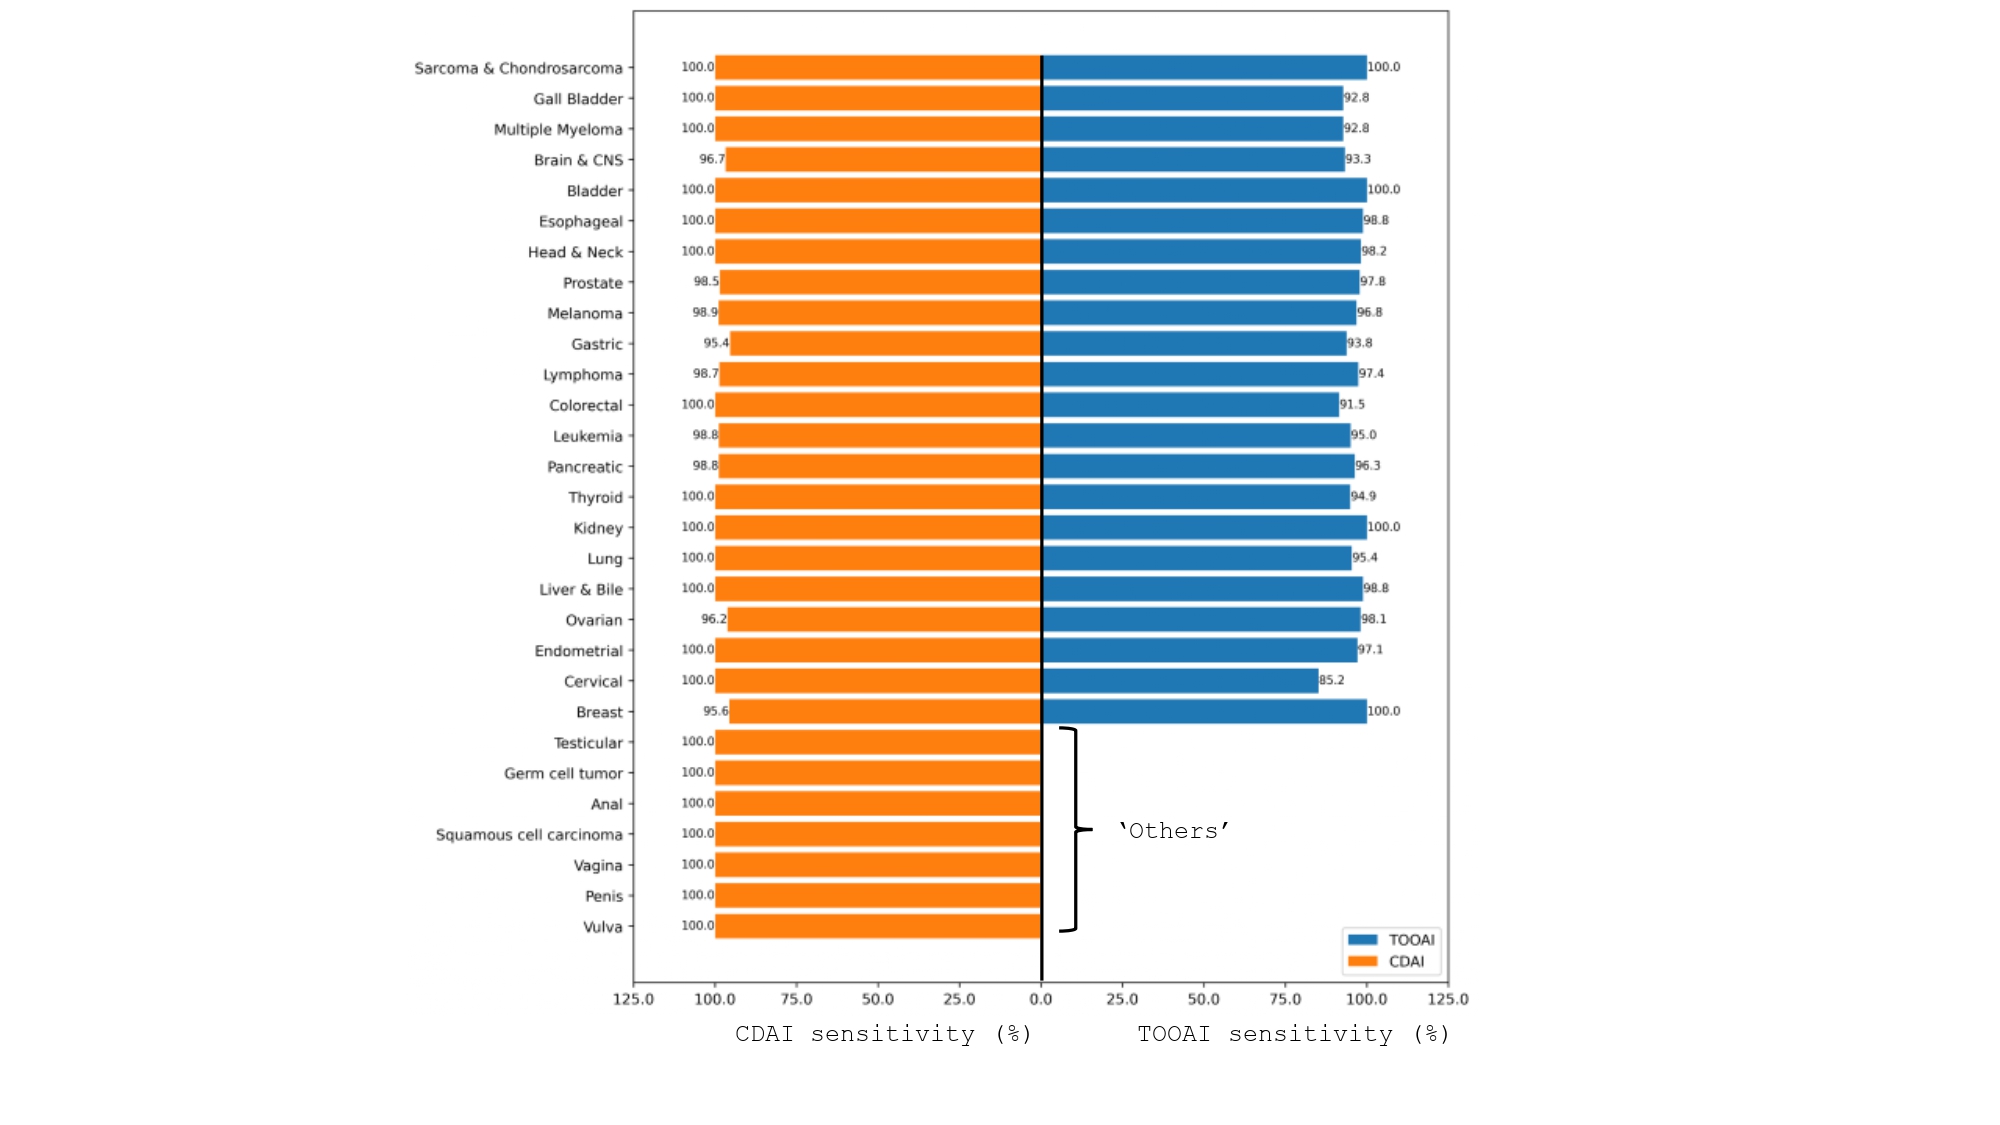
Figure 1. Distribution of sensitivities for both cancer detection and tissue of origin (TOO) identification across the individual cancer classes.
Discussion
Early-stage cancers are hard to detect on account of their either being asymptomatic or exhibiting non-specific and general symptoms that are not directly indicative of disease. Consequently, diagnosis often occurs only at the advanced stages when prognosis is poor [36–39]. Some of the cancers considered most difficult to detect are those of the kidney, ovary, pancreas, liver & bile, lung, colorectum, cervix, brain and CNS, gall bladder, and esophagus [40–48]. While cancer-related deaths continue to rise globally, early-stage detection offers the only practical strategy for reducing them. Thus, 5-year survival rates are considerably higher in patients diagnosed with Stage-I-II, as opposed to those diagnosed at Stage-III-IV of cancers [4,5,49]. While these observations highlight the need for MCD tests that are especially capable of detecting early-stage cancers, this goal has remained elusive [11–16,50–52].
Present findings further substantiate our earlier proposition [30–32] that serum metabolomics, coupled with machine learning-driven data analytics, offers an extremely effective strategy for MCD, especially from the standpoint of detecting early stages of the cancers. Indeed, the present study provides clinical validation for the 30-cancer detection test previously developed by us [32]. The overall cancer detection sensitivity of 98.55% was further underscored by the fact that detection of the early stages of I and II ranged from 95% to 100% across all the 30 cancers. The comparable results obtained for both the non-blinded and blinded sample cohorts confirm the validity of these findings. This significantly high accuracy for early-stage cancer detection is especially significant because it includes detection sensitivities for those cancers for which screening tests are not currently available. Complementing the high sensitivity is the low false-positive rate of <0.5% obtained, suggesting that problems related to overdiagnosis [53] would be minimal with this test.
The 30 cancers that our MCD test detects collectively constitute over 85% of the new cases that occur in many countries each year [54]. Moreover, our list of cancers included many broad groups that themselves were comprised of a variety of distinct cancer types. Thus, the head and neck cancer subjects recruited in this study included cases of laryngeal, oral, oropharyngeal, nasopharyngeal, and nasal cavity and paranasal cancers. Similarly, brain and CNS cancers were comprised of gliomas (including glioblastomas), pituitary tumors, meningioma, and medulloblastoma cases whereas liver and bile cases included hepatocellular carcinoma, cholangiocarcinoma, and adenocarcinoma of the liver cases. The cancer group of sarcoma and chondrosarcoma was comprised of the following cancer types: Ewing sarcoma, osteosarcoma, chondrosarcoma, soft tissue sarcomas, Kaposi sarcoma, leukosarcoma, and gastrointestinal stromal tumors (GIST). Leukemias included ALL, AML, CLL, and CML among others while the lymphomas consisted of both Hodgkin’s and Non-Hodgkin’s lymphomas among others. Finally, subjects with neuroendocrine cancers of the stomach, lung, liver, and colorectum were also included in our study (Supplementary Table S8).
Thus, given the broad range of cancer types that the test detects, its deployment for population screening could likely have a significant impact on improving prognosis and, perhaps, even reducing cancer-related mortality. Because cancer incidence varies significantly with age [55], test performance across age groups becomes yet another important consideration. As shown in Supplementary Table S9, both sensitivity and specificity remained relatively invariant across the various age groups, suggesting the absence of any age-dependent bias for either under- or over-diagnosis. Finally, it is also noted that detection accuracies were comparable for both hematologic cancers (lymphoma, leukemia, multiple myeloma) and cancers that form solid tumors. Collectively these results suggest that our MCD test can serve to complement, but not replace, existing single-cancer screening tests. Its potential utility is supported by the presently unmatched accuracy of early-stage cancer detection, which includes those cancers for which screening tests currently do not exist. Furthermore, cancers detected by the MCD test account for over 90% of cancer-related deaths seen each year [54]; underscoring the possible impact that it could have.
Complementing cancer detection with TOO identification is expected to help the health care provider to better define the follow-up procedure in the event of a positive result. As shown here, our MCD was also able to predict the TOO of the cancer-positive samples with a reasonable accuracy ranging from 80% to about 97% depending on the cancer class. Importantly, for Stage I and II cancers, the TOO identification sensitivity ranged from 90% to 100% across all 21 cancer classes, including the most difficult to detect. The only exception here was Stage-I cervical cancer which could be identified with a sensitivity of 85.2%. Nonetheless, the accurate identification of TOO complements well the high cancer detection sensitivity of our MCD and further strengthens it potential utility for population screening.
Being a case-control study, a limitation of our present results is that they do not truly reflect test performance in a screening population, and a separate study would be needed to assess this. Additionally, to evaluate its global utility, it is also important to determine how our MCD test performs in populations of diverse ethnicities. Finally, clinical implementation studies that evaluate the impact of the test on time to diagnostic resolution would also be helpful in assessing the benefit it can afford.
Conclusion
Cumulatively, results presented here validate that our serum metabolomics-based MCD test detects a broad range of cancer types - including those that presently lack screening tests - with high sensitivity and specificity. Importantly, the high accuracy of detection also covered the early stages of all these cancers, thus addressing the existing gap for accurate identification of early-stage disease cases. Furthermore, the added component of TOO prediction also provides value by informing patient management. Thus, the present study supports that our serum metabolomics-based MCD test can complement existing cancer screening tests, and potentially contribute to reducing both morbidity and mortality, by detecting disease in its early stages.
Data Availability
The study protocol and datasets used and/or analyzed during the current study are available from the corresponding author on reasonable request.
Author Contributions
MG, MVK, PRK, PPL, IL, KKM, RVN, WRN, RN, SKP, DS, VT, and VPS all participated in the clinical trial. VT, GS, ZS, and VPS coordinated the trial. NMS acquired the serum metabolome data while AG and AA performed the analysis for cancer detection and TOO determination. KVSR, ZS, and VPS conceptualized the study, supervised its execution, and wrote the manuscript.
Ethics Statement
The study was approved by the Central Drugs Standard Control Organisation (CDSCO), Directorate General of Health Services, Ministry of Health & Family Welfare (In-Vitro Diagnostic Medical Devices Division), Govt. of India (Registration No. CI/MD/2024/000007). The study protocol and participation in the study was also approved by the respective Institutional Ethics Committees of each of the participating sites.
Conflict of Interest
AG, GS, NMS, AA, ZS, and KVSR are full time employees of PredOmix Technologies Private Limited. AG, NMS, ZS, and KVSR own stock in PredOmix Health Sciences Private Limited. Development of the 30-cancer MCD is covered in a Patent Cooperation Filing. International application No. PCT/SG2024/050022. The other authors declare no conflicts of interest.
References
2. Bizuayehu HM, Ahmed KY, Kibret GD, Dadi AF, Belachew SA, Bagade T, et al. Global Disparities of Cancer and Its Projected Burden in 2050. JAMA Netw Open. 2024 Nov 4;7(11):e2443198.
3. Crosby D, Bhatia S, Brindle KM, Coussens LM, Dive C, Emberton M, et al. Early detection of cancer. Science. 2022 Mar 18;375(6586):eaay9040.
4. Kakushadze Z, Raghubanshi R, Yu W. Estimating cost savings from early cancer diagnosis. Data. 2017 Sep 4;2(3):30.
5. Cancer Research UK. Why is early diagnosis important? [Internet]. London: Cancer Research UK; [cited 2021 Mar 22]. Available from: https://www.cancerresearchuk.org/about-cancer/cancer-symptoms/why-is-early diagnosis-important
6. US Preventive Services Task Force. Recommendations. Rockville (MD): US Preventive Services Task Force; [cited 2024 Feb 2]. Available from: https://www.uspreventiveservicestaskforce.org/uspstf/
7. American Cancer Society. Cancer facts & figures 2023. Atlanta (GA): American Cancer Society; 2023. Available from: https://www.cancer.org/research/cancer-facts-statistics/all-cancer-facts-figures.html
8. Carbonell C, Hutchinson JM, Hilsden RJ, Yang H, Brenner DR. Blood-Based Multi-Cancer Early Detection Tests (MCEDs) as a Potential Approach to Address Current Gaps in Cancer Screening. Cancer Control. 2024 Jan–Dec;31:10732748241307360.
9. Micalizzi DS, Sequist LV, Haber DA. Deploying blood-based cancer screening. Science. 2024 Jan 26;383(6681):368–70.
10. Miller SJ, Sly JR, Rolfo C, Mack P, Villanueva A, Mazor M, et al. Multi-cancer early detection (MCED) tests: prioritizing equity from bench to bedside. Health Aff Sch. 2024 May 23;2(5):qxae039.
11. Lawrence R, Watters M, Davies CR, Pantel K, Lu YJ. Circulating tumour cells for early detection of clinically relevant cancer. Nat Rev Clin Oncol. 2023 Jul;20(7):487–500.
12. Liu MC, Oxnard GR, Klein EA, Swanton C, Seiden MV; CCGA Consortium. Sensitive and specific multi-cancer detection and localization using methylation signatures in cell-free DNA. Ann Oncol. 2020 Jun;31(6):745–59.
13. Li B, Wang C, Xu J, Fang S, Qiu F, Su J, et al. Multiplatform analysis of early-stage cancer signatures in blood. Clin Cancer Res. 2020 Jun 1;26(11):37.
14. Shen SY, Singhania R, Fehringer G, Chakravarthy A, Roehrl MHA, Chadwick D, et al. Sensitive tumour detection and classification using plasma cell-free DNA methylomes. Nature. 2018 Nov;563(7732):579–83.
15. Chen X, Gole J, Gore A, He Q, Lu M, Min J, et al. Non-invasive early detection of cancer four years before conventional diagnosis using a blood test. Nat Commun. 2020 Jul 21;11(1):3475.
16. Cohen JD, Li L, Wang Y, Thoburn C, Afsari B, Danilova L, et al. Detection and localization of surgically resectable cancers with a multi-analyte blood test. Science. 2018 Feb 23;359(6378):926–30.
17. Klein EA, Richards D, Cohn A, Tummala M, Lapham R, Cosgrove D, et al. Clinical validation of a targeted methylation-based multi-cancer early detection test using an independent validation set. Ann Oncol. 2021 Sep;32(9):1167–77.
18. Ma L, Guo H, Zhao Y, Liu Z, Wang C, Bu J, et al. Liquid biopsy in cancer current: status, challenges and future prospects. Signal Transduct Target Ther. 2024 Dec 2;9(1):336.
19. Vittone J, Gill D, Goldsmith A, Klein EA, Karlitz JJ. A multi-cancer early detection blood test using machine learning detects early-stage cancers lacking USPSTF-recommended screening. NPJ Precis Oncol. 2024 Apr 17;8(1):91.
20. Ju S, Chen C, Zhang J, Xu L, Zhang X, Li Z, et al. Detection of circulating tumor cells: opportunities and challenges. Biomark Res. 2022 Aug 13;10(1):58.
21. German JB, Hammock BD, Watkins SM. Metabolomics: building on a century of biochemistry to guide human health. Metabolomics. 2005 Mar;1(1):3–9.
22. Wishart DS. Metabolomics for Investigating Physiological and Pathophysiological Processes. Physiol Rev. 2019 Oct 1;99(4):1819–75.
23. Beger RD. A review of applications of metabolomics in cancer. Metabolites. 2013 Jul 5;3(3):552–74.
24. Wang L, Liu X, Yang Q. Application of metabolomics in cancer research: As a powerful tool to screen biomarker for diagnosis, monitoring and prognosis of cancer. Biomark J. 2018;4(12):100050.
25. Srivastava S. Emerging Insights into the Metabolic Alterations in Aging Using Metabolomics. Metabolites. 2019 Dec 13;9(12):301.
26. Schmidt DR, Patel R, Kirsch DG, Lewis CA, Vander Heiden MG, Locasale JW. Metabolomics in cancer research and emerging applications in clinical oncology. CA Cancer J Clin. 2021 Jul;71(4):333–58.
27. Gyamfi J, Kim J, Choi J. Cancer as a metabolic disorder. International journal of molecular sciences. 2022 Jan 21;23(3):1155.
28. Alonso A, Marsal S, Julià A. Analytical methods in untargeted metabolomics: state of the art in 2015. Front Bioeng Biotechnol. 2015 Mar 5;3:23.
29. Schrimpe-Rutledge AC, Codreanu SG, Sherrod SD, McLean JA. Untargeted Metabolomics Strategies-Challenges and Emerging Directions. J Am Soc Mass Spectrom. 2016 Dec;27(12):1897–1905.
30. Gupta A, Sagar G, Siddiqui Z, Rao KVS, Nayak S, Saquib N, et al. A non-invasive method for concurrent detection of early-stage women-specific cancers. Sci Rep. 2022 Feb 10;12(1):2301.
31. Gupta A, Siddiqui Z, Sagar G, Rao KVS, Saquib N. A non-invasive method for concurrent detection of multiple early-stage cancers in women. Sci Rep. 2023 Nov 4;13(1):19083.
32. Nagarkar R, Gopichand M, Pal SK, Gupta A, Saquib NM, Ahmad A, et al. Development of a Serum Metabolome-Based Test for Early-Stage Detection of Multiple Cancers. Cancer Rep (Hoboken). 2024 Nov;7(11):e70042.
33. Ramamoorthy S, Sundaramoorthy S, Gupta A, Siddiqui Z, Sagar G, Rao KV, et al. Beta-validation of a non-invasive method for simultaneous detection of early-stage female-specific cancers. medRxiv. 2023 Oct 6:2023–10.
34. Sathishkumar K, Chaturvedi M, Das P, Stephen S, Mathur P. Cancer incidence estimates for 2022 & projection for 2025: Result from National Cancer Registry Programme, India. Indian J Med Res. 2022 Oct-Nov;156(4&5):598–607.
35. Mattiuzzi C, Lippi G. Current Cancer Epidemiology. J Epidemiol Glob Health. 2019 Dec;9(4):217–22.
36. Crosby D, Bhatia S, Brindle KM, Coussens LM, Dive C, Emberton M, et al. Early detection of cancer. Science. 2022 Mar 18;375(6586):eaay9040.
37. Diamandis EP, Bast RC Jr, Gold P, Chu TM, Magnani JL. Reflection on the discovery of carcinoembryonic antigen, prostate-specific antigen, and cancer antigens CA125 and CA19-9. Clin Chem. 2013 Jan;59(1):22–31.
38. Whitaker K. Earlier diagnosis: the importance of cancer symptoms. Lancet Oncol. 2020 Jan;21(1):6–8.
39. Holtedahl K. Challenges in early diagnosis of cancer: the fast track. Scand J Prim Health Care. 2020 Sep;38(3):251–2.
40. Sirohi D, Smith SC, Agarwal N, Maughan BL. Unclassified renal cell carcinoma: diagnostic difficulties and treatment modalities. Res Rep Urol. 2018 Nov 15;10:205–17.
41. Zhang L, Sanagapalli S, Stoita A. Challenges in diagnosis of pancreatic cancer. World J Gastroenterol. 2018 May 21;24(19):2047–60.
42. Goff BA, Mandel L, Muntz HG, Melancon CH. Ovarian carcinoma diagnosis: results of a national ovarian cancer survey. Cancer: Interdisciplinary International Journal of the American Cancer Society. 2000 Nov 15;89(10):2068–75.
43. Yang JD. Detect or not to detect very early stage hepatocellular carcinoma? The western perspective. Clin Mol Hepatol. 2019 Mar 29;25(4):335–43.
44. McLean AEB, Barnes DJ, Troy LK. Diagnosing Lung Cancer: The Complexities of Obtaining a Tissue Diagnosis in the Era of Minimally Invasive and Personalised Medicine. J Clin Med. 2018 Jun 29;7(7):163.
45. Astin M, Griffin T, Neal RD, Rose P, Hamilton W. The diagnostic value of symptoms for colorectal cancer in primary care: a systematic review. Br J Gen Pract. 2011 May;61(586):e231–43.
46. Stoehr A, Nann D, Staebler A, Oberlechner E, Brucker SY, Bachmann C. Difficulties in diagnosis of a minimal deviation adenocarcinoma of uterine cervix diagnosed postoperatively: brief communication and literature review. Arch Gynecol Obstet. 2019 Oct;300(4):1029–43.
47. THORPE JJ. Brain tumor: a diagnostic challenge. Ann Intern Med. 1956 Jun;44(6):1142–62.
48. Varghese TK Jr, Hofstetter WL, Rizk NP, Low DE, Darling GE, Watson TJ, et al. The society of thoracic surgeons guidelines on the diagnosis and staging of patients with esophageal cancer. Ann Thorac Surg. 2013 Jul;96(1):346–56.
49. John S, Broggio J. Cancer survival in England: adult, stage at diagnosis and childhood-patients followed up to 2018. Office for National Statistics; 2019 Aug 12 [accessed 2023 June 17]. Available from: https://www.ons.gov.uk/peoplepopulationandcommunity/healthandsocialcare/conditionsanddiseases/bulletins/cancersurvivalinengland/stageatdiagnosisandchildhoodpatientsfollowedupto2018
50. Schrag D, Beer TM, McDonnell CH 3rd, Nadauld L, Dilaveri CA, Reid R, et al. Blood-based tests for multicancer early detection (PATHFINDER): a prospective cohort study. Lancet. 2023 Oct 7;402(10409):1251–60.
51. Li B, Wang C, Xu J, Fang S, Qiu F, Su J, et al. Abstract A06: Multiplatform analysis of early-stage cancer signatures in blood. Clin Cancer Res. 2020 Jun 1;26(11 supplement).
52. Imai M, Nakamura Y, Yoshino T. Transforming cancer screening: the potential of multi-cancer early detection (MCED) technologies. Int J Clin Oncol. 2025 Feb;30(2):180–93.
53. Shieh Y, Eklund M, Sawaya GF, Black WC, Kramer BS, Esserman LJ. Population-based screening for cancer: hope and hype. Nat Rev Clin Oncol. 2016 Sep;13(9):550–65.
54. Bray F, Laversanne M, Sung H, Ferlay J, Siegel RL, Soerjomataram I, et al. Global cancer statistics 2022: GLOBOCAN estimates of incidence and mortality worldwide for 36 cancers in 185 countries. CA Cancer J Clin. 2024 May-Jun;74(3):229–63.
55. The importance of aging in cancer research. Nat Aging. 2022 May;2(5):365–6.