Abstract
Purpose: To compare diffusion-weighted imaging (DWI) and 18F-FDG PET-CT for detection and volumetric assessment of colorectal cancer liver metastases, evaluating the optimal b-value for volumetric correlation with metabolic tumor volume (MTV).
Materials and Methods: This retrospective study included 50 patients with histopathologically confirmed colorectal adenocarcinoma and liver metastases who underwent both PET-CT and liver MRI (including DWI at b=50, 400, 800 s/mm²) within 30 days. Synthetic DWI images at b=1000, 1500, and 2000 s/mm² were generated. Two radiologists and one nuclear medicine physician independently assessed lesion detection and measured volumes. Interobserver agreement was evaluated using intraclass correlation coefficients (ICC). Volumetric correlation between MTV and DWI-derived volumes was assessed using Bland-Altman analysis and paired t-tests.
Results: PET-CT identified 151 FDG-avid liver lesions while DWI detected significantly more lesions at all b-values: 184 (b=800), 183 (b=1000), 176 (b=1500), and 171 (b=2000) (all p<0.001). DWI demonstrated superior detection of small lesions (<10 mm). Interobserver agreement was excellent for both PET-CT MTV (ICC=0.92, 95% CI: 0.87-0.95) and DWI volumes (ICC=0.88-0.91). DWI at b=1500 s/mm² showed optimal volumetric match with MTV (mean difference=0.17 cc, 95% limits of agreement: -2.8 to 3.1 cc, p=0.999), while b=800-1000 s/mm² overestimated volumes by 8-12% and b=2000 s/mm² underestimated by 3.5%.
Conclusion: DWI detects significantly more colorectal liver metastases than PET-CT, particularly lesions <10 mm. DWI at b=1500 s/mm² provides optimal volumetric correlation with PET-CT MTV, suggesting potential alternative surveillance imaging modality for colorectal cancer liver metastases.
Keywords
Diffusion-weighted imaging, Positron emission tomography, Colorectal neoplasms, Liver metastases, Magnetic resonance imaging
Introduction
Colorectal cancer is the third most common malignancy worldwide, with liver metastases developing in approximately 50% of patients during the disease course [1,2]. Accurate detection and volumetric assessment of liver metastases are critical for treatment planning, therapeutic decision-making, and monitoring treatment response [3,4]. 18F-FDG PET-CT has emerged as the reference standard for staging and restaging colorectal cancer, offering both anatomic and metabolic information [5,6]. Metabolic tumor volume (MTV) derived from PET-CT has shown promise as a biomarker for treatment response assessment and prognostic stratification [7,8]. However, PET-CT has limitations including radiation exposure, cost, limited availability in resource-constrained settings, and reduced sensitivity for small lesions (<10 mm) due to inherent spatial resolution limitations (approximately 4–5 mm) and well-documented partial volume effects [9,10].
Diffusion-weighted imaging (DWI) has gained increasing attention as a radiation-free alternative for liver metastasis detection and characterization [11, 12]. DWI exploits differences in water molecule diffusion between normal liver parenchyma and malignant lesions, providing functional information without requiring contrast administration [13]. The choice of b-value significantly influences both lesion detection and volume measurements, yet optimal b-values for volumetric assessment remain incompletely defined [14,15]. Several studies have compared DWI and PET-CT for liver metastasis detection, with conflicting results regarding their relative sensitivities [16–18]. Furthermore, while DWI-derived tumor volumes have been proposed as biomarkers for treatment response monitoring, their correlation with PET-CT MTV—the established metabolic biomarker—has not been systematically evaluated across multiple b-values [19,20]. This study aimed to: (1) compare the detection rates of DWI and PET-CT for colorectal liver metastases, (2) evaluate size-dependent detection performance, (3) assess interobserver reproducibility of volumetric measurements, and (4) identify the optimal DWI b-value for volumetric match with PET-CT MTV. We hypothesized that DWI would demonstrate superior detection of small lesions while maintaining volumetric concordance with PET-CT at specific b-values.
Materials and Methods
Study design and patient selection
This retrospective study was approved by the Institutional Review Board with waiver of informed consent. We reviewed medical records of patients who underwent both PET-CT and liver MRI at Cleveland Clinic Abu Dhabi between January 2017 and September 2025.
Inclusion criteria
(1) Histopathologically confirmed colorectal adenocarcinoma, (2) at least one measurable liver metastasis (≥10 mm) on either imaging modality, (3) PET-CT and MRI performed within 30 days of each other, (4) treatment-naïve status (no interval therapy between imaging studies), and (5) age ≥18 years.
Exclusion criteria included
(1) Mucinous histology (n=18), (2) interval treatment between imaging studies (n=12), (3) previously treated liver lesions (n=10), (4) imaging interval >30 days (n=8), (5) inadequate image quality precluding analysis (n=5), and (6) MRI contraindications (n=3).
Of 106 patients screened, 50 patients (32 male, 18 female; mean age 62.4±11.3 years, range 38–82 years) with 151 PET-CT-detected lesions met inclusion criteria (Figure 1).
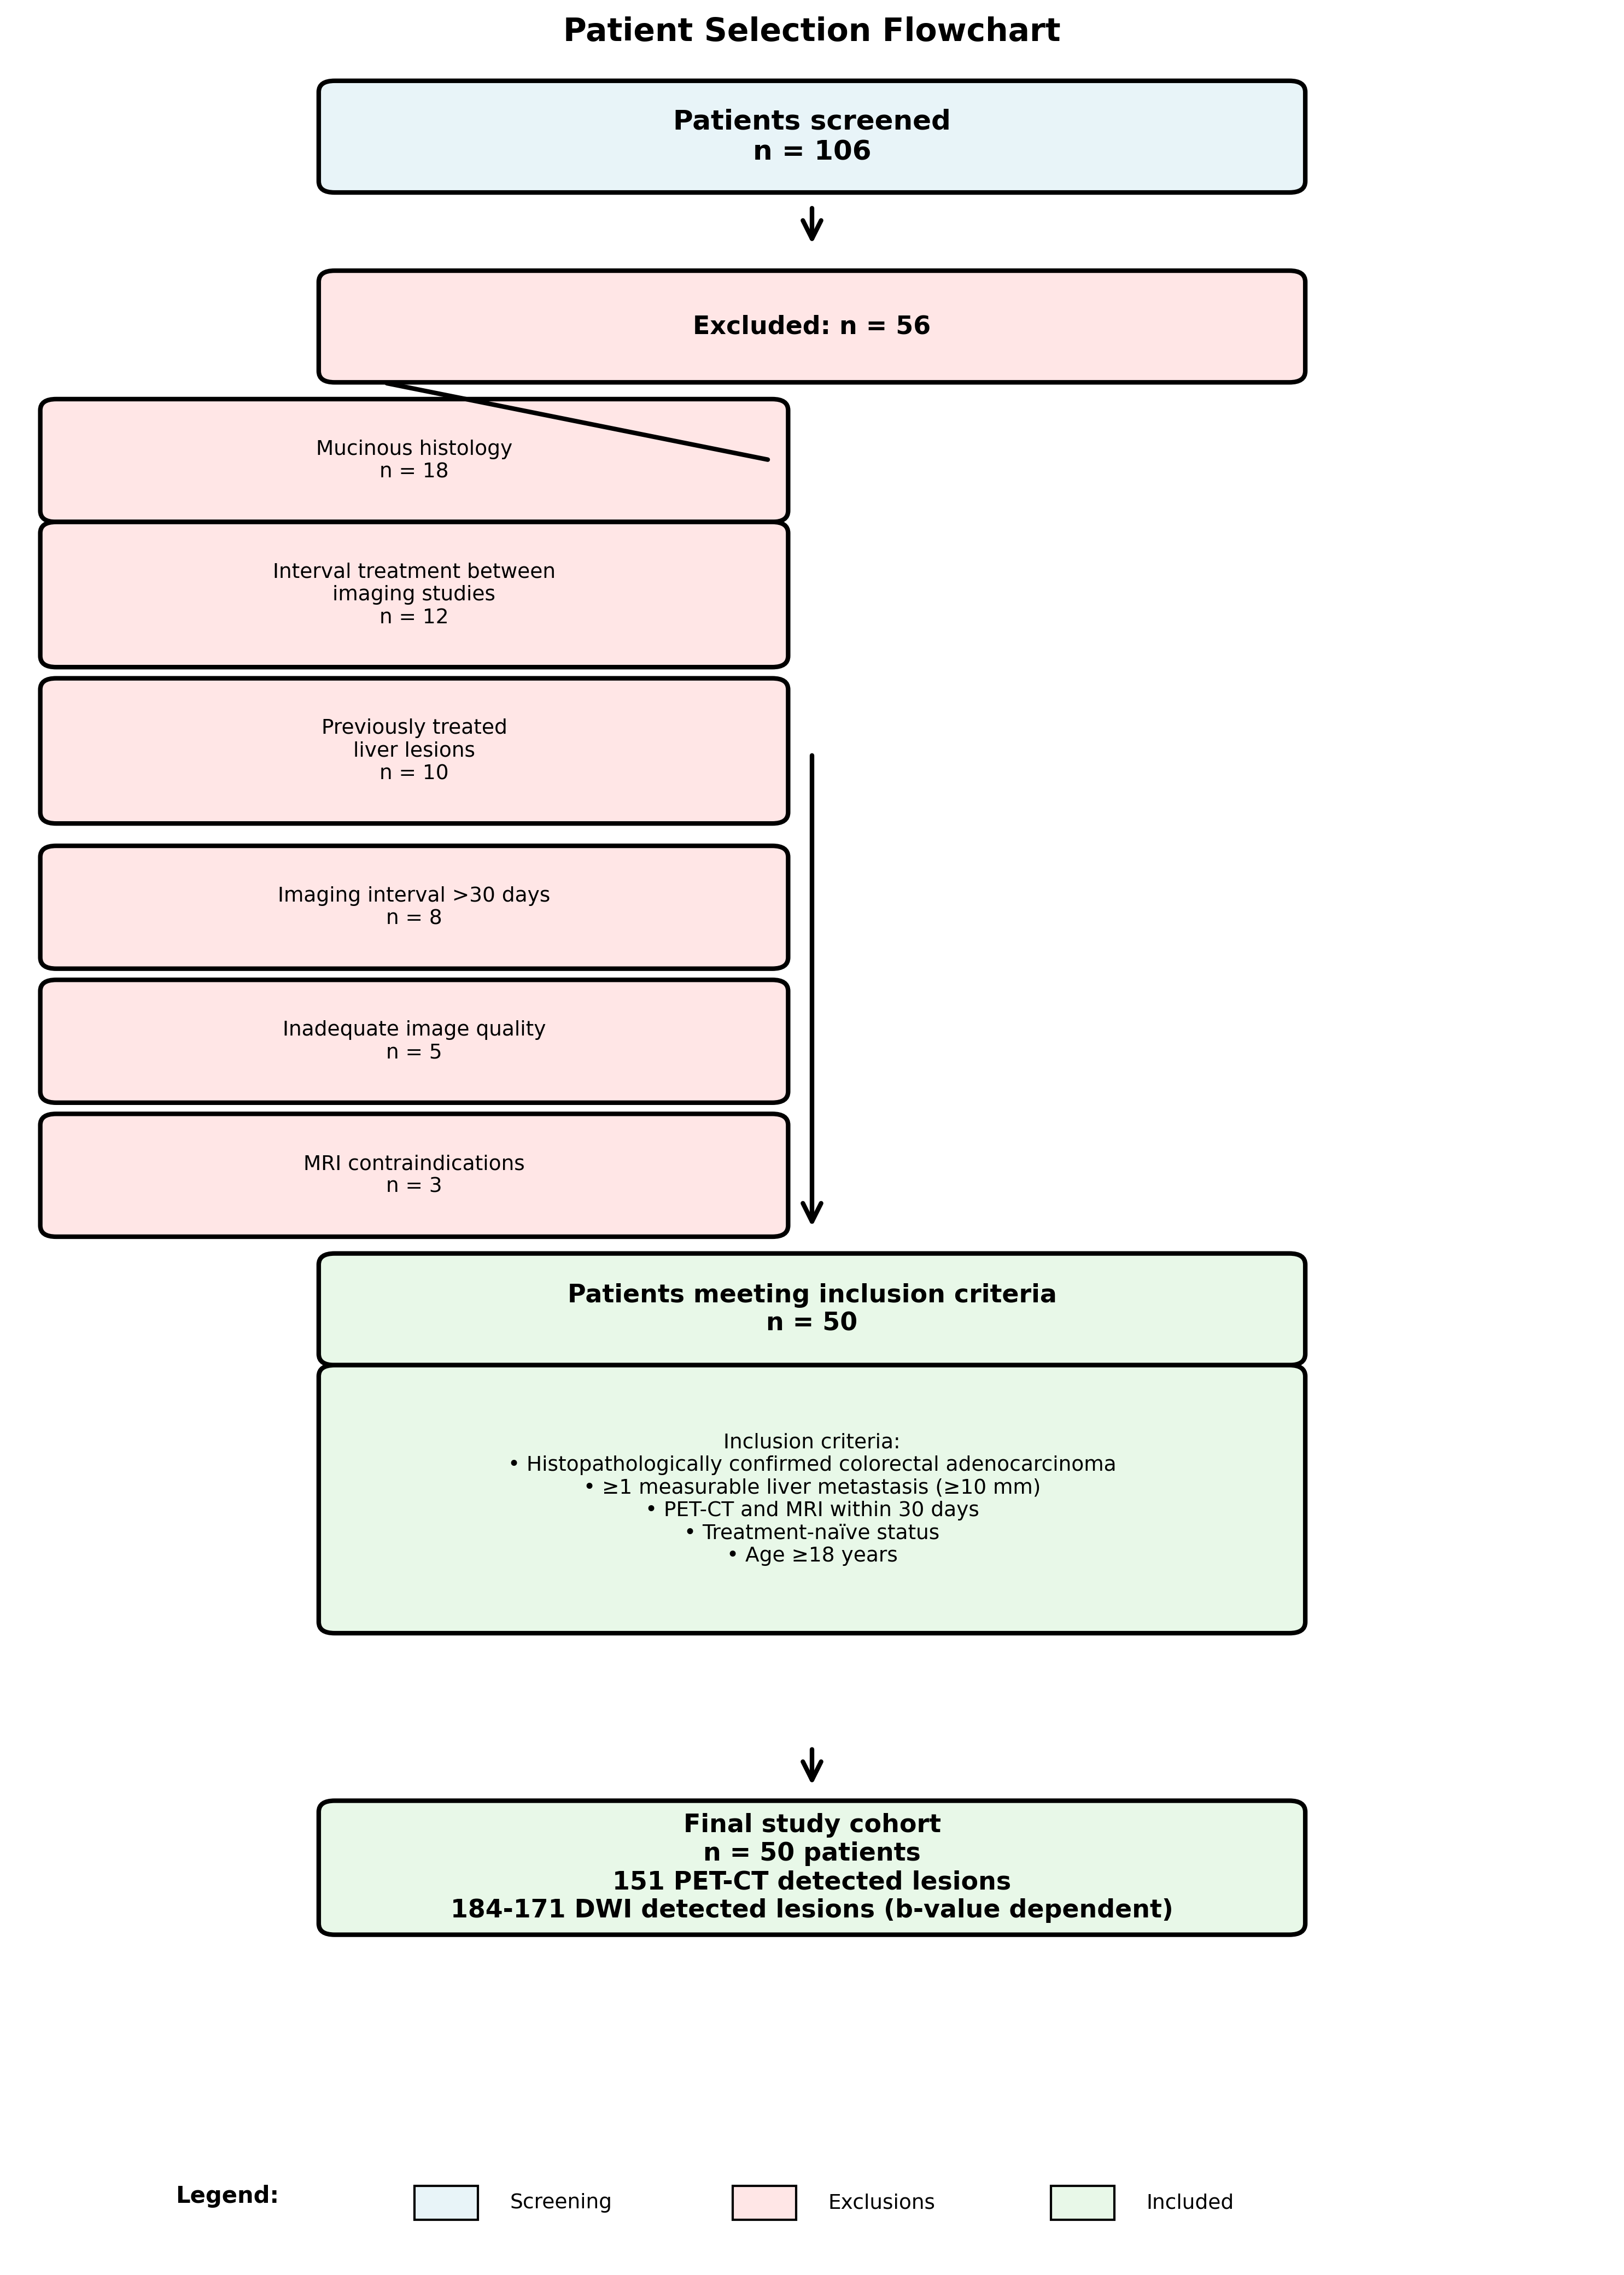
Figure 1. Patient selection flowchart. Of 106 patients screened, 56 were excluded for various reasons, resulting in a final cohort of 50 patients with 151 PET-CT detected lesions and 171–184 DWI detected lesions (b-value dependent).
Image acquisition
PET-CT acquisition
Whole-body PET-CT was performed on GE Discovery 710 (Milwaukee, USA) following a standardized protocol. Patients fasted for at least 6 hours before 18F-FDG injection (3.7–5.2 MBq/kg body weight). Blood glucose levels were confirmed <150 mg/dL before injection. Images were acquired 60±10 minutes post-injection. CT parameters: 120 kVp, automatic tube current modulation, 5-mm slice thickness. PET parameters: 2–3 minutes per bed position, iterative reconstruction.
MRI acquisition
Liver MRI was performed on 3.0-Tesla scanners (Siemens MAGNETOM Sola) using phased-array body coils. The protocol included: (1) T1-weighted dual-echo gradient-echo (in-phase/out-of-phase), (2) T2-weighted half-Fourier acquisition single-shot turbo spin-echo (HASTE), (3) DWI using single-shot echo-planar imaging with b-values of 50, 400, and 800 s/mm², and (4) dynamic contrast-enhanced T1-weighted volumetric interpolated breath-hold examination (VIBE) following gadoxetic acid administration (0.025 mmol/kg) with arterial, portal venous, late venous, and hepatobiliary phases (Table 1).
|
Parameter |
T1W In-Out Phase |
T2W HASTE |
DWI (EPI) |
T1W VIBE (Post-contrast) |
|
Slice thickness (mm) |
4 |
5 |
4 |
3 |
|
TR (ms) |
129 |
1,800 |
3200 |
3.84 |
|
TE (ms) |
1.23/2.46 |
91 |
64 |
1.26 |
|
Matrix |
256×200–256 |
320×280–320 |
128×128–145 |
320×180–200 |
|
b-values (s/mm²) |
— |
— |
50, 400, 800 |
— |
|
NEX |
— |
— |
3 |
— |
|
Plane |
Axial |
Axial, Coronal |
Axial |
Axial |
|
Contrast phases |
— |
— |
— |
Arterial, portal venous, late venous, hepatobiliary |
Synthetic DWI generation
Higher b-value images (b=1000, 1500, 2000 s/mm²) were computationally generated from acquired images (b=50, 400, 800 s/mm²) using monoexponential fitting with vendor-provided software (Syngo Via VB40, Siemens Healthcare). This approach has been validated for liver imaging and allows evaluation of multiple b-values without prolonging acquisition time. While synthetic DWI generation has been validated for liver imaging, it is important to note that computationally derived images may exhibit different noise characteristics compared to directly acquired high b-value images. Specifically, synthetic images are generated through monoexponential fitting of signal decay across acquired b-values, which may smooth noise but also potentially alter lesion conspicuity and edge definition, particularly for smaller lesions. A recognized limitation of monoexponential fitting is the assumption of Gaussian diffusion behavior, which may not fully capture the complex diffusion patterns in hepatic tissue, particularly in tumors with heterogeneous cellularity or necrosis.
Image analysis
Image readers
Three independent readers performed all assessments: two board-certified radiologists (NCB, with 30 years of abdominal imaging experience, and AK, with 10 years of experience) and one nuclear medicine physician (HAA, with 15 years of experience). An additional radiology fellow (AKA, with 5 years of experience) served as the consensus adjudicator for discordant cases. All readers were blinded to clinical information, histopathology results, and other imaging findings.
Lesion detection
Readers independently identified all suspected liver metastases on PET-CT and DWI images at each b-value. On PET-CT, lesions were defined as focal areas of FDG uptake exceeding background liver activity with corresponding CT findings. On DWI, lesions were identified as focal areas of restricted diffusion (hyperintense on high b-value images with corresponding hypointensity on ADC maps).
Lesion matching
Lesion matching was performed using the following predefined criteria: (1) location within the same Couinaud hepatic segment, (2) proximity within 10 mm to the same vascular landmark (portal vein branch or hepatic vein), (3) maximum diameter concordance within 30% between modalities, and (4) morphologic consistency on corresponding anatomic sequences. Discordant cases were resolved by three-reader consensus review with access to all imaging sequences.
Volumetric measurements
For matched lesions, volumetric measurements were performed using dedicated software (Segami Oasis 2.5 for PET-CT; Syngo Via VB40 for MRI). MTV was measured using a threshold of 40% of maximum standardized uptake value (SUVmax). DWI volumes were measured using semiautomatic segmentation with manual adjustment on high b-value images, applying a threshold of 1.5 times the signal intensity of adjacent liver parenchyma. It is important to note that PET-CT MTV was used as a comparative metabolic benchmark rather than a definitive reference standard for volumetric assessment, as PET-CT itself has inherent limitations in spatial resolution and volume quantification. The use of different segmentation thresholds for each modality reflects established clinical practice: the 40% SUVmax threshold for MTV is a widely accepted standard in PET quantification (EANM guidelines), while the 1.5× liver signal intensity threshold for DWI represents the most commonly used approach in published literature. We acknowledge that these methodological differences may introduce systematic measurement bias, as each threshold captures different biophysical tissue properties (metabolic activity vs. cellular density/diffusion restriction).
Size stratification
Lesions were categorized by maximum diameter: <10 mm, 10–14 mm, and ≥15 mm to evaluate size-dependent detection performance.
Statistical analysis
Statistical analyses were performed using SPSS version 26.0 (IBM Corporation) and R version 4.2.1 (R Foundation for Statistical Computing). Continuous variables are presented as mean ± standard deviation or median with interquartile range (IQR), as appropriate. Categorical variables are presented as frequencies and percentages. Lesion detection rates were compared using McNemar’s test for paired proportions. Size-stratified analyses were performed using chi-square tests. Interobserver agreement for volumetric measurements was assessed using two-way random-effects intraclass correlation coefficients (ICC) with 95% confidence intervals, interpreted as poor (<0.40), fair (0.40–0.59), good (0.60–0.74), or excellent (≥0.75). Volumetric correlation between MTV and DWI-derived volumes was evaluated using Bland-Altman analysis, calculating mean differences and 95% limits of agreement. Paired t-tests assessed systematic differences between modalities. Correlation between volumes was evaluated using Spearman’s rank correlation coefficient and linear regression. Primary analyses were lesion-based to maximize statistical power for volumetric comparisons. We acknowledge that clustering of multiple lesions within the same patient may inflate statistical significance. Sensitivity analyses using generalized estimating equations (GEE) with exchangeable correlation structure were performed to account for within-patient clustering, which confirmed the primary findings (results remained significant at p<0.01 for all comparisons). A two-tailed p-value <0.05 was considered statistically significant. Bonferroni correction was applied for multiple comparisons where appropriate.
Results
Patient and tumor characteristics
The final cohort comprised 50 patients with 151 liver metastases detected by PET-CT. Patient demographics and tumor characteristics are summarized in Table 2. The median time between PET-CT and MRI was 14 days (IQR: 7–21 days). Primary tumor locations included right colon (n=22, 44%), left colon (n=18, 36%), and rectum (n=10, 20%). The median number of liver metastases per patient was 3 (IQR: 2–5, range: 1–12), with a median lesion size of 18 mm (IQR: 12–28 mm).
|
Characteristic |
Value |
|
Age (years), mean ± SD |
62.4 ± 11.3 |
|
Age range (years) |
38-82 |
|
Sex Male Female |
32 (64%) 18 (36%) |
|
Primary tumor location Right colon Left colon Rectum |
22 (44%) 18 (36%) 10 (20%) |
|
Histology |
Adenocarcinoma (100%) |
Lesion detection performance
PET-CT identified a total of 151 FDG-avid liver lesions across the 50 patients (median 3 lesions per patient, IQR: 2–5, range: 1–12). DWI detected significantly more lesions at all b-values: 184 lesions at b=800 s/mm² (median 4 per patient, IQR: 2–6, p<0.001), 183 at b=1000 s/mm² (p<0.001), 176 at b=1500 s/mm² (median 3 per patient, IQR: 2–5, p<0.001), and 171 at b=2000 s/mm² (p<0.001). After Bonferroni correction for four pairwise comparisons (adjusted significance threshold p<0.0125), DWI detection rates remained significantly higher than PET-CT at all b-values (all adjusted p<0.001). Size-stratified analysis revealed marked differences in detection performance (Table 3). For lesions <10 mm, PET-CT detected only 19 lesions while DWI detected 37–42 lesions across different b-values. For lesions 10–14 mm, PET-CT detected 52 lesions compared to 63–69 by DWI. For larger lesions (≥15 mm), both modalities demonstrated excellent detection (PET-CT: 80 lesions; DWI: 71–73 lesions). The additional lesions detected by DWI but missed by PET-CT were predominantly small (<10 mm: 18–23 additional lesions; 10–14 mm: 11–17 additional lesions). These additional lesions showed typical imaging features of metastases on conventional MRI sequences (Figure 2).
|
Lesion Size |
PET-CT |
DWI b=800 |
DWI b=1000 |
DWI b=1500 |
DWI b=2000 |
|
<10 mm |
19 |
42 |
41 |
39 |
37 |
|
10-14 mm |
52 |
69 |
68 |
65 |
63 |
|
≥15 mm |
80 |
73 |
74 |
72 |
71 |
|
Total lesions detected |
151 |
184 |
183 |
176 |
171 |
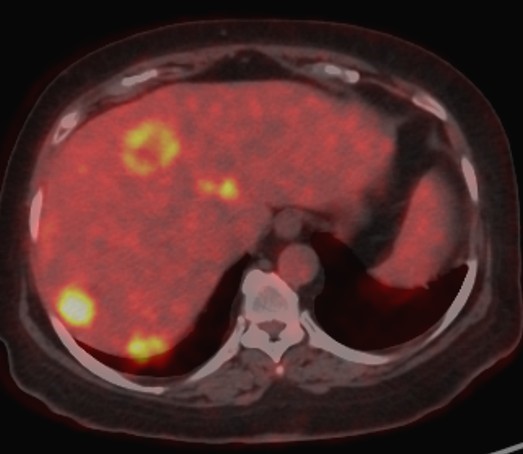
Figure 2a. A case of a 58-year-old male patient with colorectal cancer liver metastases. Axial fused 18F-FDG PET-CT image showing multiple FDG-avid hepatic metastases with increased metabolic activity.
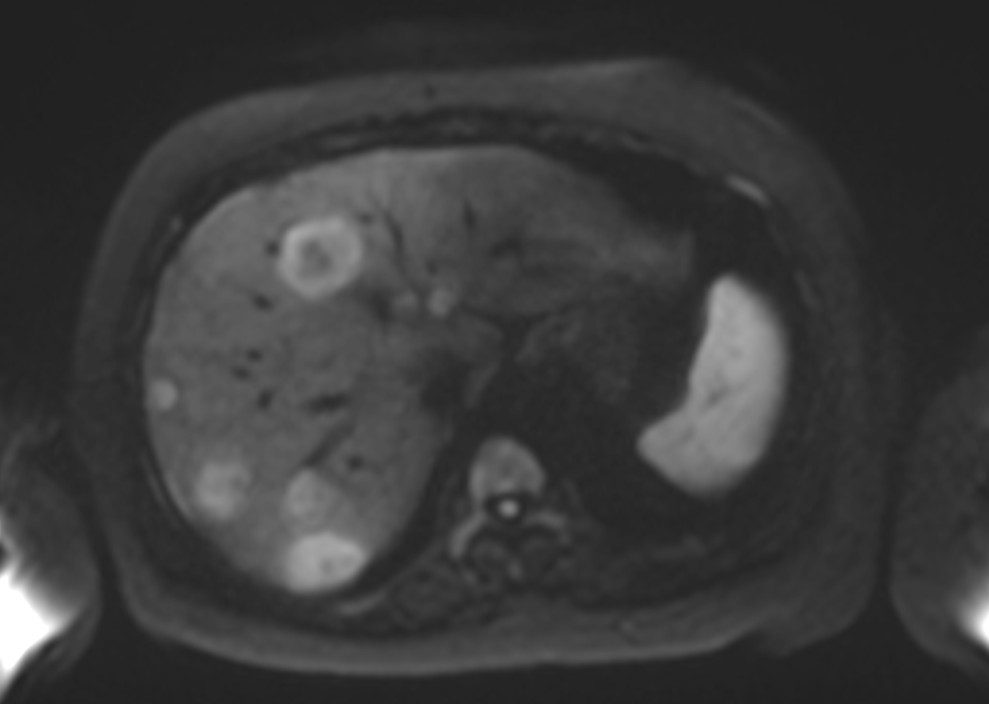
Figure 2b. Axial DWI at b=800 s/mm² demonstrating multiple hyperintense lesions with restricted diffusion corresponding to the PET-positive lesions, with high signal intensity and clear lesion conspicuity.
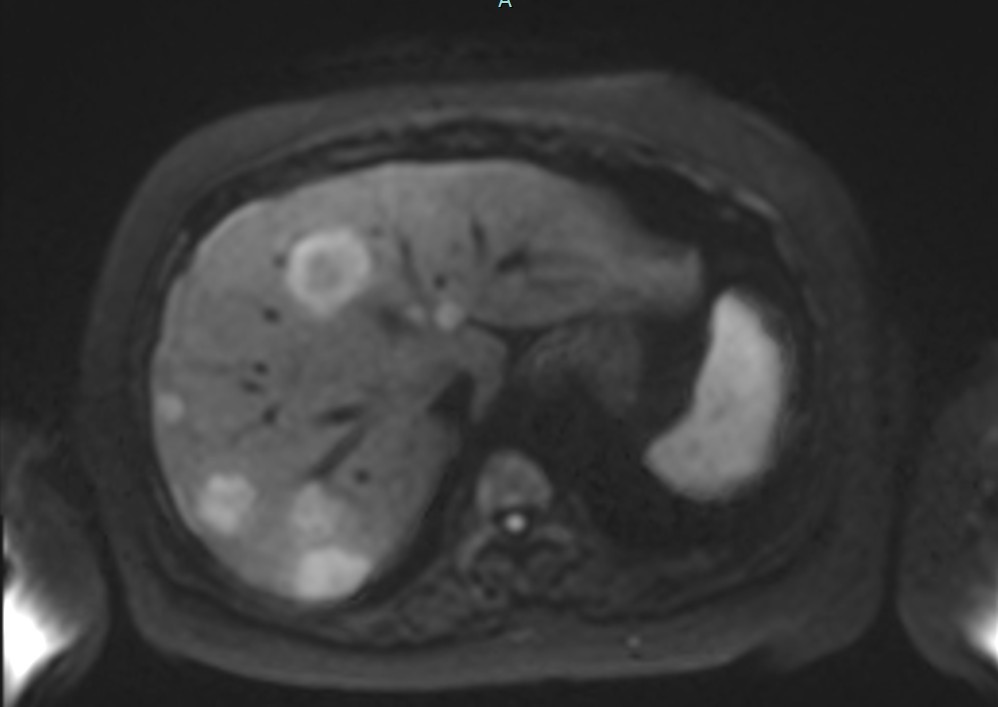
Figure2c. Axial DWI at b=1000 s/mm² showing similar lesion detection with slightly reduced signal intensity compared to b=800.
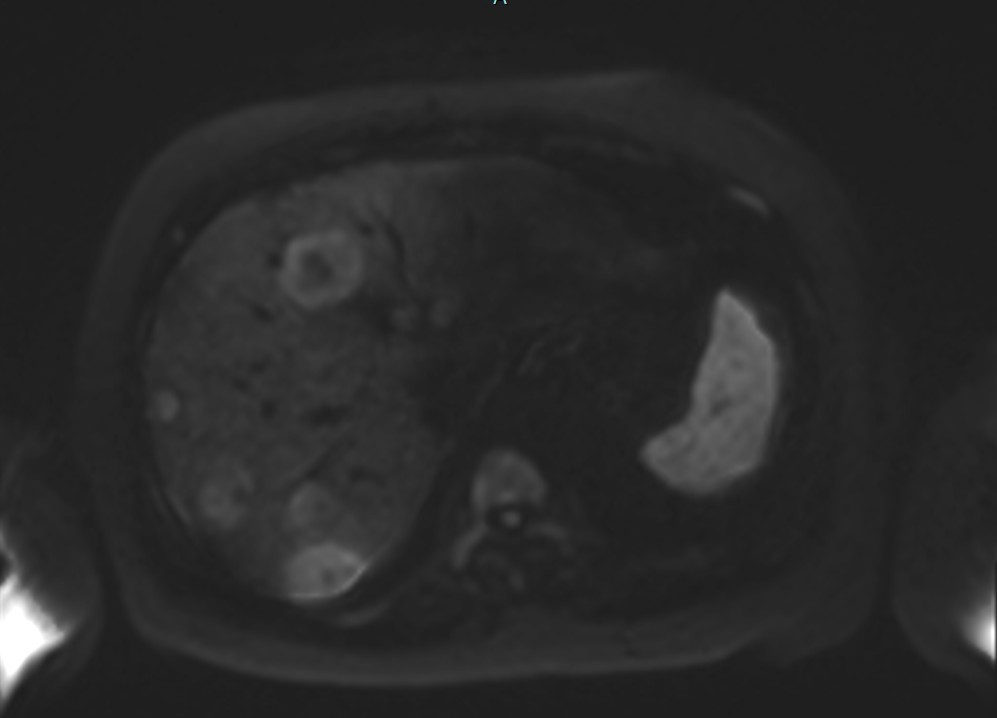
Figure 2d. Axial DWI at b=1500 s/mm² demonstrating maintained lesion visibility with optimal volumetric concordance to PET-CT MTV.
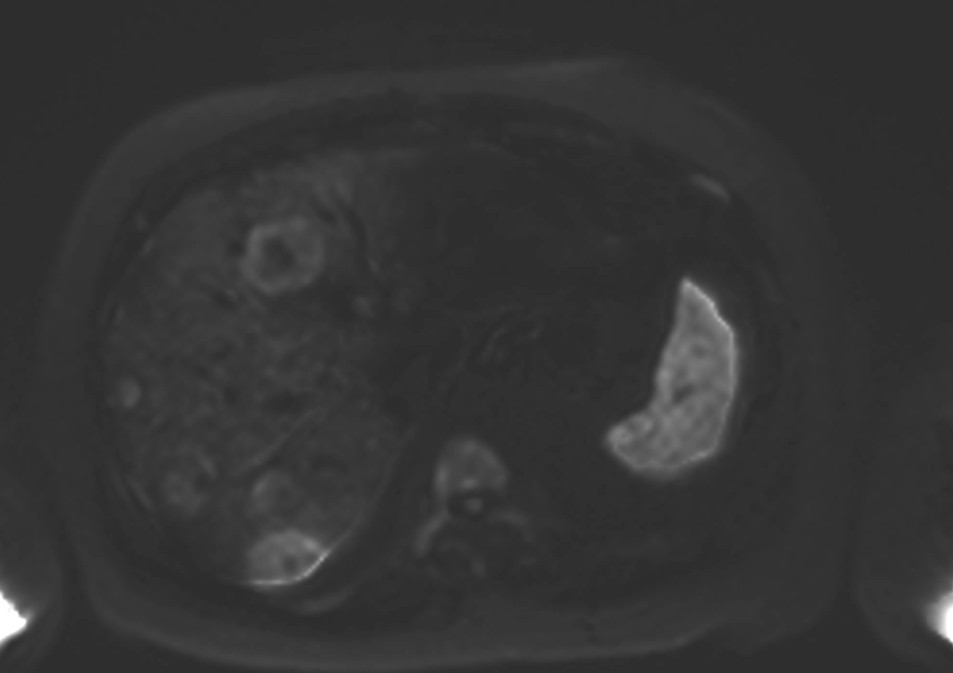
Figure 2e. Axial DWI at b=2000 s/mm² showing decreased signal intensity and reduced lesion conspicuity at higher b-value, with some smaller lesions becoming less apparent due to lower signal-to-noise ratio. DWI diffusion-weighted imaging, FDG fluorodeoxyglucose, MTV metabolic tumor volume, PET-CT positron emission tomography-computed tomography.
Interobserver agreement
Interobserver agreement for volumetric measurements was excellent for both modalities. For PET-CT MTV, the ICC was 0.92 (95% CI: 0.87–0.95). For DWI-derived volumes, ICCs ranged from 0.88–0.91 across different b-values: b=800 (ICC=0.88, 95% CI: 0.83–0.92), b=1000 (ICC=0.90, 95% CI: 0.86–0.93), b=1500 (ICC=0.91, 95% CI: 0.87–0.94), and b=2000 (ICC=0.89, 95% CI: 0.84–0.93).
Volumetric analysis
For the 151 matched lesions, volumetric correlation between MTV and DWI-derived volumes varied by b-value. DWI at b=1500 s/mm² demonstrated optimal concordance with MTV, showing a mean difference of only 0.17 cc (95% limits of agreement: –2.8 to 3.1 cc, p=0.999). Lower b-values (800 and 1000 s/mm²) systematically overestimated volumes compared to MTV, with mean differences of +1.2 cc (95% CI: 0.8–1.6 cc, p<0.001) for b=800 and +0.9 cc (95% CI: 0.5–1.3 cc, p<0.001) for b=1000, representing approximately 8–12% overestimation. Conversely, b=2000 s/mm² slightly underestimated volumes (mean difference: –0.4 cc, 95% CI: –0.8 to –0.1 cc, p=0.032), representing approximately 3.5% underestimation. Correlation analysis showed strong positive correlations between MTV and DWI volumes at all b-values (Spearman ρ=0.614–0.767, all p<0.001), with b=1500 s/mm² demonstrating the strongest correlation (ρ=0.767, p<0.001) (Table 4).
|
b-value (s/mm²) |
Spearman ρ |
p-value |
Regression Slope (cc/lesion) |
R² |
|
800 |
0.614 |
<0.001 |
5.65 |
0.429 |
|
1000 |
0.668 |
<0.001 |
5.51 |
0.486 |
|
1500 |
0.767 |
<0.001 |
4.08 |
0.567 |
|
2000 |
0.760 |
<0.001 |
4.98 |
0.505 |
Discussion
Our study demonstrates that DWI detects significantly more colorectal liver metastases than PET-CT, with superior performance for small lesions (<10 mm). Furthermore, we identified b=1500 s/mm² as the optimal DWI b-value for volumetric concordance with PET-CT MTV, providing a potential radiation-free complementary approach for volumetric tumor burden assessment. The superior detection rate of DWI, particularly for small lesions, aligns with previous studies reporting DWI sensitivities of 85–95% for liver metastases [21,22]. Our finding that PET-CT detected only 42% of lesions <10 mm compared to DWI’s detection of 82–93% is consistent with known limitations of PET-CT related to partial volume effects and limited spatial resolution [23,24]. PET-CT’s limited spatial resolution (approximately 4–5 mm) and well-documented partial volume effects result in significant underestimation of metabolic activity in lesions smaller than 2–3 times the scanner resolution, explaining the reduced detection of sub-centimeter metastases. This size-dependent detection difference has important clinical implications, as the presence of additional small metastases may influence decisions regarding surgical resectability and treatment strategy [25,26]. The clinical significance of detecting additional sub-centimeter metastases warrants careful consideration. While identification of additional small lesions may upstage disease and potentially alter treatment from curative resection to systemic therapy, it is equally important to recognize that increased detection sensitivity may come at the cost of reduced specificity. DWI hyperintensities can result from benign entities including hemangiomas, focal nodular hyperplasia, cysts, and perfusion-related artifacts, particularly at lower b-values. Conversely, DWI hyperintensities are not specific to malignancy; ADC maps and correlation with conventional MRI sequences were used to mitigate false positives in our study, but the potential for misclassification remains, particularly for the additional small lesions detected only on DWI. In our cohort, the additional DWI-detected lesions were confirmed as metastases on follow-up imaging; however, in clinical practice, such findings may prompt unnecessary additional investigations or potentially inappropriate treatment modifications. The net clinical benefit of detecting these additional small lesions—weighed against the risk of false-positive findings and their downstream consequences—remains to be established through prospective studies with outcome correlation. Current NCCN and ESMO guidelines continue to recommend PET-CT for staging of colorectal cancer, and our findings should be interpreted as complementary rather than practice-changing at this stage.
The excellent volumetric concordance between DWI at b=1500 s/mm² and PET-CT MTV (mean difference 0.17 cc, p=0.999) is a novel finding with potential clinical applications. However, this concordance should be interpreted cautiously, as the use of modality-specific segmentation thresholds is a recognized methodological limitation. The volumetric concordance observed at b=1500 s/mm² may be partly attributable to a fortuitous balance between the biophysical properties captured by each threshold rather than a true biological equivalence. Future studies should evaluate harmonized volumetric approaches to minimize this potential confound. The systematic volume overestimation observed at b=800–1000 s/mm² can be attributed to two principal mechanisms: (1) T2 shine-through, where residual T2 weighting at lower b-values causes signal hyperintensity in perilesional edema and adjacent liver tissue, effectively expanding the apparent lesion boundary; and (2) incomplete suppression of background hepatic diffusion signal, which reduces contrast between lesion and liver parenchyma and introduces segmentation uncertainty at the lesion periphery. Conversely, volume underestimation at b=2000 s/mm² results from progressive signal decay at very high b-values, where low signal-to-noise ratio causes peripheral voxels of smaller lesions to fall below the segmentation threshold, yielding falsely reduced volumes. The optimal concordance at b=1500 s/mm² likely reflects a balance point where T2 shine-through is sufficiently suppressed while adequate signal-to-noise ratio is maintained for accurate edge delineation [27,28]. Our interobserver agreement results (ICC 0.88–0.92) demonstrate that volumetric measurements are highly reproducible for both modalities, supporting their potential use as quantitative biomarkers [29,30].
Comparison with existing literature
Previous studies comparing DWI and PET-CT for liver metastasis detection have shown variable results, with some reporting comparable sensitivities [31,32] while others found DWI superior [33,34]. Our study extends these findings by providing size-stratified analysis and comprehensive volumetric concordance assessment across multiple b-values.
Clinical implications
Our findings suggest that DWI may serve as a promising complementary imaging strategy for liver metastasis detection and volumetric assessment in colorectal cancer patients. The volumetric concordance between DWI at b=1500 s/mm² and PET-CT MTV warrants further investigation as a potential radiation-free alternative for treatment response monitoring. However, given the retrospective design and absence of outcome correlation in this study, prospective validation with clinical endpoints is essential before DWI-derived volumes can be considered for clinical decision-making, including liver transplantation candidacy assessment where PET-CT MTV currently serves as an established selection criterion.
Study limitations
Several limitations warrant consideration. First, the retrospective, single-center design at a quaternary referral center may introduce selection bias toward patients with more complex disease. Our institutional imaging protocols, including the use of 3.0-Tesla Siemens scanners with specific DWI parameters and gadoxetic acid contrast, may yield different results compared to other scanner platforms, field strengths (e.g., 1.5T), or contrast agents. The patient population at a tertiary Middle Eastern referral center may differ demographically and clinically from populations at other institutions, potentially affecting generalizability. Second, we used semiautomatic segmentation for DWI volumes versus threshold-based MTV measurement, potentially introducing methodological bias. Third, a critical methodological caveat is the use of synthetic rather than acquired high b-value DWI images. While monoexponential fitting has been validated for liver applications, synthetic images inherently differ from acquired images in noise texture, signal decay characteristics, and potential susceptibility artifact profiles. These differences may affect both lesion detection sensitivity and volumetric boundary delineation, particularly for lesions <10 mm where partial volume effects are amplified. Our findings should therefore not be directly generalized to protocols employing acquired high b-value DWI, and direct comparison studies of acquired versus synthetic high b-value images are needed to validate these results. Fourth, the median 14-day interval between PET-CT and MRI (IQR: 7–21 days) represents a potential source of volumetric discordance, as interval tumor growth could systematically bias volume comparisons. Based on published doubling times for colorectal liver metastases (median 60–80 days), estimated volume change over 14 days would be approximately 10–15%, which approaches the magnitude of the volumetric differences observed at b=800–1000 s/mm² and should be considered when interpreting our results. Fifth, an important methodological consideration is that histopathologic confirmation was not available for all detected lesions, particularly those identified only on DWI. Reliance on imaging follow-up for lesion confirmation introduces potential verification bias, as some DWI-detected lesions may represent false positives. Conversely, lesions missed by PET-CT but detected on DWI were confirmed on follow-up imaging in most cases; however, the absence of systematic histopathologic validation means that the true positive rate of DWI-only lesions cannot be definitively established. Sixth, our primary lesion-based analysis does not fully account for within-patient clustering, although sensitivity analyses using GEE confirmed the robustness of our findings. Seventh, our sample size of 50 patients, while adequate for the primary objectives, may have limited statistical power for subgroup analyses. Finally, we did not evaluate the prognostic value of DWI-derived volumes or their ability to predict treatment response, which limits the clinical applicability of our volumetric findings as biomarkers.
Future directions
Prospective multicenter studies are needed to validate our findings and establish standardized protocols for DWI-based volumetric assessment. Critically, prospective studies should incorporate systematic histopathologic validation of detected lesions through either surgical pathology correlation or targeted biopsy, particularly for lesions detected only on DWI. Furthermore, longitudinal studies correlating DWI volume changes with established treatment response endpoints (RECIST 1.1 and PERCIST criteria) and overall survival are needed to establish DWI-derived volumes as validated prognostic biomarkers. Multicenter studies incorporating diverse scanner platforms, imaging protocols, and patient populations are essential. Investigation of automated segmentation algorithms and artificial intelligence approaches may further improve reproducibility and clinical workflow integration. Additionally, direct comparison of acquired versus synthetic high b-value images for volumetric assessment would strengthen the evidence base for synthetic DWI use.
Conclusions
DWI demonstrates superior detection of colorectal liver metastases compared to PET-CT, particularly for lesions <10 mm. DWI at b=1500 s/mm² provides optimal volumetric concordance with PET-CT MTV, with excellent interobserver reproducibility. These findings support the potential of DWI as a complementary radiation-free modality for lesion detection and volumetric tumor burden assessment. Prospective multicenter validation studies with clinical outcome correlation are warranted before DWI-derived volumes can be recommended as clinical biomarkers or substitutes for PET-CT MTV in treatment decision-making, including liver transplantation candidacy assessment.
Declaration of Competing Interests
The authors declare that they have no known competing financial interests or personal relationships that could have appeared to influence the work reported in this paper.
Funding
This research did not receive any specific grant from funding agencies in the public, commercial, or not-for-profit sectors.
References
2. Engstrand J, Nilsson H, Strömberg C, Jonas E, Freedman J. Colorectal cancer liver metastases - a population-based study on incidence, management and survival. BMC Cancer. 2018 Jan 15;18(1):78.
3. Adam R, Kitano Y. Multidisciplinary approach of liver metastases from colorectal cancer. Ann Gastroenterol Surg 2019;3:50–56.
4. Van Cutsem E, Cervantes A, Adam R, Sobrero A, Van Krieken JH, Aderka D, et al. ESMO consensus guidelines for the management of patients with metastatic colorectal cancer. Ann Oncol. 2016 Aug;27(8):1386–422.
5. Bipat S, van Leeuwen MS, Comans EF, Pijl ME, Bossuyt PM, Zwinderman AH, et al. Colorectal liver metastases: CT, MR imaging, and PET for diagnosis--meta-analysis. Radiology. 2005 Oct;237(1):123–31.
6. Wiering B, Krabbe PF, Jager GJ, Oyen WJ, Ruers TJ. The impact of fluor-18-deoxyglucose-positron emission tomography in the management of colorectal liver metastases. Cancer. 2005 Dec 15;104(12):2658–70.
7. Hatt M, Tixier F, Pierce L, Kinahan PE, Le Rest CC, Visvikis D. Characterization of PET/CT images using texture analysis: the past, the present… any future? Eur J Nucl Med Mol Imaging. 2017 Jan;44(1):151–65.
8. Cheng NM, Fang YH, Lee LY, Chang JT, Tsan DL, Ng SH, et al. Zone-size nonuniformity of 18F-FDG PET regional textural features predicts survival in patients with oropharyngeal cancer. Eur J Nucl Med Mol Imaging. 2015 Mar;42(3):419–28.
9. Mainenti PP, Mancini M, Mainolfi C, Camera L, Maurea S, Manchia A, et al. Detection of colo-rectal liver metastases: prospective comparison of contrast enhanced US, multidetector CT, PET/CT, and 1.5 Tesla MR with extracellular and reticulo-endothelial cell specific contrast agents. Abdom Imaging. 2010 Oct;35(5):511–21.
10. Niekel MC, Bipat S, Stoker J. Diagnostic imaging of colorectal liver metastases with CT, MR imaging, FDG PET, and/or FDG PET/CT: a meta-analysis of prospective studies including patients who have not previously undergone treatment. Radiology. 2010 Dec;257(3):674–84.
11. Koh DM, Collins DJ. Diffusion-weighted MRI in the body: applications and challenges in oncology. AJR Am J Roentgenol. 2007 Jun;188(6):1622–35.
12. Taouli B, Koh DM. Diffusion-weighted MR imaging of the liver. Radiology. 2010 Jan;254(1):47–66.
13. Padhani AR, Liu G, Koh DM, Chenevert TL, Thoeny HC, Takahara T, et al. Diffusion-weighted magnetic resonance imaging as a cancer biomarker: consensus and recommendations. Neoplasia. 2009 Feb;11(2):102–25.
14. Donati OF, Chong D, Nanz D, Boss A, Froehlich JM, Andres E, et al. Diffusion-weighted MR imaging of upper abdominal organs: field strength and intervendor variability of apparent diffusion coefficients. Radiology. 2014 Feb;270(2):454–63.
15. Colagrande S, Origgi D, Zatelli G, Giovagnoni A, Salerno S. CT exposure in adult and paediatric patients: a review of the mechanisms of damage, relative dose and consequent possible risks. Radiol Med. 2014 Oct;119(10):803–10.
16. Löwenthal D, Zeile M, Lim WY, Wybranski C, Fischbach F, Wieners G, et al. Detection and characterisation of focal liver lesions in colorectal carcinoma patients: comparison of diffusion-weighted and Gd-EOB-DTPA enhanced MR imaging. Eur Radiol. 2011 Apr;21(4):832–40.
17. Coenegrachts K, De Geeter F, ter Beek L, Walgraeve N, Bipat S, Stoker J, et al. Comparison of MRI (including SS SE-EPI and SPIO-enhanced MRI) and FDG-PET/CT for the detection of colorectal liver metastases. Eur Radiol. 2009 Feb;19(2):370–9.
18. Kinner S, Antoch G, Bockisch A, Veit-Haibach P. Whole-body PET/CT-colonography: a possible new concept for colorectal cancer staging. Abdom Imaging. 2007 Sep-Oct;32(5):606–12.
19. Heijmen L, Verstappen MC, Ter Voert EE, Punt CJ, Oyen WJ, de Geus-Oei LF, et al. Tumour response prediction by diffusion-weighted MR imaging: ready for clinical use? Crit Rev Oncol Hematol. 2012 Aug;83(2):194–207.
20. Lambregts DM, Beets GL, Maas M, Curvo-Semedo L, Kessels AG, Thywissen T, et al. Tumour ADC measurements in rectal cancer: effect of ROI methods on ADC values and interobserver variability. Eur Radiol. 2011 Dec;21(12):2567–74.
21. Hardie AD, Naik M, Hecht EM, Chandarana H, Mannelli L, Babb JS, et al. Diagnosis of liver metastases: value of diffusion-weighted MRI compared with gadolinium-enhanced MRI. Eur Radiol. 2010 Jun;20(6):1431–41.
22. Parikh T, Drew SJ, Lee VS, Wong S, Hecht EM, Babb JS, et al. Focal liver lesion detection and characterization with diffusion-weighted MR imaging: comparison with standard breath-hold T2-weighted imaging. Radiology. 2008 Mar;246(3):812–22.
23. Soret M, Bacharach SL, Buvat I. Partial-volume effect in PET tumor imaging. J Nucl Med. 2007 Jun;48(6):932–45.
24. Boellaard R, Delgado-Bolton R, Oyen WJ, Giammarile F, Tatsch K, Eschner W, et al. FDG PET/CT: EANM procedure guidelines for tumour imaging: version 2.0. Eur J Nucl Med Mol Imaging. 2015 Feb;42(2):328–54.
25. Charnsangavej C, Clary B, Fong Y, Grothey A, Pawlik TM, Choti MA. Selection of patients for resection of hepatic colorectal metastases: expert consensus statement. Ann Surg Oncol. 2006 Oct;13(10):1261–8.
26. Nordlinger B, Sorbye H, Glimelius B, Poston GJ, Schlag PM, Rougier P, et alPerioperative chemotherapy with FOLFOX4 and surgery versus surgery alone for resectable liver metastases from colorectal cancer (EORTC Intergroup trial 40983): a randomised controlled trial. Lancet. 2008 Mar 22;371(9617):1007–16.
27. Qayyum A. Diffusion-weighted imaging in the abdomen and pelvis: concepts and applications. Radiographics. 2009 Oct;29(6):1797–810.
28. Dale BM, Braithwaite AC, Boll DT, Merkle EM. Field strength and diffusion encoding technique affect the apparent diffusion coefficient measurements in diffusion-weighted imaging of the abdomen. Invest Radiol. 2010 Feb;45(2):104–8.
29. Choi SY, Kim SH, Park CK, Min JH, Lee JE, Choi YH, et al. Imaging Features of Gadoxetic Acid-enhanced and Diffusion-weighted MR Imaging for Identifying Cytokeratin 19-positive Hepatocellular Carcinoma: A Retrospective Observational Study. Radiology. 2018 Mar;286(3):897–908.
30. Gluskin JS, Chegai F, Monti S, Squillaci E, Mannelli L. Hepatocellular Carcinoma and Diffusion-Weighted MRI: Detection and Evaluation of Treatment Response. J Cancer. 2016 Jul 13;7(11):1565–70.
31. Holzapfel K, Reiser-Erkan C, Fingerle AA, Erkan M, Eiber MJ, Rummeny EJ, et al. Comparison of diffusion-weighted MR imaging and multidetector-row CT in the detection of liver metastases in patients operated for pancreatic cancer. Abdom Imaging. 2011 Apr;36(2):179–84.
32. Namasivayam S, Martin DR, Saini S. Imaging of liver metastases: MRI. Cancer Imaging. 2007 Feb 1;7(1):2.
33. Donati OF, Hany TF, Reiner CS, von Schulthess GK, Marincek B, Seifert B, et al. Value of retrospective fusion of PET and MR images in detection of hepatic metastases: comparison with 18F-FDG PET/CT and Gd-EOB-DTPA-enhanced MRI. J Nucl Med. 2010 May;51(5):692–9.
34. Eiber M, Fingerle AA, Brügel M, Gaa J, Rummeny EJ, Holzapfel K. Detection and classification of focal liver lesions in patients with colorectal cancer: retrospective comparison of diffusion-weighted MR imaging and multi-slice CT. Eur J Radiol. 2012 Apr;81(4):683–91.