Abstract
Introduction: Poor nutritional knowledge at an early stage of life suggests developing poor dietary habits that later leads to obesity and attendant complications of non-communicable diseases. This study examined gender differences in nutritional knowledge, dietary pattern, and the prevalence of overweight/obesity among students of a private tertiary institution in Tartous University, Syria.
Materials and Method: A total of 214 students were used for this study and were selected from the six colleges of the university. A semi-structured questionnaire was used to collect information on personal and lifestyle characteristics, feeding pattern and physical activity. Weight and height measures were used to calculate Body Mass Index (BMI). Data were analyzed using descriptive statistics and chi square test at 5% level of significance.
Results: The mean age of the students was 20.89 ± 3.89 years. Monthly allowance of ≥ 500,000.00 Syrian pound was received by 64% of the students; 79.9% and 78% of them had fathers and mothers respectively with university degree. Physical body exercise was not done by 40.2% of the students. More than two thirds (69.2%) of the students took < 3 meals/day and 59.8% of them skipped breakfast. Dietary diversity of the students showed 71.0% and 20.6% of average and high score respectively. The mean BMI was 24.60 ± 3.70. The students had BMI <25 (63.6%) and ≥ 25 (36.4%). Nutritional knowledge of the students reflected 10.7% (low), 72.9% (average) and 16.4% (high). There was no gender difference in BMI, knowledge and dietary diversity.
Conclusion: The study reveals inadequate nutritional knowledge, poor feeding habits and dietary diversity and high prevalence of overweight/obesity. Great emphasis needs to be given to nutrition education and promotion among university students.
Keywords
Nutritional knowledge, Dietary diversity, Overweight, Obesity
Introduction
The adolescent and young adulthood frames of life offer a crucial window of opportunity for health promotion and disease prevention. At this stage, individuals are free from the influence of parents and take personal decisions on food choices and other lifestyle habits. As a result, people are likely to develop unhealthy eating habits and have low physical activity levels [1]. University students fall within this stage of their lifecycle. Therefore, university students can be a potential target for the promotion of healthy lifestyles to reduce the risks of lifestyle-related disorders later in life [2]. Such lifestyle-related disorders include obesity and non-communicable diseases such as heart disease, atherosclerosis, and stroke [3]. Obesity, diabetes, hypertension, and cancer have been found among university students [4].
Lack of skills in selecting healthy foods may have a negative impact on their eating habits and nutritional status. Poor eating habits and obesity are critical public health issues among university students.
Globally, there is an increasing prevalence of overweight and obesity among university students. In Saudi Arabia, 31-52% of university students were overweight and obese [5,6]. In Egypt, 37% were found to be overweight and obese [7]. In Sudan, 14% were overweight and obese [8]. In Bahawalpur, 26% were overweight and obese [9].
In Nigeria, an increasing prevalence of overweight and obesity and poor dietary habits among university students was found. In 2018, 20% of university students were overweight and obese [10]. In 2020, 22% were overweight and obese [11]. In 2019, 20% were overweight and obese [12]. 27% were overweight and obese in 2021 [13].
Several factors have been associated with poor dietary patterns and overweight and obesity. These include sedentary lifestyle [5,6], poor nutritional knowledge, low physical exercise [9,14], frequent snacking [6,8], skipping breakfast [10], high monthly allowance [11], high socioeconomic status of parents [12], and gender [10,13]. This study was designed to assess the gender difference in dietary diversity, nutritional knowledge, and weight status among students at a private university in Tartous, Syria. This could provide insights for the development of future intervention and nutrition education programs that aim to improve the nutritional status of university students.
Materials and Methods
Study design
A cross-sectional research design was conducted on a sample of 214 students in Tartous University among the six colleges.
Study setting
The study was carried out in Tartous University, Syria. The institution offers academic programs in five colleges; College of Sciences, College of Law, College of Engineering, College of Social and Management Sciences, College of Medicine and Health Sciences. The University runs programs both at undergraduate and postgraduate levels.
Study population
The respondents for this study were undergraduates from the six colleges of the University which are: College of Medicine and Health Sciences, College of Law, College of Sciences, College of Social and Management Sciences, College of Engineering, and College of Pharmacy.
Sample size determination
Taking a precision of 0.05 at 95% confidence Interval (Z), the minimum sample size (N) was calculated by simple proportion based on 50% estimated prevalence of eating pattern, the minimum sample size used was 216.
Sampling procedures
Base on the sample size (216), this was divided among the six colleges in the university as follow: College of Science (28), College of Medicine and Health Sciences (61), College of Law (26), College of Social and Management Sciences (21), College of Engineering (14) and College of Pharmacy (64). These were further distributed to the various departments in each of the college, and further distributed to both male and female.
Instrument for data collection
A semi-structured interviewer-administered questionnaire was used to collect data. The questionnaire had six (6) sections based on the specific objectives. These include socio-demographic characteristics, life-style, feeding pattern, anthropometry profile, nutrition knowledge, and dietary diversity. Socio-demographic data collected include age, gender, education levels of parents, and student’s monthly allowance. Dietary diversity was used to collect information on dietary patterns. Bathroom scale and height meter were used to measure weight and height of the respondents respectively. These data were used to calculate Body Mass Index (BMI).
Data collection
Anthropometric measurements of the subjects were taken using standard apparatus. The measurements included weight and height.
Weight measurement: Weight was measured to the nearest 0.1 kg with newly purchased portable bathroom scales (Harson bathroom scale, model: H89 DK BLUE FA00333) respondents were asked to step on scale removing their shoe and other materials like phone and other items that can add to weight, respondents were asked to stand straight looking straight, no movement of the body and toe not protruding.
Height measurement: Height was measured to the nearest 0.1 m using a stadiometer. Each subject was asked to take off his or her shoes and stand upright with hands by the side and measurement was done to the nearest 0.1 m.
BMI was calculated as weight (kg) divided by the square of height (m2) and then categorized according to WHO recommendations to define weight as follow: BMI <18.5 (underweight), BMI = 18.5-24.9 (normal weight), BMI = 25.0 - 29.9 (overweight) and BMI ≥ 30 (obesity).
Dietary diversity
The dietary diversity of the respondents was obtained from the dietary diversity score (DDS) which is defined as the number of different food groups consumed in the 24 hours preceding the interview [15]. The information collected from the 24 h dietary recall was used to calculate the DDS of each respondent. In this study, a 9 food-group aggregation was created from the list of food groups created from the 24 hr recall. The aggregated 9 food groups (starchy staples, dark green leafy vegetables, other Vitamin A rich fruits and vegetables, other fruits and vegetables, organ meat, meat and fish, eggs, legumes and seeds/nuts, milk and milk products) was then used to create the diversity scores with each group carrying a score. Respondents with a score less than 3 were regarded as low dietary diversity; those with scores of 4 and 5 had medium dietary diversity while those with a score of 6 and above had high dietary diversity.
Nutrition knowledge
The nutrition knowledge of the respondents was measured using 15 questions reflecting nutrition matter. Correct answers were allocated a score of 1, while incorrect answers were allocated a score of zero. Based on their answers to these questions their scores were added up and graded into good (11-15), average (6-10) and low (0-5).
Data analysis
Data entry and analysis was done using statistical package for the social science (SPSS) software version 20. Data cleaning was done by running frequencies of all relevant variables to identify inadequate entries and missing values. Descriptive statistics were generated; categorical variables were presented using frequency and percentages. Chi square was done to establish association between variables.
Ethical consideration
An informed consent form was given to the students to fill in for consent. Participation was voluntary and anonymous with no incentives provided and data was confidential and protected. The details of the study were explained to the students and those students who were willing participated in the study. All measurements were taken during free or break periods so as not to disrupt academic activities. The Ethical Committee of Tartous University gave approval for the study.
Results
Respondents’ personal and lifestyle characteristics
Tables 1 and 2 show the personal and lifestyle characteristics of the respondents with 68.7% below the age of 20 years and 31.3% having an age above 20 years (Table 1). The mean age of the respondents was 20.89 ± 3.89 years. A greater proportion (74.8%) of the females were below 20 years of age compared with 58.2% of males. A little above one third (36.0%) received less than 500,000.00 Syrian pounds in a month and 64.0% received ≥ 500,000.00 Syrian pounds in a month. The majority (79.9%) of their fathers had a university degree and 78.0% of their mothers had a university degree. Most (83.5%) of the mothers of the male students compared to female students (74.8%) had a university degree.
|
Characteristics |
Male Freq (%) |
Female Freq (%) |
Total |
|
Age (years) |
|||
|
<20 |
46 (58.2) |
101 (74.8) |
147 (68.7) |
|
≥ 20 |
33 (41.8) |
34 (25.2) |
67 (31.3) |
|
Monthly allowance |
|||
|
<500,000.00 SP |
28 (35.4) |
49 (36.3) |
77 (36.0) |
|
≥ 500,000.00 SP |
51 (64.6) |
86 (63.7) |
137 (64.0) |
|
Father education |
|||
|
Post-secondary or less |
16 (20.3) |
27 (20.0) |
43 (20.1) |
|
University degree |
63 (79.7) |
108 (80.0) |
171 (79.9) |
|
Mother education |
|||
|
Post-secondary or less |
13 (16.5) |
34 (25.2) |
47 (22.0) |
|
University degree |
66 (83.5) |
101 (74.8) |
167 (78.0) |
|
Mean age (male)=21.20 ± 2.06. Mean age (female)=20.71 ± 1.78. Mean age (total)=20.89 ± 3.89 |
|||
Respondents’ lifestyle characteristics (Table 2) reveal that the majority of the respondents did not take alcohol (75.7%) nor smoke (88.8%) but took soft drinks (74.3%). Only 17.3% of the respondents carried out physical body exercise daily and 40.2% did not perform physical body exercise in a week.
|
Characteristics |
Male Freq (%) |
Female Freq (%) |
Total |
|
Taking alcohol |
|||
|
Yes |
51 (58.2) |
101 (25.2) |
152 (71.1) |
|
No |
28 (41.8) |
34 (74.8) |
62 (28.9) |
|
Smoking |
|||
|
Yes |
24 (30.4) |
28 (20.7) |
24 (11.2) |
|
No |
55 (69.6) |
107 (79.3) |
190 (88.8) |
|
Taking soft drink |
|||
|
Yes |
59 (74.7) |
103 (76.3) |
52 (74.3) |
|
No |
20 (25.3) |
32 (23.7) |
61 (25.7) |
|
Body exercise |
|||
|
Daily |
13 (16.5) |
24 (17.8) |
37 (17.3) |
|
Occasionally |
45 (57.0) |
49 (36.3) |
94 (43.9) |
|
Rarely |
21 (26.5) |
62 (45.9) |
83 (38.8) |
|
Body exercise/week |
|||
|
None |
25 (31.6) |
61 (45.2) |
86 (40.2) |
|
1-3 times |
39 (49.4) |
56 (41.5) |
95 (44.4) |
|
≥4 times |
15 (19.0) |
18 (13.3) |
33 (15.4) |
|
Hour of body exercise/day |
|||
|
<1 |
40 (50.6) |
92 (68.1) |
132 (61.7) |
|
≥1 |
39 (49.4) |
43 (31.9) |
82 (38.3) |
Feeding habits of respondents
Table 3 shows the feeding habits of the respondents. About one third (30.8%) took three or more meals in a day and 72.0% skipped meals. The major meal skipped was breakfast (59.8%) and 64.5% took it ≤ 3 times in a week. Females took more meals than males.
|
Characteristics |
Male Freq (%) |
Female Freq (%) |
Total |
|
Number of meals/day |
|||
|
<3 |
57 (72.2) |
91 (67.4) |
148 (69.2) |
|
3 |
17 (21.5) |
19 (14.1) |
36 (16.8) |
|
>3 |
5 (6.3) |
25 18.5) |
30 (14.0) |
|
Skipping meals |
|||
|
Yes |
55 (69.6) |
99 (73.3) |
154 (72.0) |
|
No |
24 (30.4) |
36 (26.7) |
60 (28.0) |
|
Meal skipped |
|||
|
Breakfast |
53 (67.1) |
75 (55.6) |
128 (59.8) |
|
Lunch |
24 (30.4) |
51 (37.8) |
75 (35.0) |
|
Dinner |
2 (2.5) |
9 (6.6) |
11 (5.2) |
|
Number breakfast/week |
|||
|
≤3 |
54 (68.4) |
84 (62.2) |
138 (64.5) |
|
4-5 |
17 (21.5) |
38 (28.1) |
55 (25.7) |
|
6-7 |
8 (10.1) |
13 (9.7) |
21 (9.8) |
Dietary diversity of respondents
Figure 1 reveals the dietary diversity of the respondents with 71.0% having medium dietary diversity with more females (74.8%) than males (64.6%).
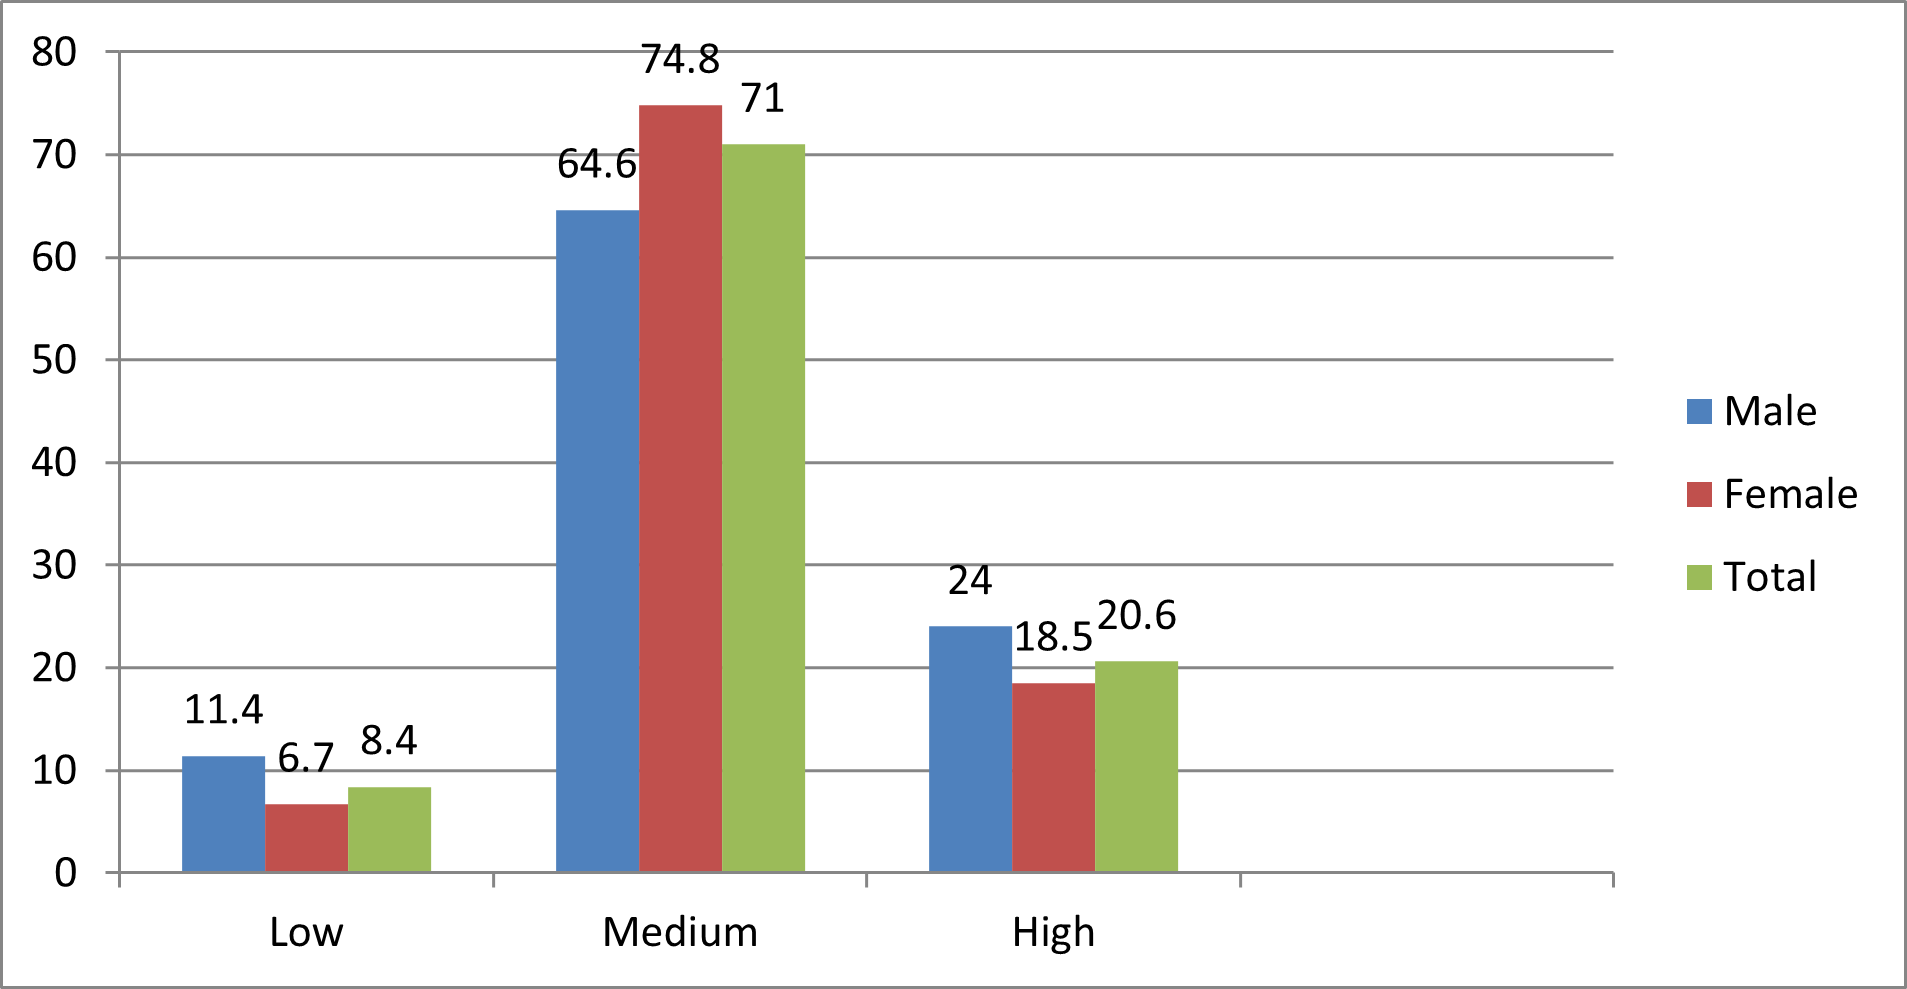
Figure 1. Dietary diversity of respondents.
Nutritional knowledge of respondents
Figure 2 shows the nutritional knowledge of the respondents. Only 16.4% of the respondents had good knowledge while the majority (72.9%) had average knowledge.

Figure 2. Nutritional knowledge of respondents.
Weight perception and BMI of respondents
Respondents’ weight perception and BMI are shown in Table 4. The majority (73.8%) believed that they had normal weight, 77.6% were satisfied with their weight and 22.4% were dissatisfied. Only 37.4% were trying to lose weight. More than one third (36.5%) of the respondents were overweight/obese and 6.1% were underweight.
|
Characteristics |
Male Freq (%) |
Female Freq (%) |
Total |
|
Weight perception |
|||
|
Underweight |
11 (13.9) |
21 (15.6) |
32 (15.0) |
|
Normal weight |
59 (74.7) |
99 (73.3) |
158 (73.8) |
|
Overweight |
6 (7.6) |
15 (11.1) |
21 (9.8) |
|
Obesity |
3 (3.8) |
0 (0.0) |
3 (1.4) |
|
Satisfied with current weight |
|||
|
Very satisfied |
19 (24.1) |
31 (23.0) |
50 (23.4) |
|
Satisfied |
40 (50.5) |
76 (56.3) |
116 (54.2) |
|
Dissatisfied |
10 (12.7) |
23 (17.0) |
33 (15.4) |
|
Very dissatisfied |
10 (12.7) |
5 (3.7) |
15 (7.0) |
|
Tried to lose weight in the last 12months |
|||
|
Yes |
23 (29.1) |
57 (42.2) |
80 (37.4) |
|
No |
56 (70.9) |
78 (57.8) |
134 (62.6) |
|
BMI |
|||
|
Underweight (<18.5) |
5 (6.3) |
8 (5.9) |
13 (6.1) |
|
Normal weight (18.5-24.99) |
46 (58.2) |
77 (57.0) |
123 (57.5) |
|
Overweight (25.0-29.99) |
19 (24.1) |
25 (18.5) |
44 (20.6) |
|
Obesity (≥30) |
9 (11.4) |
25 (18.5) |
34 (15.9) |
Gender differences in dietary diversity, nutritional knowledge, and BMI of respondents
Table 5 shows the gender differences in dietary diversity, nutritional knowledge, and BMI of the respondents. There was no gender difference in dietary diversity, nutritional knowledge, and body mass index of the respondents.
|
|
Gender |
|
|
|
|
|
Characteristics |
Male N (%) |
Female N (%) |
Total |
Chi-square |
p-value |
|
Dietary diversity |
|||||
|
Low (<3) |
9 (50.0) |
9 (50.0) |
18 |
2.803 |
0.246 |
|
Average (3-5) |
51 (33.6) |
101 (66.4) |
152 |
||
|
Good (6-7) |
19 (43.2) |
25 (56.8) |
44 |
||
|
Knowledge |
|||||
|
Low (0-5) |
12 (52.2) |
11 (47.8) |
23 |
3.022 |
0.221 |
|
Average (6-10) |
53 (34.0) |
103 (66.0) |
156 |
||
|
Good (11-15) |
14 (40.0) |
21 (60.0) |
35 |
||
|
BMI |
|||||
|
<18.5 |
5 (38.5) |
8 (61.5) |
13 |
2.360 |
0.501
|
|
18.5-24.99 |
46 (37.4) |
77 (62.6) |
123 |
||
|
25.0-29.99 |
19 (43.2) |
25 (56.8) |
44 |
||
|
≥30.0 |
9 (26.5) |
25 (73.5) |
34 |
||
Discussion
Personal and lifestyle characteristics
The study samples were majorly adolescents and young adults and parents with high socio-economic status. This finding is similar to that of the students of Igbinedion University in Nigeria, with 85% of the students having parents with tertiary level education [12]. The monthly allowance is higher than that of public university students [10,11,16].
They had a sedentary lifestyle. Their physical activity level is similar to the finding of Shehata et al. among Saudi Arabia university students [5] but a higher proportion of the sample performed physical exercise per week compared to the students at the University of Tartous with 4% of them engaging in physical exercise between 3–5 times a week [14] and Pakistanian University students in Bahawalpur with 2% vigorously active [9]. Students with high monthly allowances frequently consume energy-laden snacks, which is a risk factor for overweight and obesity.
Feeding and dietary diversity of respondents
Nearly one-third of the students took three or more meals in a day. More than two-thirds skipped meals and nearly two-thirds skipped breakfast. There was no gender difference in meal skipping. The finding on breakfast consumption is higher compared to some Nigerian studies [17-19] where 50% or less skipped breakfast. However, it is lower in comparison with the Indian students [20] and other Nigerian students in Sagamu [13] where more than two-thirds skipped breakfast. Findings are meal skipping is similar to that of [10] among university students in Lagos State, Nigeria and higher than the findings of Lano-Maduagu [11], which was 52%. It is, however, lower than the 92% found among students in Sagamu, Nigeria [13]. The current study is similar to Dahal et al. [21] because there was no gender difference in meal skipping.
This dietary habit of skipping meals, especially breakfast meals, is a risk for accumulation of weight and cardiovascular problems [22]. Skipping meals has been associated with obesity [23]. Obesity has been associated with skipping meals [6]. They found obese students consuming foods rich in calories such as snacks. Consumption of snacks has been associated with obesity among university students in Nigeria [24].
Dietary diversity
More than two-thirds had medium dietary diversity. Both genders were in the same category. This finding is higher compared to 35% of Indian students with poor dietary diversity in 2020 [20]. But lower compared to another Indian study in 2021 with 61% of students having a high dietary diversity score [25].
However, there was no gender difference in the current study unlike in the Indian students, who had significant gender difference in the mean dietary diversity score. Poor dietary diversity has been associated with abnormal weight gain [20]. Dietary practices have been associated with obesity [26] among private university students.
Nutritional knowledge
About three-quarters of the respondents had average nutritional knowledge. This was higher in female than male. Our finding is lower compared to students in public institutions in Nigeria, which had between 52% and 75% of students with good knowledge [14,17]. However, it correlates to these students from public institutions in terms of gender difference.
Overweight and obesity
More than one-third of the students were overweight and obese. This prevalence is lower in comparison with students at the University of Uyo, Nigeria with 42% prevalence [27] and university students in Saudi Arabia where the prevalence was 52% [5]. But similar to the findings of [6] among Saudi Arabian university students in 2022 and Egyptian students with 37% prevalence in 2020 [7]. It is however higher than Indian students of 26% [9] and Sudanese students of 14% [8] and other Nigerian students which were about one-quarter [10,11,13].
Greater proportion of the females were overweight and obese, but this was not significant. This is similar to the finding of Riggs [28] among American students and University of Uyo students, Nigeria [27].
Weight Perception
One-tenth of the sampled students perceived that they were overweight and obese. This is lower compared to American college students with 26% [28]. About one quarter of the students were not satisfied with their current weight. This is in contrast to 50% among American students. Those who desired weight loss were lower compared to 65% among American students [28].
There is a wide gap between the proportion of students that were overweight and obese in relation to those that perceived that they were overweight and obese. This implies that a good proportion of the students lacked knowledge of their weight status. Overweight and obese students have been observed to have lower academic performance [5,29]. Chronic health problems such as hypertension and asthma are more reported among obese students globally [5]. Overweight and obesity are a risk factor for cardiovascular diseases. Obesity was found to affect dietary habits among students of Igbinedion University, Nigeria [12].
Gender differences in dietary diversity, nutritional knowledge, and BMI
It was observed that there was no significant difference in dietary diversity, nutritional knowledge, and BMI across gender. There are studies whose findings are contrary to the findings of this current study. The findings of Samuel et al. [30] among secondary school adolescents in Owo LGA, Nigeria showed that there was significant gender difference in BMI. The study of Sholeye et al. [13] revealed a significant gender difference in overweight and obesity with females more overweight and obese. But Magulod Jr and Capili [29] and Alkazemi [31] found males having higher weight than females. Significant gender difference in dietary diversity score was also observed by Kumar et al. [20] among Indian students where higher Dietary Diversity Score mean was observed in males compared to females.
Higher weight was found among males than females among university students in an Asian country in 2019 [29]. A study among University of Nigeria, Nsukka, found females to have significant good nutrition knowledge compared to males [14]. Males were more obese than female students in Saudi Arabia [5]. Females were more obese compared to males among university students of Health and Allied Sciences in Sagamu, Nigeria [13]. Dietary diversity score was higher in males than females among students in Karnataka, India [32].
Conclusion
This study revealed high prevalence of overweight and obesity with no gender differences in weight, nutritional knowledge, and dietary diversity. The students had a fair perception of their weight, but their dietary and lifestyle practices betray their weight perception.
Recommendation
Nutrition education intervention program is suggested among university students. This should focus on behavior change in nutrition knowledge, dietary habits, and lifestyle practices.
References
2. Ali EA, Shehata WM. Eating disorder risk among medical students at Tanta University, Egypt. Egyptian J Community Med. 2020 Oct;38(4):17-23.
3. Aljefree NM, Shatwan IM, Almoraie NM. Impact of the intake of snacks and lifestyle behaviors on obesity among university students living in Jeddah, Saudi Arabia. Healthcare (Basel). 2022 Feb 21;10(2):400.
4. Alkazemi D. Gender differences in weight status, dietary habits, and health attitudes among college students in Kuwait: A cross-sectional study. Nutrition and Health. 2019 Jun;25(2):75-84.
5. Dada SO, Oyewole OE, Desmennu AT. Knowledge as Determinant of Healthy-Eating Among Male Postgraduate Public Health Students in a Nigerian Tertiary Institution. International Quarterly of Community Health Education. 2021 Oct;42(1):103-14.
6. Dahal M, Basnet A, Khanal S, Baral K, Dhakal S. Gender Difference in Food Choice and Eating Practice and Their Association with Health among Students of Kathmandu, Nepal. J Obes. 2022 Aug 25;2022:2340809.
7. FAO. 2007. Guidelines for Measuring Household and Individual Dietary Diversity. FAO Nutrition and Consumer Protection Division, with Support from the EC/FAO Food Security Information for Action Programme and the Food and Nutrition Technical Assistance (FANTA) Project.
8. Ikujenlola AV, Adekoya TS. Nutritional status and feeding habits of females in public and private Universities in Osun state, Southwestern, Nigeria. Heliyon. 2020 Sep 1;6(9):e05023.
9. Kolobarić N, Gradinjan Centner M, Šušnjara P, Matić A, Drenjančević I. Anthropometric and biochemical parameters in relation to dietary habits as early indicator of cardiovascular impairment in young adult cohort. International Journal of Environmental Research and Public Health. 2020 Dec;17(24):9208.
10. Kumar A, Ayub A, Roy R, Rai A, Ameta B, Latheef A, et al. Assessment of diet diversity and eating pattern of undergraduate students: a Pan India study. International Journal of Medicine and Public Health. 2020 Jun 30;10(2):58-63.
11. Lano-Maduagu T. Assessment of Nutritional Status of Undergraduate Students in Tertiary Institutions in Lagos State.
12. Magulod Jr GC, Capili JD. Anthropometric status and eating behavior as predictors of University Students’ Academic Achievement. Asia Pac J Multidiscip Res. 2019 May;7(2):32-42.
13. Mohammed ES. Assessment of Nutritional Status and Its Related Factors among Undergraduate Students in Juba University, Sudan. East African Scholars J Med Sci. 2020;3:223-32.
14. Nagheer D, Irvin R, Younger-Coleman N. Overview of the prevalence and Associated Risk, factors of Lifestyle Diseases in University students. International Journal of Clinical Medicine. 2017 May 31;8(05):344-52.
15. Namgha T. A Study on Food Consumption Pattern of The Tibetan College Students in Dalai Lama Institute for Higher Education Bengaluru, Karnataka. Journal of Education, Management and Development Studies. 2021 Dec 30;1(3):19-25.
16. Nani MO. Relationship between nutrition knowledge and food intake of college students. MSc Thesis Kent State University College of Education, Health, and Human Services.
17. Nelson MC, Story M, Larson NI, Neumark-Sztainer D, Lytle LA. Emerging adulthood and college-aged youth: an overlooked age for weight-related behavior change. Obesity. 2008 Oct 1;16(10):2205-11.
18. Niba LL, Atanga MB, Navti LK. A cross sectional analysis of eating habits and weight status of university students in urban Cameroon. BMC Nutrition. 2017 Dec;3:55.
19. Ogundele AE, Aleru EO, Bodunde IO, Gbenro OE. Drivers of food choice, meal pattern, and lifestyle habits among undergraduate students in Lead City University, Ibadan, Oyo State, Nigeria. World Nutrition. 2023 Jun 30;14(2):66-74.
20. Okeke CC, Agwu-Umahi OR, Umeobieri AK, Azodo C, Idoko AC, Uzochukwu BSC. Dietary habits and physical exercise among undergraduate students in Southeast Nigeria. Nigerian Journal of Medicine. 2020 May 4;29(1):29-37.
21. Okondu OE, Ogueri C, Afolabi A, Ifediora U. Dietary Practices Associated with Obesity among Babcock University Students in Ilishan-Remo, Ikenne Local Government Area, Ogun State, Nigeria.
22. Olatona FA, Onabanjo OO, Ugbaja RN, Nnoaham KE, Adelekan DA. Dietary habits and metabolic risk factors for non-communicable diseases in a university undergraduate population. Journal of Health, Population and Nutrition. 2018 Aug 16;37(1):21.
23. Omage K, Omuemu VO. Factors associated with the dietary habits and nutritional status of undergraduate students in a private university in Southern Nigeria. Niger J Exp Clin Biosci. 2019;7:7-16.
24. Opara D, Ekpin V, Ukpong A, Itanka U, Akpan DA, Jonah M, et.al. Factors Associated with Overweight and Obesity Among Tertiary Education Students in Uyo, South-South Nigeria. IOSR Journal of Dental and Medical Sciences. 2020;19(Issue 9 Ser.1):43-53.
25. Oroniran OO, Olawuyi YO, Fadupin GT, Takpatore P. Snack and Beverage Consumption Patterns among Undergraduates at a Private Nigerian University. World Nutrition. 2020;11(1):42-57.
26. Rana S, Ahmad K, Asif HM, Wadood A. Nutritional Assessment among Undergraduate Students of the Islamia, University of Bahawalpur. J Food Nutr Disor. 2020;9:5.
27. Riggs A. Perceptions about overweight and obesity among College Students: Application of the health belief model. MSc Thesis at Graduate School at Appalachian State University. 2017.
28. Samuel IB, Alonge AO, Kareem AJ, Salau QO, Jegede TO, et al. Overweight and Obesity and Associated Factors among School-Aged Adolescents in Nigeria. J Obes Weight-Loss Medic. 2022;8:045.
29. Shehata SF, Althubait BM, AboTamrah AA, Alotaibi KM, Amer KA, Aldosari AA, et.al. Prevalence of Obesity among King Khalid University students in, 2020, Saudi Arabia. Middle East Journal of Family Medicine. 2021 Apr 1;19(4):18-25.
30. Sholeye OO, Omisore ME, Animasahun VJ. Meal Skipping Among Undergraduate Health and Allied Sciences Students in Sagamu, Nigeria. African Journal of Biomedical Research. 2021 Sep 30;24(3):459-64.
31. Udoh ES. DIETARY DIVERSITY AMONG FEMALE STUDENTS IN PUBLIC UNIVERSITIES OF AKWA IBOM STATE, NIGERIA. Nigeria Agricultural Journal. 2020 Aug 30;51(1):425-33.
32. Von Bothmer MI, Fridlund B. Gender differences in health habits and in motivation for a healthy lifestyle among Swedish university students. Nursing & health sciences. 2005 Jun;7(2):107-18.