Abstract
DNA repair eukaryotic cells have additional protective mechanisms that avoid uncontrolled interaction of different parts of the chromatin and damaged regions. Key factors here are the regulation of chromatin density and mobility. The 4D (temporal and spatial) organization of chromatin is controlling this security barrier by regulating the accessibility of genes, flexibility of DNA, and its ability to move inside the nucleus. How this regulation mechanisms are involved in DNA repair upon radiation damage is until now rarely known but an important part to understand the enhanced effectiveness of high linear energy transfer (LET) particles. The damage recognition via PARP1 and the subsequent chromatin decondensation via PARylation is a crucial step in the DNA damage response (DDR). Upon We used the SNAKE microbeam with a beam spot size of <1 µm to induce highly localized DNA damage in living cells using 55 MeV Carbon ions to investigate the chromatin rearrangements in the early stage of DDR. The nuclei were irradiated with a cross pattern consisting of 1000 ions per spot and 25 spots per cell either with one (11 000 Gy), two (22 000 Gy), or three crosses (33 000 Gy). The chromatin rearrangement was imaged live for several minutes after irradiation at the beam using SiR chromatin stain. Upon 91% of the cells show a localized decondensation starting from a few seconds up to minutes after irradiation. The chromatin is decondensed by 6%-8% in the beam path with a local condensation at the edges of up to 8%. Our results suggest that chromatin decondensation is a fast process in the first few seconds after damage induction. Furthermore, decondensation status does not change over minutes, which gives evidence that this process and therefore DDR is paused or even stopped. In combination with the existing knowledge about early reactions to damage induction our data support the model of PARP induced chromatin decondensation. Furthermore, it is evident that also ultra-high doses of radiation are, in first place not able to inactivate initial basal mechanisms as response to damage induction.
Keywords
Particle irradiation, Chromatin rearrangement, Basal mechanisms, Live-cell imaging
Introduction
The DNA is the carrier of the human genome and consequently a vulnerable target of damaging agents in human cells such as chemicals or ionizing radiation. During evolution, a complex DNA protecting system has been developed in eukaryotic cells. This system mainly consists of two stages. First, the arrangement of chromatin in the cell nucleus and second, the complex repair mechanisms. The complex four-dimensional arrangement of the chromatin is formed to protect the genome from damage throughout the cell cycle as much as possible and, if damage on the DNA occurs, prevents uncontrolled interaction of the damage locations. The regulation of DNA density and mobility is responsible for the accessibility of genes, the flexibility and mobility of DNA and requires complex DNA-protein and protein-protein interactions [1]. These interactions also play a key role in the reactions after damage induction [2], where a balance has to be found between protecting important genes and opening the chromatin for the DNA repair [3]. Looking at the structure of chromatin, the first step is the formation of the DNA double helix, which is then wrapped around the histone complexes. This 10 nm wide DNA-histone chain form the so-called 30 nm fiber, where the DNA is wrapped around itself. This fiber is the first protecting barrier of the higher-order chromatin structure and additionally prevents extensive chromosome movement [4]. Additionally, through the tri-methylation of the histone H3 at lysine 9 (H3K9), the DNA complex is even more condensed forming so-called heterochromatin [5]. This step decreases transcription and destructive enzyme activity and further preserves chromatin [6].
As ionizing radiation interacts with all molecules within a cell through ionization and breakage of chemical bonds, the protective mechanisms provoked by the chromatin folding do not fully prevent the DNA from getting damaged [7]. Therefore, it must be possible to activate and recruit diverse chromatin remodeling complexes to the damaged region independent of chromatin density. These remodeling complexes ensure through decondensation of DNA, that the accessibility of DNA is restored, repair factors can cluster at the damage site and the DNA can be repaired. Poly [ADP-ribose] polymerase 1 (PARP1) is responsible for the recognition of single and double-strand breaks in the cell nucleus [8,9]. It triggers a post-translational modification resulting in DNA decondensation, the so-called PARylation [10]. It is responsible for the formation of a PAR chain [8]. It contains up to 200 stringed ADP-ribose residues and serves as a platform for DNA repair protein binding. PARP1 has approximately 1-2 million copies within a single cell nucleus and is, therefore, one of the most abundant nuclear proteins. But due to the low activation level of PARP under normal conditions, the level of basal PARylation is very low. One copy of inactive PARP1 scans ~10 nucleosomes and once a break is detected gets activated and PARylation starts. The halftime of PARP1 recruitment is in the order of 1 s. The speed and efficiency of this post-translational modification are due to the huge amount of PARP1 in the nucleus and the efficient scanning of nucleosomes. Upon this PARP triggered chromatin decondensation the clustering of repair proteins starts. These proteins are extracted from clusters in the surrounding, the so-called liquid demixing [11], and form liquid-like droplets in the region of the decondensed DNA [12,13]. Two of the most important steps for DNA repair is the antaxia-telangiectasia mutated (ATM)-dependent phosphorylation of histone variant H2AX to from γH2AX [14] and casein kinase 2 (CK2) dependent phosphorylation of MDC1 (mediator of DNA damage checkpoint protein 1) [15]. Phosphorylation of MDC1, which binds to γH2AX is responsible that more ATM can be activated and consequently more γH2AX can be formed, which amplifies the damage recognition signal and makes the damage amenable to microscopic imaging [16]. These processes start approximately between 10 s – 20 s after damage induction, therefore PARP1 dependent decondensation must be well advanced or even finished by this time [8].
In this study, we investigated the DNA chromatin rearrangements occurring after highly localized irradiation with high-LET particles. We were interested in the amount of chromatin decondensation at the irradiated sites and also the expansion of chromatin rearrangement in the DNA surrounding the damaged region. Therefore, we irradiated human HeLa cells using carbon ions with a LET of 370 keV/µm focused to a spot size of < 1 µm. Using a live cell imaging setup at SNAKE, cells could be irradiated with cross patterns consisting of 25 irradiation points (1000 ions per point) with three different nuclear doses of 11 000 Gy, 22 000 Gy, and 33 000 Gy. The use of such high doses was supported by previous studies at the same setup, where the limit of PARP1 [9] detection was several hundred ions per point and the accumulation of PCNA was visualized after 1000 ions per point [17]. In this study, these high doses were necessary to get a quantifiable effect. Furthermore, we measured the temporal progression of DNA decondensation after irradiation to be able to establish connections with known DNA repair mechanisms. The temporal development of the chromatin-dependent radiation response up to 540 s after irradiation was documented.
Materials and Methods
Cell culture and seeding
Human HeLa cells (cervical carcinoma cell line, Leibniz-Institute DSMZ- Deutsche Sammlung von Mikroorganismen und Zellkulturen GmbH) were cultured in RPMI medium supplemented with 10% FCS and 1% Pen/Strep at 5% CO2 at 37°C and 100% humidity. One day before irradiation cells were trypsinized with 3 ml Trypsin-EDTA (Sigma-Aldrich, St. Louis, Missouri, USA) for 5 min at 37°C and 100% humidity. Trypsinisation reaction was stopped by adding 7 ml of cell culture medium. The cell suspension was collected and per sample 70,000 cells were seeded in a droplet of 300 µl in the specially designed cell containers. For the experiments, the live-cell containers designed by V. Hable et al. [18] were used, which are customized to meet the experimental requirements for SNAKE experiments at the tandem accelerator in Garching. The containers also conserve physiological conditions as much as possible. Briefly, the containers consist of a bottom and a top part and are made of stainless steel. The bottom part holds the medium reservoir with a capacity of 6 ml within the cell growth area. At the cell growth area, stainless steel is replaced by an EJ-228 Scintillator with 170 µm thickness where the edges are sealed with silicone glue to prevent leakage of the medium. The scintillator gives two opportunities. First is that cells can be imaged live through the scintillator. Second, ion counting can be performed by measuring the scintillation light which is induced by the ions while stopping in the scintillator. The scintillator was tagged with 3.5 µg/cm2 Celltak (Corning™ Cell-Tak Zell- und Gewebekleber, Corning, New York, USA) according to manufacturer’s protocol to ensure that cells can properly attach and do not move during the time of upright irradiation and imaging at SNAKE. The cover of the container is a stainless-steel plate with a hole that allows the ions to reach the cells and allows for phase contrast imaging with transmitted light. This hole is covered by a 4.7 µm thick polypropylene foil which is together with a sealing O-ring clamped between base and cover of the container.
1h after seeding the medium reservoir is filled with 5-6 ml medium supplemented with 100 nM DMSO which is necessary for labeling and the cells are further incubated at 5 % CO2 at 37°C and 100% humidity overnight without cover.
Irradiation
Directly before the experiment, a sample was taken out of the incubator and medium was exchanged with labeling medium and the container was sealed. The irradiation took place at the ion microprobe SNAKE at the tandem Van-de-Graff accelerator in Garching near Munich using 55 MeV carbon ions with a beam spot size of 840 nm ± 60 nm. The targeted irradiation mode was used to be able to target single cells with a cross pattern consisting of 12 spots in horizontal and vertical direction and one spot in the middle (total of 25 spots) with a spot distance of 1 µm. Each spot was irradiated with 1000 ions. Due to energy loss of the ions between vacuum and cells e.g. in the beam exit window (7.5 µm Kapton) and the polypropylene foil of the container the ion energy at the cell surface is reduced to (36 ± 8) MeV which results in a LET of (414 ± 8) keV/µm. Therefore, a local spot dose of approx. 37 000 Gy can be calculated using the formula  with F the ion fluence and ρ the density of target material, which for cells is considered to be the density of water. For a single cell with a size of 150 µm2 hit by one of the 25 spot-crosses, this corresponds to an overall cell dose of ~ 11 000 Gy. This high dose is way out of the range for clinical use and kills the cell. But as only chromatin reorganization within the first minutes after irradiation were imaged, it is still appropriate for these kinds of experiments and was chosen to ensure quantifiable results. For lower doses, the effect is too low to be measurable. The dose was varied by increasing the number of irradiated crosses at the same location. 53% of all cells were irradiated with one cross (~11 000 Gy), 28% were irradiated using two cross patterns (~22 000 Gy), and 19% using three cross patterns (~33 000 Gy).
Irradiation was performed upright at 37°C and took ~ 13 seconds. In total 31 cells were irradiated and, together with 10 control cells, analyzed.
Live-cell labeling and imaging
Cells were labeled with silicon rhodamine (SiR, Spirochrome, Stein am Rhein, Deutschland). SiR dyes have high brightness and photostability and decreased phototoxicity due to their fluorescence spectrum in the far red. SiR dyes in suspension are non-fluorescent and fluorescence is only activated due to binding to target ligands, which decreases background signal in the microscopic application [19].
For labeling cells were incubated with 100 nM DMSO solution overnight after seeding. Just before irradiation, the DMSO medium was replaced by medium containing 1 µM SiR-DNA Kit, which remains on the sample during the whole experiment.
Imaging was performed with a Zeiss Axiovert 200M epifluorescence microscope (Carl Zeiss Microscopy GmbH, Jena, Germany) which is mounted just behind the beam exit at SNAKE and serves as sample stage during irradiation, too. For imaging, a 63x LCI Plan Neofluar objective (Carl Zeiss Microscopy GmbH, Jena, Germany) as well as a 40x Plan Apochromat (Carl Zeiss Microscopy GmbH, Jena, Germany) together with the filter set 50 (Carl Zeiss Microscopy GmbH, Jena, Germany, Excitation: bandpass filter (BP) 640 nm ± 30 nm; Emission: BP 690 nm ± 50 nm, Beamsplitter: 660 nm) and Colibri LED illumination 590 nm ± 27 nm (Carl Zeiss Microscopy GmbH, Jena, Germany) were used. Data acquisition was performed using Zeiss AxioVision Software (Carl Zeiss Microscopy GmbH, Jena, Germany). Images were acquired before irradiation and then consecutive up to 9 min starting 15s after the start of irradiation with the same light intensity and exposure time for each image to be able to quantitatively compare the intensities throughout the experiment.
Analysis
As a measure for chromatin density, the intensity of the SiR signal was used. To quantify the chromatin rearrangement a rectangular region of interest (ROI) on the vertical axis of the irradiated cross pattern was defined manually. The cell movement was considered and corrected. The ROIs mainly contain heterochromatic regions defined by high fluorescence signal in the pre-irradiation images. Nucleoli (almost no fluorescence signal) and euchromatic regions (low intensity) were, where possible, excluded. This was done to lower the variation in the maximum signal and to get more reliable data. The intensity distribution along the perpendicular axis was determined for the cells before irradiation and also 0s, 15s, 180s, 300s, and 420s after irradiation. For each time point also the mean intensity of the cell nucleus was determined to be able to compensate bleaching, out of focus drift, and other intensity variations. Now a local normalized intensity
 was calculated for each measured point k in each timepoint by dividing its local intensity
 by the mean intensity :
 . To be able to compare the chromatin reorganization upon radiation expressed by local intensity decrease or enhancement
 for the time points 0s, 15s, 180s, 300s, 420s, and 540s was compared to the reference before irradiation, to calculate the local intensity change:
 (1)
(1)
For quantification of the decondensation the minimum ΔIk, min , and for the quantification of condensation the maximum ΔIk, max were determined for each cell, and the mean and standard error were calculated for each timepoint and radiation dose.
The width of chromatin decondensation was measured as the full width at half minimum. 0 % chromatin change was used as maximum, as only decondensation should be measured.
Results
In our experiments overall 31 HeLa cells were irradiated with cross patterns with 25 spots (see Figure 1a) with a spot distance of 1 µm and a spot size of 840 nm ± 60 nm. 16 cells received a dose of ~11 000 Gy (37 000 Gy in the arms of the cross pattern), 9 cells received double and 6 cells three times the dose using two or three cross patterns for irradiation. For comparison 10 control cells were evaluated. The position of the cross patterns was chosen such that nucleoli were, where possible, excluded from irradiation as the chromatin density per se is low in nucleoli.
(Figure 1) shows two control cells (a) and three cells of each irradiation dose (b-d). The first column shows the cells before irradiation and the second column the overlay with the targeted areas. The control cells show a slight reduction in intensity over the whole 9 min observation period. This is due to bleaching that occurs in all imaged cells. Quantification gives a reduction in intensity due to bleaching of 20% ± 4% (standard error). First, to exclude that effects of signal decrease after irradiation are due to damaging of the dye or loss of binding sites, the signal reduction over the whole irradiated cell nuclei was quantified. If signal decrease at irradiation sites is due to these effects the decrease in mean intensity must be more than for the control cells, where only bleaching due to imaging occurs. The irradiated cells show a mean intensity decrease of 13% ± 3%, which is comparable to the reduction due to bleaching in the control cells. We conclude that visible local signal changes are due to chromatin rearrangement and not due to damaging of the dye or binding sites. Therefore, in the next step, we further investigated and quantified the local response.
The cells irradiated with a single cross pattern show a diverse response. 15 out of 16 cells show local intensity decrease, represented by cells 3 and 4 in (Figure 1b), where the cross pattern is visible throughout the whole observation period, starting in some cells already directly after irradiation (0s). One cell shows no reaction in chromatin after irradiation (Figure 1b, cell 5).
Irradiation with two crosses causes local chromatin decondensation in all irradiated cells, represented by cells 6-8 in (Figure 1c). Chromatin decondensation is already visible directly after irradiation and stays over the 9 min observation.
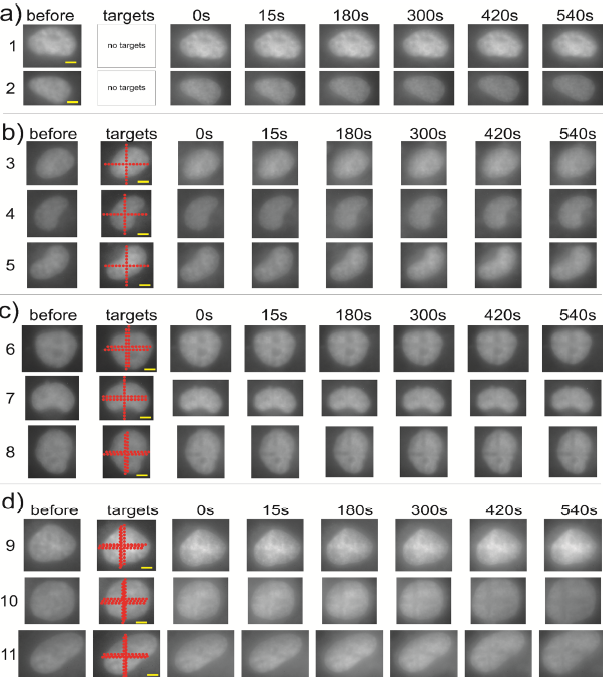
Figure 1: Microscopic images of chromatin redistribution upon radiation. Time series of cells starting before irradiation for a) non-irradiated controls, b) single cross pattern irradiation, c) two cross patterns, d) three cross patterns. In the second column, the cell image is overlaid by the irradiated cross patterns. Images after irradiation start directly after irradiation (0s) up to 540s after irradiation. Scale bar: 5 μm. All cells same scale.
The cells irradiated with three cross patterns again show quite a diverse reaction. 4 out of 6 cells show chromatin decondensation (see Figure 1d cells 10 and 11), with the same kinetics than the cells irradiated with two crosses. The other two cells show local chromatin condensation as visible in Figure 1d cell 9, where the cross becomes visible as a bright region of dense chromatin.
The reaction of chromatin rearrangement which is caused by high-LET radiation is not the same in all cells. Nevertheless, decondensation is the most common reaction and is caused independent of dose. Whereas no reaction only occurs rarely (1/31 cells) and only in the lowest dose, whereas condensation (2/31) seems to be restricted to the high dose. This diverse reaction is a further hint that not damaging of the dye or binding sites is the reason for the signal decrease at irradiation sites. Therefore, further quantification is limited to the cells showing local decondensation as this is the most common effect.
To understand the processes of decondensation the local chromatin density change represented by intensity change perpendicular to the cross axis within a region of interest was determined for t= -15 s (i.e. before irradiation) 0 s, 15 s, 180 s, 300 s, 420 s, and 540 s after irradiation. Figure 2 shows the corresponding curves for three irradiated cells (b-d) and a control cell for reference (a). The non-irradiated control shows a change in chromatin density ranging from -4.5 % to +4.7% due to rearrangements in chromatin which normally occur during the cell cycle. The cell irradiated with a single cross pattern shows a clear minimum of ~ 6% located between 2 µm and 2.5 µm in the middle of the ROI throughout the whole observation period, except for the 420 s time point where a smaller minimum of only -3.3 % is visible. The width of chromatin decondensation varies from 1.05 µm (420 s) to 1.94 µm (0 s) with a mean width of 1.63 µm ± 0.13 µm (standard error). On the right and left side of the dip chromatin condensation is visible as positive values in the relative change in intensity. The maximum varies from + 4 % (0s) to + 10% (420 s). The other 14 cells with observable local chromatin decondensation show similar behavior and are presented in Figure S1. The corresponding values are listed in the (Table S1. Figure 2c) shows the relative change in intensity for a cell irradiated with two cross patterns, whereas the behavior is quite the same as for the single cross irradiated cell. Also, a clear intensity dip is visible ranging from – 9.4 % at 0 s up to -18.2 % at 540 s. In this cell, the decondensation gets deeper with time, which could not be proven to be significant by taking all cells into account (cf. Figure S2 and Table S1). The chromatin condensation ranges from +2.8 % at 300 s to 4.6 % at 540 s. The width is 3.3 µm ± 0.2 µm.

Figure 2: Chromatin density change after irradiation. Time development of chromatin density of the ROI of a sham irradiated cell (cell 1) in a), a cell irradiated with one cross patter (cell 3) in b), a cell irradiated with two crosses (cell 6) in c) and a cell irradiated with three crosses (cell 10) in d). Local decondensation with time is represented by the local minimum in the middle of the measured distance, which gets deeper with time for the irradiated cells (b – d) whereas no tendency is visible for the control cells. Scale bar: 5 μm.
The cell irradiated with three cross patterns also shows the dip in intensity ranging from – 3.5 % (0 s) to – 14.7 % (540 s), again the time development is not significant taking the other three cells into account. The corresponding curves can be found in Figure S3 and the measured values in the Table S1. The condensation is expressed with values from + 13.3 % at 180 s to almost no condensation of + 2.8 % at 540 s. The width ranges from 1.4 µm for the first two time points to 4.4 µm at 540 s with an average of 2.6 % ± 0.6 %.
To be able to make quantitative statements the minima and maxima in the relative intensity for all cells at the six time points were determined and averaged in the three dose groups. In Figure 3 these values are visualized. The chromatin decondensation represented by intensity reduction in Figure 3a is within the error bars the same for the three groups over the whole imaging period of 540 s. However, the cells irradiated with two crosses and three crosses tend to show a slightly higher decondensation. As during the 540 s no change is visible within a single dose group the decondensation was averaged. For the lowest dose the average decondensation is 6.2 % ± 0.4 %, for the medium dose 8.0 % ± 0.6 % and for the highest dose 7.8 % ± 0.7 %. The condensation at the rim of the irradiated region (Figure 3 b) is within the errors also the same for the three dose groups and throughout the whole imaging period. The mean condensation is 5.7 % ± 0.5 % for the one cross irradiation, 6.2 % ± 0.7 % for two crosses and 8.0 % ± 0.6 % for the three crosses.
The mean width of the decondensed region is 1.1 µm ± 0.1 µm (fwhm) for the lowest dose, 1.0 µm ± 0.1 µm for the middle dose and is slightly higher for the highest dose (1.3 µm ± 0.2 µm) and does not change over time (see Figure S4).
Discussion
In the presented study we targeted cells with crosses of high-LET carbon ion irradiation with a spot size of 840 nm ± 60 nm with cross patterns with 25 spots and a spot distance of 1 µm. Cells were irradiated using one, two, or three cross patterns resulting in three different doses of 11 000 Gy, 22 000 Gy, and 33 000 Gy. We chose the local doses so high, to be able to reliably quantify the effect in our setup. In previous experiments, several hundred ions per point were needed to quantify PARP1 accumulation [9] and 1000 ions per point to visualize PCNA IRIF [17]. No direct cell death was observable throughout the imaging period. Quantification of the decrease of the mean intensity in the nucleus showed that bleaching due to imaging occurred in the control and irradiated cells. But no further decrease of mean intensity was measurable in the irradiated cells. We, therefore, conclude that local signal decrease at irradiation sites is due to chromatin rearrangement and not due to damaging of the dye or binding sites. A further concern could be that the DNA fragments induced by these high local doses dissolve in the surrounding, which could be misinterpreted as active chromatin rearrangement. With our measurements, this could not be proved wrong but strong hints point to still active basal mechanism resulting in the start of the repair. First, in previous studies at high local doses in the range of 1000 ions per point still, formation and preservation of IRIF of PCNA and PARP1 could be measured. If fast dissolving of fragments would occur this would hamper this accumulation of proteins of the damage repair family. This gives evidence that the cell at least tries to repair the damaged regions. Second, in our experiment, we could visualize a signal increase at the edges of the irradiated region, which does not dissolve during the imaging period. In our opinion, if dissolving of fragments is the reason for the decondensation, the fragments would diffuse further away from the irradiated region. This would result in a balancing of the signals between the irradiated region, the outer region, and the rest of the cell nucleus. We were not able to detect such a signal equalization. In our opinion, it is fair enough to conclude that the visible decondensation is due to the start of DNA repair and the corresponding rearrangement of DNA in densely packed regions. Nevertheless, due to the ultra-high doses fragmentation of DNA occurs. The normal DNA repair process may be hampered by this process. This has to be taken in mind when looking at the results.
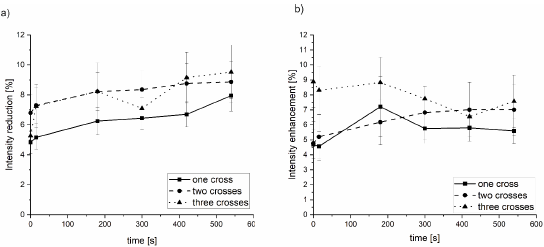
Figure 3: Mean chromatin density change. The intensity reduction in the minimum is shown in a) and the intensity enhancement in the maximum
around the minimum is shown in b).
In detail, the irradiated cells showed diverse reactions related to chromatin reorganization. The majority (91%) of cells showed local decondensation at the irradiated pattern surrounded by chromatin condensation independent of dose. Whereas 3% showed no rearrangements and 6% showed local chromatin condensation in the irradiated regions. For further quantification, we used only densely compacted DNA regions represented by high signal intensities to lower the variations. The chromatin remodeling in euchromatic regions, i.e. regions with low DNA density, is still questionable and under debate [20]. In our cells the regions with low signal intensity were underrepresented and therefore we focused on the regions with high signal intensity. The decondensation was already formed in the first 15 seconds after irradiation and although a tendency was visible for increasing decondensation, the measured values overlap in their errorbars over the imaging period of 9 min. A mean reduction in chromatin density of around 6% for the lowest dose and around 8% for the higher doses and a width of 1 µm – 1.3 µm was visible. This chromatin decondensation is surrounded by a region of chromatin condensation of 5.7% - 8%. The chromatin decondensation and condensation, although it seems to be a bit more pronounced in the higher doses is within the errors the same for the three irradiation geometries.
These results nicely fit the current view of chromatin reorganization after DNA double-strand break induction. It was possible to measure almost direct chromatin rearrangements after high-LET particle irradiation inducing hundreds of DSB in the irradiated region in living cells. Other studies also showed local decondensation using heavier ions such as gold, titanium, and uranium [21], but mainly this direct measurement was done in laser irradiation experiments inducing >100 DSB in the irradiated region [22]. Our data show radiation-induced chromatin rearrangement already several seconds after irradiation. These results are comparable to the chromatin decondensation measured after UV laser irradiation. Here already in the first 20 s after irradiation loosening of chromatin was detectable [12]. Also, irradiation with high LET heavy ions showed the first decondensation after several seconds and increasing in the first 6min after irradiation [21].
Additionally, measurements of IRIF mobility are used to conclude chromatin rearrangement [23-25]. These studies no large scale movement could be measured up to hours after irradiation for foci induced by single heavy ions [23] and also laser-induced damage sites [12]. The movement is confined in a sub µm large region around the damage. The results point to a local decondensation of chromatin after irradiation. Our data support this conclusion, as we also only find local decondensation.
The kinetic of chromatin rearrangement can be compared to DNA repair protein kinetics measured after UV and high-LET particle radiation. Recruitment of repair factors such as PARP1 and the Ku complex start directly after irradiation within the first seconds in both UV and particle irradiation [8,9,26-28]. Where PARP1 is with a half time of 1.6 s the fastest [8]. At a later stage around 10 s to 20 s after damage induction the protein phosphorylation and consequently, accumulation of these proteins starts at damage sites including gH2AX and MDC1 [8,29,30]. Other repair proteins such as 53BP1 [29,31] or RNF8 [8] exhibit slower kinetics in both particle and UV irradiation. The fast accumulation of PARP1 at damage sites induces chromatin rearrangements [32] this is one part of the whole concert of modifications in the chromatin rearrangement [33]. The first rearrangement is in the order of seconds and therefore fast [34,35] and enables the accumulation of ATM and the subsequent phosphorylation of H2AX [9,30].
Our data also show that a first chromatin rearrangement takes place already seconds after irradiation. This supports the idea of fast chromatin remodeling, which could be due to PARP1 accumulation. This is supported by data from a previous study using the same irradiation setup where PARP1 accumulation was detected at the irradiated spots within the first 10s after irradiation [9]. Although we were not able to directly measure a combination of PARP1 accumulation and DNA decondensation we think that data of both studies support the model of PARP induced chromatin decondensation and therefore support the picture of DSB detection and the start of the repair. And as the data show that although ultra-high doses were used no direct cell death occurs. Altogether this suggests that the initial basal mechanisms might be still active.
Conflict of Interest
The authors declare that the research was conducted in the absence of any commercial or financial relationships that could be construed as a potential conflict of interest.
Author Contributions
BS, JR, and GD designed the study. MS, JR, NM, and SR did beam preparation, quality assurance, and beam size measurements. BS, JR, NM, SR, and MS did cell irradiation and imaging. BS did cell cultivation. BS and JR did the analysis and writing of the article. MS, NM, SR, and GD did the proofreading.
Funding
This research was funded by the DFG cluster of excellence: Munich advanced photonics and European transnational access program RADIATE.
Acknowledgments
We acknowledge Sebastian Rogoll for etching and imaging of nuclear track detectors for beam size measurement.
References
2. Jakob B, Splinter J, Taucher-Scholz G. Positional stability of damaged chromatin domains along radiation tracks in mammalian cells. Radiat Res. 2009;171(4):405-18.
3. Klosin A, Hyman AA. Molecular biology: A liquid reservoir for silent chromatin. Nature. 2017;547(7662):168-70.
4. Kruithof M, Chien F-T, Routh A, Logie C, Rhodes D, van Noort J. Single-molecule force spectroscopy reveals a highly compliant helical folding for the 30-nm chromatin fiber. Nat Struct Mol Biol. 2009;16(5):534-40.
5. Verma RS, editor. Heterochromatin: Molecular and structural aspects. Cambridge: Cambridge Univ. Pr;1988.
6. Peng JC, Karpen GH. H3K9 methylation and RNA interference regulate nucleolar organization and repeated DNA stability. Nat Cell Biol. 2007;9(1):25-35.
7. Hoeijmakers JH. Genome maintenance mechanisms for preventing cancer. Nature. 2001;411(6835):366-74.
8. Liu C, Vyas A, Kassab MA, Singh AK, Yu X. The role of poly ADP-ribosylation in the first wave of DNA damage response. Nucleic Acids Res. 2017;45(14):8129-41.
9. Buchfellner A, Yurlova L, Nüske S, Scholz AM, Bogner J, Ruf B, et al. A New Nanobody-Based Biosensor to Study Endogenous PARP1 In Vitro and in Live Human Cells. PLoS ONE. 2016;11(3):e0151041.
10. Lebeaupin T, Smith R, Huet S, Timinszky G. Poly(ADP-Ribose)-Dependent Chromatin Remodeling in DNA Repair. Methods Mol Biol. 2017;1608:165-83.
11. Altmeyer M, Neelsen KJ, Teloni F, Pozdnyakova I, Pellegrino S, Grøfte M, et al. Liquid demixing of intrinsically disordered proteins is seeded by poly(ADP-ribose). Nat Commun. 2015;6:8088.
12. Kruhlak MJ, Celeste A, Dellaire G, Fernandez-Capetillo O, Müller WG, McNally JG, et al. Changes in chromatin structure and mobility in living cells at sites of DNA double-strand breaks. J Cell Biol. 2006;172(6):823-34.
13. Strickfaden H, McDonald D, Kruhlak MJ, Haince J-F, Th'ng JPH, Rouleau M, et al. Poly(ADP-ribosyl)ation-dependent Transient Chromatin Decondensation and Histone Displacement following Laser Microirradiation. J Biol Chem. 2016;291(4):1789-802.
14. Burma S, Chen BP, Murphy M, Kurimasa A, Chen DJ. ATM phosphorylates histone H2AX in response to DNA double-strand breaks. J Biol Chem. 2001;276(45):42462-7.
15. Chapman JR, Jackson SP. Phospho-dependent interactions between NBS1 and MDC1 mediate chromatin retention of the MRN complex at sites of DNA damage. EMBO Rep. 2008;9(8):795-801.
16. Stucki M, Clapperton JA, Mohammad D, Yaffe MB, Smerdon SJ, Jackson SP. MDC1 directly binds phosphorylated histone H2AX to regulate cellular responses to DNA double-strand breaks. Cell. 2005;123(7):1213-26.
17. Drexler GA, Siebenwirth C, Drexler SE, Girst S, Greubel C, Dollinger G. et al. Live cell imaging at the Munich ion microbeam SNAKE - a status report. Radiat Oncol. 2015;10(1):1-8.
18. Hable V, Greubel C, Bergmaier A, Reichart P, Hauptner A, Krücken R et al. The live cell irradiation and observation setup at SNAKE. Nuclear Instruments and Methods in Physics Research Section B: Beam Interactions with Materials and Atoms. 2009;267(12):2090-7.
19. Lukinavičius G, Blaukopf C, Pershagen E, Schena A, Reymond L, Derivery E, et al. SiR-Hoechst is a far-red DNA stain for live-cell nanoscopy. Nat Commun. 2015;6:8497.
20. Tonnemacher S, Eltsov M, Jakob B. Correlative Light and Electron Microscopy (CLEM) Analysis of Nuclear Reorganization Induced by Clustered DNA Damage Upon Charged Particle Irradiation. Int J Mol Sci. 2020;21(6).
21. Müller I, Merk B, Voss K-O, Averbeck N, Jakob B, Durante M, et al. Species conserved DNA damage response at the inactive human X chromosome. Mutat Res. 2013;756(1-2):30-6.
22. Falk M, Lukasova E, Kozubek S. Higher-order chromatin structure in DSB induction, repair and misrepair. Mutat Res. 2010;704(1-3):88-100.
23. Jakob B, Splinter J, Durante M, Taucher-Scholz G. Live cell microscopy analysis of radiation-induced DNA double-strand break motion. Proc Natl Acad Sci U S A. 2009;106(9):3172-7.
24. Becker A, Durante M, Taucher-Scholz G, Jakob B. ATM alters the otherwise robust chromatin mobility at sites of DNA double-strand breaks (DSBs) in human cells. PLoS ONE. 2014;9(3):e92640.
25. Jakob B, Splinter J, Conrad S, Voss K-O, Zink D, Durante M, et al. DNA double-strand breaks in heterochromatin elicit fast repair protein recruitment, histone H2AX phosphorylation and relocation to euchromatin. Nucleic Acids Res. 2011;39(15):6489-99.
26. Lorat Y, Schanz S, Schuler N, Wennemuth G, Rübe C, Rübe CE. Beyond repair foci: DNA double-strand break repair in euchromatic and heterochromatic compartments analyzed by transmission electron microscopy. PLoS ONE. 2012;7(5):e38165.
27. Mari P-O, Florea BI, Persengiev SP, Verkaik NS, Brüggenwirth HT, Modesti M, et al. Dynamic assembly of end-joining complexes requires interaction between Ku70/80 and XRCC4. Proc Natl Acad Sci U S A. 2006;103(49):18597-602.
28. Reynolds P, Anderson JA, Harper JV, Hill MA, Botchway SW, Parker AW, et al. The dynamics of Ku70/80 and DNA-PKcs at DSBs induced by ionizing radiation is dependent on the complexity of damage. Nucleic Acids Res. 2012;40(21):10821-31.
29. Hable V, Drexler GA, Brüning T, Burgdorf C, Greubel C, Derer A, et al. Recruitment kinetics of DNA repair proteins Mdc1 and Rad52 but not 53BP1 depend on damage complexity. PLoS ONE. 2012;7(7):e41943.
30. Costes SV, Chiolo I, Pluth JM, Barcellos-Hoff MH, Jakob B. Spatiotemporal characterization of ionizing radiation induced DNA damage foci and their relation to chromatin organization. Mutat Res. 2010;704(1-3):78-87.
31. Timm S, Lorat Y, Jakob B, Taucher-Scholz G, Rübe CE. Clustered DNA damage concentrated in particle trajectories causes persistent large-scale rearrangements in chromatin architecture. Radiother Oncol. 2018;129(3):600-10.
32. Gyula Timinszky, Susanne Till, Paul O Hassa, Michael Hothorn, Georg Kustatscher, Bianca Nijmeijer et al. A macrodomain-containing histone rearranges chromatin upon sensing PARP1 activation. Nat Struct Mol Biol 2009; 16(9):923–9. Available from: URL: https://www.nature.com/articles/nsmb.1664?proof=trueMay.
33. Price BD, D'Andrea AD. Chromatin remodeling at DNA double-strand breaks. Cell 2013; 152(6):1344–54.
34. Dragana Ahel, Zuzana Hořejší, Nicola Wiechens, Sophie E. Polo, Elisa Garcia-Wilson, Ivan Ahel et al. Poly(ADP-ribose)–Dependent Regulation of DNA Repair by the Chromatin Remodeling Enzyme ALC1. Science 2009; 325(5945):1240–3. Available from: URL: https://science.sciencemag.org/content/325/5945/1240/tab-pdf.
35. Sellou H, Lebeaupin T, Chapuis C, Smith R, Hegele A, Singh HR et al. The poly(ADP-ribose)-dependent chromatin remodeler Alc1 induces local chromatin relaxation upon DNA damage. Mol Biol Cell 2016; 27(24):3791–9.