Abstract
Objective: Need to control the COVID-19 pandemic resurgence is a priority in India which has an estimated population of 1.39199 billion. Immunity whether acquired by recovery or vaccine, controls an infectious disease epidemic. In case of COIVD-19, the latter is more desirable. The objective of this study is to answer a research question “What is the impact of current vaccination drive in adults in generating vaccine-induced immunity in India?”
Methods: A Markov-based decision analysis model was used with daily cycles for a period of one year. Primary aim was to determine the extent to which vaccine-induced immunity is generated at one year. Parameter uncertainty was handled by random sampling of model inputs from their respective distributions during Monte Carlo simulation (5000 cycles). The model inputs were relevant to India as of August 8, 2021 and were varied to cover both worst-case and best-case scenarios to avoid bias.
Results: Median and 95% uncertainty interval for vaccine-induced immunity was 43.17 (26.14 to 59.97) when expressed as % of total population. It contributed predominantly to the total immune pool (natural and vaccine-induced) which was 82.49 (34.89 to 92.84). Relative contribution (%) of vaccine-induced immunity to the total immune pool was 59.66 (35.43 to 93.66). The wide uncertainty intervals are a consequence of inconsistency of parameters which is typical to dynamics of COVID-19 pandemic.
Conclusions: Answer to the research question is that the planned vaccination schedule is encouraging. Population immunity acquired predominantly by vaccination is desirable. Efforts need to be focused on further increasing the vaccination rate and on handling the vaccine hesitancy to augment the desired yield. Reducing cases is not only beneficial for decreasing the pressure on healthcare systems, but also enhances resistance against variants of concern including the delta variant.
Keywords
COVID-19, Pandemic, India, Vaccination, Decision tree, SEIR model, Markov model, Vaccine-induced immunity, Infectious diseases, Covaxin, Covishield
Research Article
India with an estimated population of 1.39199 billion has suffered two waves of COVID-19 pandemic. Need to control the pandemic resurgence is a priority [1]. After completing vaccination mostly in high-risk groups, the government of India has taken up the mammoth task of mass vaccination drive with central procurement and distribution of vaccines to different states free of cost. The approach plans to cover adult population (>18 y, about 67.53%) with either Covaxin or Covishield. Each type requires 2 doses administered a few weeks apart. The current daily rate of 6.6 million vaccinations may be accelerated further to cover the entire adult population by the end of the year. Recovery from COVID-19 can confer protection related to spike-specific memory B cells [2,3]. However, vaccine-induced immunity provides a key to “Path to Normality” [4]. It protects people who are not yet vaccinated and reduces the burden on health care systems [5]. It also boosts immunity when adminstered in the recovered [6]. Inclusion of children in the vaccination is complicated by several logistic and ethical issues [7]. Hence, a research question could be “What is the impact of current vaccination drive in adults in generating vaccine-induced immunity in India?”
Methods
Markov-based decision tree (Figure S1 in Supplement Online Content).
A Markov-based SEIR (susceptible, exposed, infected and recovered) decision analysis model along with vaccination related states was used with daily cycles for a period of one year. In addition to 4 standard Markov states (Figure S1-A), the model required additional similar states to capture post-vaccination events (Figure S1-B). Both susceptible and recovered individuals were modelled to get the vaccine. The model was designed such that vaccinated individuals would not be vaccinated again after a two-dose regimen of the vaccine. Another independent state “Vaccine Failure and Natural immunity” was added to capture individuals who get infected and recover after vaccination. Hence, there were 11 states, including the two related to COVID-19 mortality and general non-COVID-19 mortality.
Parametrization and calculation of chance node probabilities (Supplemental Appendix and Table 1)
We parametrized the number of individuals in infected, recovered and vaccinated states with case data relevant to India as on August 8, 2021. The data were as available from the government of India website [8] related sources and official releases. The documented cases available at the Government website are those who tested positive either by RT-PCR or rapid antigen test. There are no separate population data for asymptomatic cases. But undocumented cases with a proportion of asymptomatic ones pose a problem [9,10]. Hence, a factor was used to add undocumented cases to the documented ones and also to serve as a proxy to account for asymptomatic cases as well. It is known that asymptomatic cases are important in disease transmission [11,12]. For annual general non-COVID-19 mortality related to India, 2019 data were obtained from the world bank website [13]. At the nodes that require computation of probability, care was taken to use the “rate-to-probability” function. When converting annual rate, the argument of 1/365 was used in the function and the argument was retained as 1 when daily rates were applicable. Use of the mathematical function is important as rates having a notion of time can go beyond 1 while probability can only range between 0 and 1 [14]. The probabilities for infection, progression and recovery were computed by applying standard formulas [15]. The infection transmission was computed in terms of R0 which is related as R0/duration of infectiousness. Higher values of R0 reflect higher degree of transmission related to emergence of more virulent strains and lesser degree of usage of mitigation measures. Modeling with varying R0 values can potentially capture such effects. The annual rates were applicable to COVID-19 mortality and non- COVID general mortality. Daily rates were applicable to transmission, progression, and recovery. Vaccine administration was also influenced by daily rates.
Calculation of vaccine related variables
Vaccination administration rates: Calculation of average daily vaccination rates: The current vaccination program includes either Covaxin or Covishield, each of which requires 2 doses administered a few weeks apart. If 6.6 million vaccinations take place on single day, then the rate will be 3.3/940 = 0.00351 (940 million constitute adult population). In the model, the rate was varied by uniform distribution between 0.002 (3.76M) and 0.006 (11.28M). This is to account for possible variations due to supply, delivery and other logistic issues.
Vaccine efficacy: Although the vaccines can have different efficacies with regard to generation of neutralizing antibodies, they were treated as a single entity. Both Covishield and Covaxin are effective in preventing infections, decreasing COVID-19 related mortality and increasing antibody levels to generate vaccine-induced immunity in the population. Both of them generate neutralizing antibodies against emerging delta variants as well. https://www.medrxiv.org/content/10.1101/2021.07.13.21260417v1
In this model, both were modelled as one entity with an efficacy of two-dose regimen varying by uniform distribution between 0.5 and 0.95 during simulations as recommended [16]. Also, the range covers 70% efficacy which is good enough for population immunity [4,15]. Lower value for efficacy accounts for emerging variants that could escape vaccine protection.
Vaccination acceptance: Vaccine hesitancy is a global phenomenon [17]. In India, it a serious issue in rural areas. The government of India has already initiated several counselling programs with personnel working even at grass roots level. In the present model, vaccine acceptance was varied with uniform distribution between 0.6 and 0.9 as relevant to India (Table 1).
|
Variable |
Parametera/ Indian data
|
Distribution |
Distribution parameters as applicable used in this modelb |
Reference |
|
Ro |
|
Uniform |
0.75 and 4 |
See text |
|
Latent period (days) |
5 |
Lognormal |
1.63 and 0.5 |
[11] |
|
Period of infectiousness (days) |
10 |
Gamma |
7.214 and 0.8 |
[11] |
|
Factor for undocumented cases |
3 |
Uniform |
2-4 |
See text
|
|
Average daily vaccinations (millions) c |
6.6 |
Uniform |
3.76 and 11.28 |
See text |
|
Vaccine acceptance (%) d |
0.75 |
Uniform |
0.6 to 0.9 |
|
|
Vaccine efficacy |
0.7 |
Uniform |
0.5 to 0.95 |
15 See text |
|
COVID-19 specific mortality (%) |
1.34 |
|
1 to 3 |
[8] |
|
Current estimated Population of India (billion) |
1.39199 |
Fixed value |
|
|
|
Adult population (%) of total population |
67.53 |
Fixed value |
|
|
|
Active cases (millions) |
0.4022 |
Fixed value |
|
[8] |
|
Infected and recovered (% of population) |
2.337 |
Fixed value |
|
[8] |
|
Fully vaccinated (% of population) e |
11 |
|
|
[8] |
|
General non-COVID-19 mortality in 2019 (annual rate) |
0.007265 |
Fixed value |
|
[13] See text |
https://indianexpress.com/article/opinion/india-has-a-vaccine-hesitancy-challenge-7388907/
|
||||
Model outputs and scenario analysis
It is known that baseline estimates are not consistent [4]. To account for parameter uncertainty random sampling of model inputs from their respective distributions (Table 1) was done during simulation with 5000 cycles of Monte Carlo Simulation. The model inputs were varied to cover both worst-case and best-case scenarios to avoid bias [15]. Primary aim was to determine the extent to which vaccine-induced immunity is generated at one year. In addition, the model was also designed to generate other relevant estimated outputs for total vaccinations, natural immunity, combined natural and vaccine-induced immunity, COVID-19 cases and COVID-19 deaths, to be expressed as percentage of the population. The simulation results in probabilistic estimates of model outputs. To illustrate the theme of this study, scenario analysis and deterministic two-way sensitivity analysis was done to present the results graphically. TreeAge Pro (Health Care Version,2021) facilitated the analysis.
Results
Probabilistic sensitivity analysis of model outputs is presented as % of Indian Population in Table 2. Point estimate and 95% uncertainty interval for relative contribution (%) of vaccine-induced immunity to the total immune pool was 59.66 (35.43 to 93.66). Figure 1 depicts scenario analysis related to vaccination drive with graphical trends of selected Markov states: with “low vaccination drive” (Panel A), “current vaccination drive” (Panel B), and “high vaccination drive” (Panel C). It is evident that more intense drive than the current one will result in predominant contribution of vaccine immunity to the total immune pool. Figure 2 depicts a two-way deterministic sensitivity analysis with combinations of vaccination rates and acceptance percentages on trends: vaccine-induced immunity in the population, Again, more intense vaccination drive will augment the yield of the desired immunity.
|
Variable |
Median (95% Uncertainty interval) |
|
Vaccinations |
52.93 (35.32 to 67.28) |
|
Natural immunity |
32.91 (3.19 to 56.88) |
|
Vaccine immunity b |
43.24 (26.72 to 59.64) |
|
Immunity by recovery or vaccine |
80.77 (35.24 to 91.71) |
|
COVID-19 cases |
50.04 (0.35 to 73.15) |
|
COVID-19 deaths |
0.018787 (0.000151 to 0.061189) |
|
All values (% of Indian Population, 1.39199 billion or 139.199 crores)
|
|

Figure 1: Scenario analysis related to the vaccination drive with graphical trends of selected Markov states: “low vaccination drive” (Panel A), the current scenario (Panel B), and “high vaccination drive” (Panel C). As evident in the Panel C, there is a predominant contribution of vaccine-induced immunity to the total immune pool with an improved drive which is desirable. In these scenarios, R0 (R-naught) of 2.5 and vaccine efficacy of 0.7 were assumed to illustrate the study theme. However, it is emphasized that the primary model outputs (Table 2) are probabilistic with no preference for a particular value for input variables.
Discussion
India, having 28 states and 8 union territories has an estimated population of 1.39199 billion. The country is socio-culturally diversified with different states having festivals unique to them and occur periodically throughout the year. Festivals are usually celebrated in public with mass assemblies or close-door gatherings which breach pandemic mitigation measures [18]. “Health” is a state subject which means that respective state governments are responsible from administrative standpoint [19]. The country has suffered a second wave of the pandemic in 2021 between mid-March and mid-June with state governments imposing different forms of lockdown measures to mitigate the problem. With the states now relaxing the lockdown restrictions, there is a potential risk of resurgence. India has started its vaccination program in January 2021, initially targeting high-risk groups followed by vaccination of all people above 18 years.
Infectious disease models use SEIR (susceptible, exposed, infected and recovered) algorithm in which increased immune pool decreases the susceptible population and flattens the epidemic curve [20]. The SEIR models are best suited for evaluating COVID-19 control strategies [21]. This study provides a framework for SEIR model to evaluate the value of vaccination strategy implemented during the course of the pandemic. Traditionally, herd immunity (herd protection) threshold is the proportion of a population that needs to be immune in order for an infectious disease to become stable in that community. It includes that acquired by recovery or vaccination and is given by the formula, 1 – 1/R0, (where R0 is R-naught), which is a ratio between transmission rate and recovery rate [22]. The concept of herd-immunity threshold is waning with COVID-19 although most estimates placed it at 60-70%.[4] However, vaccine-induced immunity is desirable as it protects people who are not yet vaccinated and reduces the burden on health care systems [5]. It also boosts immunity when adminstered in the recovered even one year after the infection [6]. Factors such as vaccine hesitancy, emergence of new variants and the delayed approval of vaccinations for children are increasingly reported for COVID-19. In particular, emerging delta variant in India is of concern and aggressive vaccination is required to tackle it [23]
Hence, this study attempted to answer the research question as relevant to India by dynamic Markov cohort decision tree. The answer to the question represents “theme of the study”, i.e., the extent to which vaccine-induced immunity is generated and its contribution to the total immune pool. The parameter uncertainty was handled with random sampling of model inputs from their respective distributions during Monte Carlo simulation. Thus, the model outputs (Table 1) were probabilistic estimates. Definitive meta-analytic data for distributions were available for latent period and duration of infectiousness as described by lognormal and gamma respectively [11]. For other applicable variables, we preferred a uniform distribution with ranges to span worst-case and best-case scenarios [24] to avoid bias towards central tendency value during simulation,
The design features of the decision tree used in this study are important. Care was taken to ensure independence of the states; accordingly, at a given time, a person in the cohort could only be in one state. It was also ensured that vaccinated persons would not be vaccinated again after two-dose regimen of a vaccine. When recovered people got vaccinated, they were included in the vaccine immune category while eliminating them from natural immunity category to avoid double counting. Vaccinated individuals who got infected and then recovered, were moved to another independent state “Vaccine Failure and Natural immunity”. Variants with higher transmissibility, virulence or resistance to vaccines could emerge. To have some control on such variability and other factors that drive the model, this study used Monte Carlo simulation which is more robust than models that use baseline data for primary model outputs. In particular, modeling by varying with higher values for R0 can capture such effects of virulence. A meta-analysis study found pooled estimate of R0 during active pandemic as 3.32 (95% confidence interval, 2.81 to 3.82) [25]. A mathematical model applicable to Indian scenario during first wave of pandemic in the year 2020 used a range between 1.5 and 4 [26]. It is also important to cover a R0 value during a dormant phase. Anecdotal reports indicate current R0 in India as 0.78. Therefore, use of range for R0 between 0.75 and 4 in the current model is justified. As relevant to India, the higher values of R0 can account for inevitable breach in other standard mitigation measures related to periodic ease of lockdown restrictions, festivals, political rallies etc [18,19]. This study modelled to simulate vaccination administered to both susceptible and recovered individuals. Our method is clearly distinct from a model that evaluated vaccination as a “snap shot” strategy given on a single day in only susceptible individuals [15]. Modeling with lower values of vaccine efficacy can account for potential vaccine resistance with emerging variants.
The results are encouraging with regard to the “study theme” (Table 2), despite confining the vaccination program to adults and hampering effects of vaccine hesitancy and efficacy. Median and 95% uncertainty interval for vaccine-induced immunity was 43.17 (26.14 to 59.97) when expressed as percentage of total population. It contributed predominantly to the total immune pool (natural and vaccine-induced) which was 82.49 (34.89 to 92.84). Relative contribution (%) of vaccine-induced immunity to the total immune pool was 59.66 (35.43 to 93.66). Further enhancement of the drive can have a more predominant contribution of vaccine immunity to the total immune pool, which is desirable (Figures 1 and 2). The wide 95% uncertainty intervals of model outputs are a consequence of inconsistency of parameters which is typical to dynamics of COVID-19 pandemic [4,24].
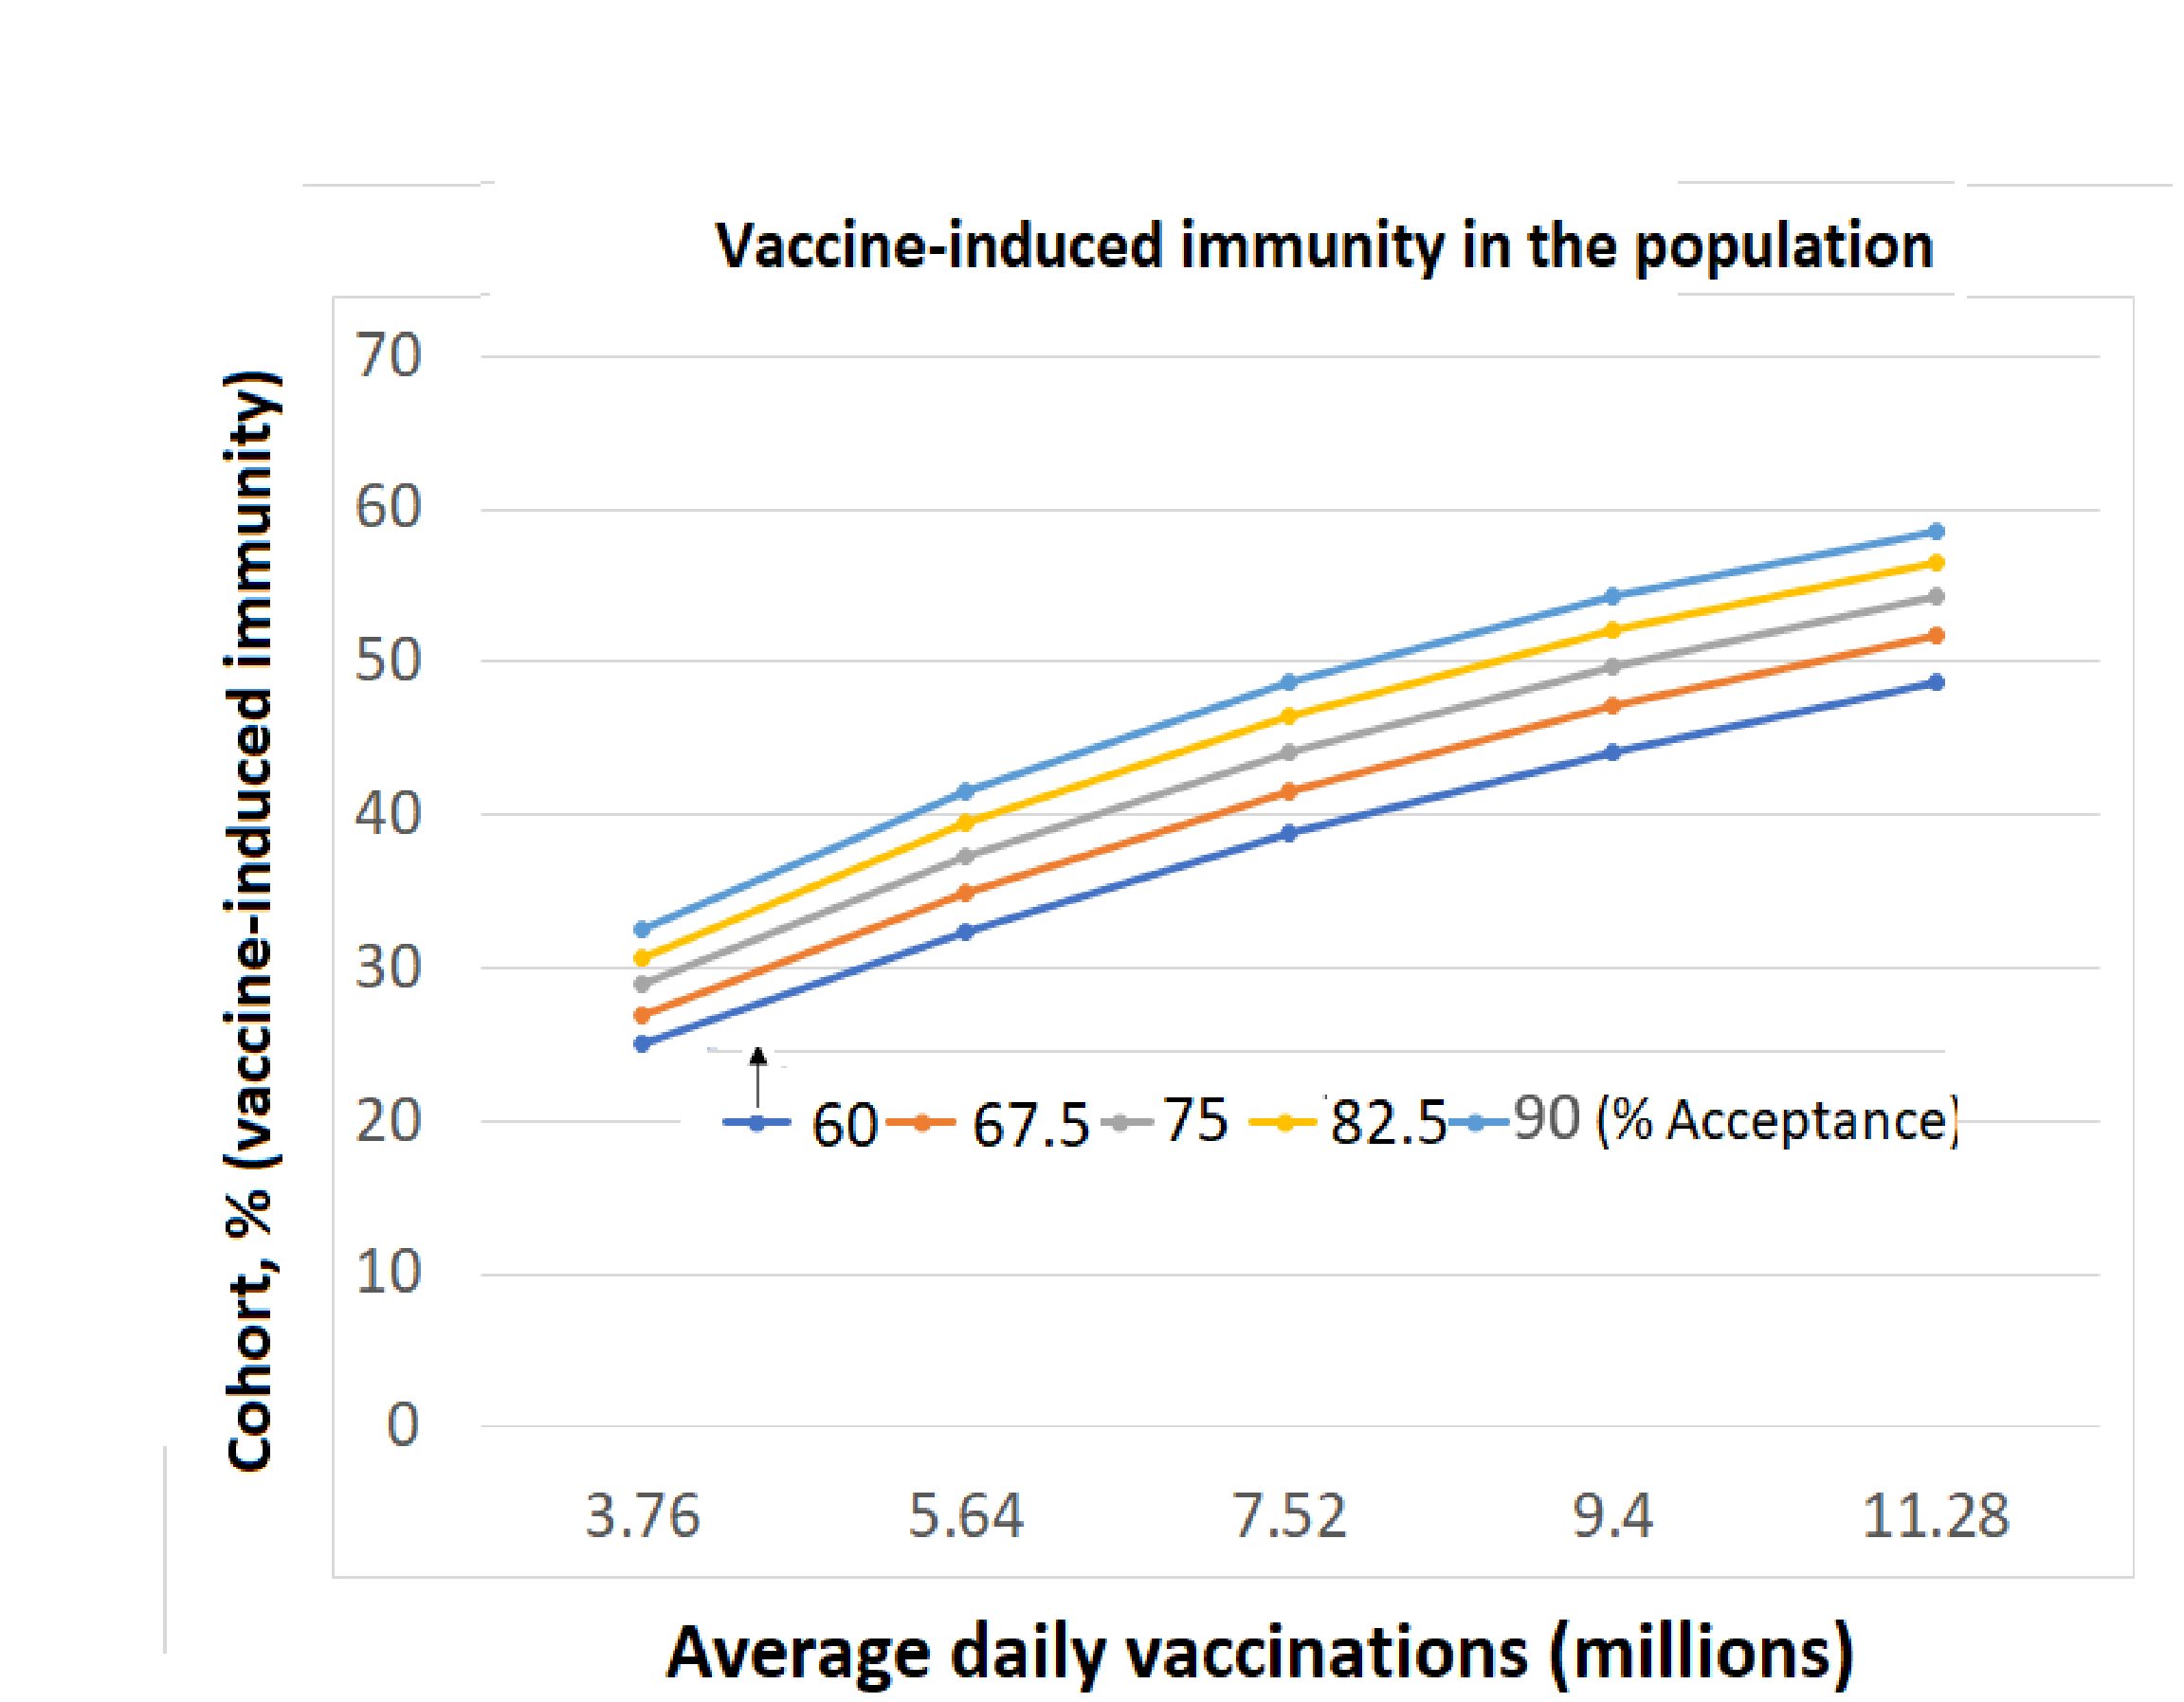
Figure 2: Two-way sensitivity analysis with combinations of vaccine administration rates and acceptance percentages on expected immunity levels in the population: vaccine-induced immunity, Simultaneous efforts towards higher vaccination rates and improved acceptance will result in higher yield of vaccine-induced immunity and its contribution to the total pool. Again, R0 (R-naught) of 2.5 and vaccine efficacy of 0.7 were assumed and it is emphasized that primary model outputs (Table 2) are probabilistic.
Publicly reported COVID-19 cases may underrepresent actual ones in India [27]. Although we used a factor to account for undocumented cases, the issue can be a potential limitation in this model. Although there are two vaccines in the current drive, they were evaluated with two-dose regimen of either of them as single entity which is a limitation of this study. Complexity of COVID-19 pandemic precludes any type of external validation to evaluate the vaccine intervention as a control measure at population level. Hence this study verified model outputs for expected trends. With a given iteration during simulation (scenario) with variables having values as determined by their distributions, total immune cases should be the sum of cases with natural immunity and vaccine-induced immunity. Raw output of simulation was cross-checked for this requirement to validate independence of the Markov states in the model. Obviously, being probabilistic estimates, median values for natural immunity and vaccine immunity will not exactly sum up to total immune pool as observed in Table 2.
The design and presentation of results are consistent with standard recommendations and practices for modeling studies. The range, 0.5 to 0.9, used for vaccine efficacy was as recommended [16] and covers the value 0.7 which is good enough for epidemiological perspective [4,15]. In addition to probabilistic sensitivity analysis, it is also important to perform scenario analysis [24] and deterministic sensitivity analysis [28]. Figure 1 attempts to show the trends in percentage population in susceptible, infected, recovered and vaccine-induced immunity components while covering worst-case and best-case scenarios related to vaccination drives. In the present study, deterministic two-way sensitivity analysis was presented to simultaneously evaluate the impact of vaccine administration rates and acceptance percentages on expected immunity levels in the population (Figure 2). Care was taken to use the term “uncertainty interval” instead of confidence interval as parameter uncertainty was handled using Monte Carlo simulation (Table 2) [28].
All models are simplifications of real life and cannot account for every scenario. Hence, they seek to provide a “big picture” to help public health authorities identify thrust areas to focus. Of the key variables related to vaccine, i.e. efficacy, rate of administration, and hesitancy, the latter two are modifiable determining factors. Answer to the research question is that the planned vaccination schedule is encouraging (Table 2 and Figures 1 and 2). The population immunity acquired predominantly by vaccination is desirable. Efforts need to be focused to further increase the vaccination rate and on handling the vaccine hesitancy to augment the desired yield. Reducing cases is not only beneficial for decreasing the pressure on healthcare systems, but also enhances resistance against variants of concern including the delta variant [6]. Case reduction by vaccination also lowers the vaccine escape risk [29].
Funding
Self-funded by the first author for procuring the TreeAge software and getting technical support.
Conflicts of Interest
The authors declare no conflicts of interest.
Authors’ Contribution
Srinivas Mantha, MD: This author conceived the research idea, collected the data and performed the analysis. He wrote the initial draft of the manuscript.
Sudha Lakshmi Tripuraneni, MD: This author helped to provide useful data inputs and revised the manuscript.
Venkat Ramana Rao Mantha, FFARCSI: This author helped in providing useful inputs to revise the manuscript.
Data Sharing
Datasets generated and analyzed along with other details of the study are available from the corresponding author upon reasonable request.
References
2. Dan JM, Mateus J, Kato Y, Hastie KM, Yu ED, Faliti CE, et al. Immunological memory to SARS-CoV-2 assessed for up to 8 months after infection. Science. 2021 Feb 5;371(6529).
3. Turner JS, Kim W, Kalaidina E, Goss CW, Rauseo AM, Schmitz AJ, et al. SARS-CoV-2 infection induces long-lived bone marrow plasma cells in humans. Nature. 2021 May 24:1-5.
4. Aschwanden C. Five reasons why COVID herd immunity is probably impossible. Nature. 2021:520-2.
5. Persad G, Emanuel EJ. Ethical Considerations of Offering Benefits to COVID-19 Vaccine Recipients. JAMA. 2021 Jul 20;326(3):221-2.
6. Wang Z, Muecksch F, Schaefer-Babajew D, Finkin S, Viant C, Gaebler C, et al. Naturally enhanced neutralizing breadth against SARS-CoV-2 one year after infection. Nature. 2021 Jul;595(7867):426-31.
7. Diseases TL. Should we vaccinate children against SARS-CoV-2? The Lancet. Infectious Diseases. 2021 Jun 10;21(7):889.
8. The Government of India: India Fights Corona COVID-19 2020; https://www.mygov.in/covid-19. Accessed July 17, 2021, 2021.
9. Kumar N, Hameed SK, Babu GR, Venkataswamy MM, Dinesh P, Bg PK, et al. Descriptive epidemiology of SARS-CoV-2 infection in Karnataka state, South India: Transmission dynamics of symptomatic vs. asymptomatic infections. EClinicalMedicine. 2021 Feb 1;32:100717.
10. Laxminarayan R, Vinay TG, Kumar KA, Wahl B, Lewnard JA. SARS-CoV-2 infection and mortality during the first epidemic wave in Madurai, south India: a prospective, active surveillance study. The Lancet Infectious Diseases. 2021 Aug 13.
11. Johansson MA, Quandelacy TM, Kada S, Prasad PV, Steele M, Brooks JT, et al. SARS-CoV-2 transmission from people without COVID-19 symptoms. JAMA Network Open. 2021 Jan 4;4(1):e2035057.
12. Oran DP, Topol EJ. Prevalence of asymptomatic SARS-CoV-2 infection: a narrative review. Annals of Internal Medicine. 2020 Sep 1;173(5):362-7.
13. The World Bank: Death rate, crude (per 1,000 people) - India. 2020; https://data.worldbank.org/indicator/SP.DYN.CDRT.IN?locations=IN. Accessed July 1, 2021, 2021.
14. Mantha S. Ratio, rate, or risk?. The Lancet Infectious Diseases. 2021 Feb 1;21(2):165-6.
15. Bartsch SM, O'Shea KJ, Ferguson MC, Bottazzi ME, Wedlock PT, Strych U, et al. Vaccine efficacy needed for a COVID-19 coronavirus vaccine to prevent or stop an epidemic as the sole intervention. American Journal of Preventive Medicine. 2020 Oct 1;59(4):493-503.
16. Patel MK, Bergeri I, Bresee JS, Cowling BJ, Crowcroft NS, Fahmy K, et al. Evaluation of post-introduction COVID-19 Vaccine Effectiveness: Summary of interim guidance of the World Health Organization. Vaccine. 2021 Jun 1;39(30):4013-4024.
17. Lazarus JV, Ratzan SC, Palayew A, Gostin LO, Larson HJ, Rabin K, et al. A global survey of potential acceptance of a COVID-19 vaccine. Nature Medicine. 2021 Feb;27(2):225-8.
18. Samarasekera U. India grapples with second wave of COVID-19. The Lancet Microbe. 2021 Jun 1;2(6):e238.
19. Kar SK, Ransing R, Arafat SMY, Menon V. Second wave of COVID-19 pandemic in India: Barriers to effective governmental response. EClinicalMedicine. 2021 Jun;36:100915.
20. Ridenhour B, Kowalik JM, Shay DK. Unraveling r 0: Considerations for public health applications. American Journal of Public Health. 2018 Dec;108(S6):S445-54.
21. Rǎdulescu A, Williams C, Cavanagh K. Management strategies in a SEIR-type model of COVID 19 community spread. Scientific Reports. 2020 Dec 4;10(1):1-6.
22. Mantha S. Basic reproduction number, effective reproduction number and herd Immunity: Relevance to opening up of economies hampered by COVID-19. Journal of Allergy and Infectious Diseases. 2020;1(2):32-4..
23. Novelli G, Colona VL, Pandolfi PP. A focus on the spread of the delta variant of SARS-CoV-2 in India. The Indian Journal of Medical Research. 2021 Jul 14..
24. CDC. COVID-19 Pandemic Planning Scenarios. Last updated March 19, 2021. 2020; Published May 20, 2020:https://www.cdc.gov/coronavirus/2019-ncov/hcp/planning-scenarios.html. Accessed June 13, 2021, 2021.
25. Alimohamadi Y, Taghdir M, Sepandi M. Estimate of the basic reproduction number for COVID-19: a systematic review and meta-analysis. Journal of Preventive Medicine and Public Health. 2020 May;53(3):151.
26. Mandal S, Bhatnagar T, Arinaminpathy N, Agarwal A, Chowdhury A, Murhekar M, et al. Prudent public health intervention strategies to control the coronavirus disease 2019 transmission in India: A mathematical model-based approach. The Indian Journal of Medical Research. 2020 Feb;151(2-3):190.
27. Li Y, Nair H. How reliable are COVID-19 burden estimates for India?. The Lancet Infectious Diseases. 2021 Aug 13.
28. Sandmann FG, Davies NG, Vassall A, Edmunds WJ, Jit M. Centre for the Mathematical Modelling of Infectious Diseases COVID-19 working group, The potential health and economic value of SARS-CoV-2 vaccination alongside physical distancing in the UK: a transmission model-based future scenario analysis and economic evaluation. Lancet Infectious Diseases. 2021:00079-7..
29. Thompson RN, Hill EM, Gog JR. SARS-CoV-2 incidence and vaccine escape. The Lancet Infectious Diseases. 2021 Jul;21(7):913-914.