Abstract
Despite the decrease in COVID-19 testing and reporting new infections, the numbers of new cases and deaths per capita registered in some European countries and USA in September 2024 were higher than endemic limits and exceeded seasonal flu mortality. These facts make the development of new vaccines or the further use of existing ones very urgent. The averaged daily numbers of cases DCC and death DDC per million, case fatality risks CFR=DDC/DCC in 2020-2024 calculated for 34 countries and regions were used to investigate the trends versus vaccination levels. These trends together with the published before results of statistical analysis show that existing vaccines cannot reduce the number of new COVID-19 cases and deaths, i.e. vaccinations reduced severity but not transmission. Therefore, it is still necessary to avoid close contacts and crowded places, trace and isolate infected people, wear masks in transport and medical facilities, wash hands more often, etc. Nevertheless, vaccinations and boosters can be recommended in order to reduce the severity of SARS-CoV-2 disease and probability of dying for infected individuals (CFR). Recent epidemic waves can probably be controlled with the use of the immediate and sufficient increase of the number of tests.
Keywords
COVID-19 pandemic dynamics, Vaccinations, Daily numbers of cases and deaths per capita, Case fatality risk, Statistical methods
Introduction
The gradual loss of interest in SARS-CoV-2 infection (already in August 2023 61% of countries have stopped reporting new cases to WHO,[1]) does not negate the need for further research into the disease, in particular, important questions have to be answered:
- Is SARS-CoV-2 infection still a significant public health threat?
- How effective were the strategies employed to combat the pandemic?
- Should vaccination campaigns against SARS-CoV-2 continue?
Due to further reductions in testing (almost all countries have stopped updating corresponding information already in 2022, [2]), the analysis of disease risks in 2024 is much more complex than in 2023, [3], when the high fatality rates were within the range of estimates for the endemic stage of the disease [4] and in some countries exceeded the mortality of seasonal influenza [3,5]. In 2024 the global average daily numbers of new COVID-19 cases (confirmed and reported to WHO) varied between 4.5K to 40K, [6] and are much lower than the lower endemic limit (300K, [4]). In particular, during 28 days to 29 September 2024, the global number 314,895 of confirmed new COVID-19 cases was reported, [6]. Since 301,397 cases (96%) were detected in the WHO European region with population 929 million, [7], we can calculate the average daily numbers of new cases per million DCC= 301397/(28*929)=11.6. This value is much closer to the lower endemic limit DCC* = 37.2, [3]. In some European countries corresponding DCC values (calculated with the use of numbers of cases reported during 28 days to 29 September 2024, [6] and corresponding volumes of populations, [8]) were higher than this limit: Croatia (107.4), Moldova (60.5) and Poland (44.3). Moreover, the figure for Lithuania (DCC=200.5) exceeds the upper endemic limit DCC** = 124.1, [3].
In September 2024 the global average daily number of COVID-19 related deaths per million DDC=0.021=4862/(28*8200) (calculated with the use of information available in [6,8]) was also much smaller than the lower endemic limit DDC* = 0.124 [3,4]. Nevertheless, the figure for Moldova DDC=0.31=22/ (28*2.539) exceeded this limit and corresponding values for USA 0.43=4000/ (28*333.3) and Sweden 0.72=210/ (28*10.49) exceed even the upper endemic limit DDC** =0.409, and the maximum flu mortality DDC**(flu) =0.18, [3,5]. High mortality rates make the development of new vaccines or the further use of existing ones very urgent.
Due to rather large numbers of new COVID-19 cases, it is necessary to improve the methods of controlling the spread of infections, [9-26]. In particular, the experience of Zero-COVID countries [27] that in 2020 and 2021 practiced the policy of maximally reducing the number of cases due to lockdowns, closing borders, tracing, high testing levels, etc., requires further research. Increasing the test per case ratio looks quite promising, since many tested and isolated people in the environment of the detected infected person may slow down the further spread of the infection, [16,24,26]. In particular, a simultaneous increase in testing after the start of an increase in daily numbers of COVID-19 cases allowed New Zealand to stop the pandemic waves in 2020 and 2021, [26].
In this study we focus on the impact of vaccination levels (the percentages of fully vaccinated people VC and boosters BC) on the COVID-19 pandemic dynamics. Some optimistic results about “the effectiveness of the vaccination on reducing the transmission of SARS-CoV-2” in Israel were published in [28] with the use of statistical data from 28 August 2020 to 24 February 2021. The belief that vaccinated people do not spread the infection resulted in the policy of relaxing quarantine restrictions for them and introducing special passports in many European countries. Nevertheless, high level of vaccinations in Israel (VC was around 60%) did not prevent a new pandemic wave in June-August 2021 with huge daily numbers of cases (DCC) and deaths (DDC), [29]. The same situation occurred in Qatar in March-April 2021 at VC values around 50%, [30], in Japan in July-August 2022 (VC>82%, BC=68% - 87%), [26,31], in New Zealand, which already at the end of 2021 reached the values VC=74.4% and BC=6.9%; nevertheless, the huge increase in the number of cases occurred (12 thousand in 2021 and 2 million in 2022), and many other countries, [26]. Moreover, the statistical analysis of DCC and DDC values in 34 countries and regions in 2022 and 2023 demonstrated increasing trends with the increase of vaccination levels VC and BC, [32]. Even after taking into account differences in population ages no decreasing trends were revealed, [32]. Nevertheless, the case fatality risk CFR=DDC/DCC demonstrated the decreasing trends at higher levels of vaccinations, [32].
To support these very important facts we will perform a systematic analysis of DCC, DDC, and DDC/DCC trends in 34 countries and regions in 2020, 2021, 2022, and 2023 versus VC and BC values.
Materials and Methods
We will use the accumulated numbers of laboratory-confirmed COVID-19 cases CCi and deaths DCi per million, accumulated numbers of fully vaccinated people VCi and boosters BCi per hundred for 33 countries (shown in Table 1) and the world (i =1, 2,.., 34) listed in COVID-19 Data Repository by the Centre for Systems Science and Engineering (CSSE) at Johns Hopkins University (JHU), [2] (version of file updated on September 28, 2023). We have chosen the countries with highest numbers of accumulated cases and death (according to the WHO report [1]), some other countries and regions, [32].
|
No., i |
Country, region |
Accumulated numbers of cases per million as of 31 December 2020, CCi(o) |
Accumulated numbers of deaths per million as of 31 December 2020, DCi(o) |
Days in 2020 when the fist COVID-19 were registered |
Duration of the epidemic in 2020. days, Ti(-1) |
Percentages of fully vaccinated people as of 1 July 2021, VCi(o) |
|
|
1 |
USA |
57872.22 |
1040.54 |
Jan 20 |
347 |
49.44 |
|
|
2 |
Taiwan* |
33.44 |
0.293 |
Jan 22 |
345 |
0.18 |
|
|
3 |
Hong Kong* |
1181.221 |
19.763 |
Jan 23 |
344 |
19.97 |
|
|
4 |
India |
7244.474 |
104.954 |
Jan 30 |
337 |
4.17 |
|
|
5 |
France |
36181.03 |
983.093 |
Jan 26 |
341 |
31.96 |
|
|
6 |
Germany |
19913.41 |
563.861 |
Jan 04 |
363 |
38.16 |
|
|
7 |
Brazil |
35128.09 |
894.886 |
Feb 27 |
309 |
12.52 |
|
|
8 |
South Korea |
1171.882 |
17.369 |
Jan 19 |
348 |
9.92 |
|
|
9 |
Japan |
1858.014 |
27.543 |
Jan 14 |
353 |
15.39 |
|
|
10 |
Italy |
35294.35 |
1246.734 |
Jan 31 |
336 |
32.69 |
|
|
11 |
UK |
37973.65 |
1382.291 |
Feb 01 |
335 |
49.24 |
|
|
12 |
Turkey |
25711.74 |
241.876 |
March 12 |
295 |
17.97 |
|
|
13 |
Mexico |
11733.48 |
1157.79 |
Feb 21 |
315 |
15.44 |
|
|
14 |
Peru |
29677.19 |
2733.249 |
March 06 |
301 |
9.85 |
|
|
15 |
Iran |
13763.36 |
622.187 |
Feb 21 |
315 |
1.851 |
|
|
16 |
Indonesia |
2697.62 |
80.355 |
March 02 |
305 |
4.95 |
|
|
17 |
Canada |
14705.86 |
397.198 |
Jan 26 |
341 |
31.76 |
|
|
18 |
South Africa |
17350.04 |
468.044 |
March 06 |
301 |
2.092 |
|
|
19 |
Egypt |
1231.137 |
68.258 |
Feb 16 |
320 |
0.73 |
|
|
20 |
Israel |
44413.27 |
353.053 |
Feb 13 |
323 |
55.08 |
|
|
21 |
Nigeria |
396.154 |
5.848 |
Feb 29 |
307 |
0.534 |
|
|
22 |
Australia |
1084.179 |
35.145 |
Jan 25 |
342 |
6.59 |
|
|
23 |
New Zealand |
348.486 |
4.821 |
Feb 28 |
308 |
8.99 |
|
|
24 |
Vietnam |
14.829 |
0.356 |
Jan 25 |
342 |
0.21 |
|
|
25 |
European Union |
33290.24 |
859.54 |
Jan 04 |
363 |
33.77 |
|
|
26 |
Europe |
31188.88 |
776.686 |
Jan 04 |
363 |
28.15 |
|
|
27 |
Africa |
1925.97 |
45.595 |
Feb 16 |
320 |
1.1 |
|
|
28 |
Asia |
4342.447 |
71.142 |
Jan 04 |
363 |
3.45 |
|
|
29 |
North America |
37812.13 |
892.957 |
Jan 20 |
347 |
33.94 |
|
|
30 |
South America |
29989.63 |
961.637 |
Feb 27 |
309 |
13.1 |
|
|
31 |
High income countries |
32709.37 |
711.797 |
Jan 04 |
363 |
33.61 |
|
|
32 |
Upper middle income countries |
9494.427 |
283.802 |
Jan 04 |
363 |
4.69 |
|
|
33 |
Lower middle income countries |
4953.355 |
92.966 |
Jan 23 |
344 |
3.25 |
|
|
34 |
The world |
10323.98 |
242.848 |
Jan 04 |
363 |
8.17 |
|
|
* Data from the JHU file corresponding to 1 January 2023, [2] |
|
||||||
To calculate the average daily numbers of cases DCC and deaths DDC per million, we will use simple formulas:
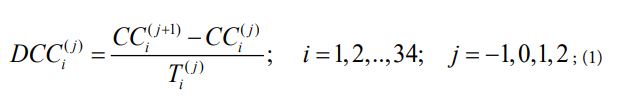
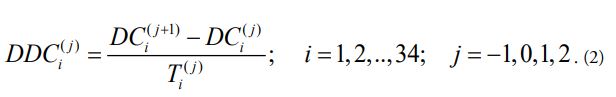
Values of the upper index j=-1, 0, 1, 2 correspond to 2020, 2021, 2022, and 2023, respectively; CCi(-1)=0, DCi(-1)=0, i=1,2,....,34. For 2021 and 2022 we will use the number of cases and deaths accumulated during these years and the number of days Ti(0)=Ti(1)=365, i=1,2,....,34; for 2023 - the number of cases and deaths accumulated from 1 January to 10 September and the corresponding number of days Ti(2)=252, i=1,2,....,34. For 2020 we will use the number of cases and deaths accumulated in this year and different numbers of days Ti(-1), i=1,2,....,34, according to the appearances of the first COVID-19 cases (Table 1).
The averages values of the case fatality risks corresponding to different years can be calculated with the use of the formula:
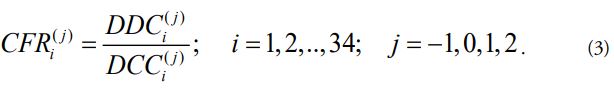
Values DCCi(j); DDCi(j) and CFRi(j), i=1,2,....,34; j=1,2 corresponding to 2022 and 2023 were calculated in [32]. We will use them together with the values corresponding to 2020 and 2021 to analyze the trends versus percentages of vaccinations VCi(j) and BCi(j); i=1,2,....,34; j=1,2 accumulated as of 1 July in a corresponding year. Values VCi(0) are listed in (Table 1), figures VCi(j) and BCi(j); i=1,2,....,34; j=1,2 are available in [32]. The lack of systematic data for 2024 does not allow us to extend our analysis to this year as well.
Figures corresponding to different days: 1 – 2021-06-29; 2 – 2021-07-08; 3 – 2021-06-28; 4 – 2021-06-28.
Results and Discussion
The results of calculations for values corresponding to 2020 and 2021 with the use of formulas (1)-(3) are listed in (Table 2) and used in (Figures 1-3) (together with the values corresponding to 2022 and 2023 presented in [32]) to show trends versus vaccination levels VC for DCC, DDC and CFR, respectively. Since the VC significantly increased in 2021 and 2022, lines between second and third marker (from left to right) represent the main trends versus vaccination levels. The influence of boosters can be illustrated by figures corresponding to 2022 and 2023. Unfortunately, significant decrease in testing levels led to abrupt decrease in DCC and DDC values in 2023 (see third and fourth markers in (Figures 1 and 2) and [32]). This fact makes our analysis of trends versus BC impossible. Dashed horizontal magenta lines represent global endemic limits DCC* = 37.2, DCC** = 124.1, DDC* = 0.124, DDC** =0.409 and CFR*=0.0033 estimated with the use of COVID-19 pandemic dynamics in 2022, [3]. Dotted horizontal magenta lines represent global flu mortality limits DDC*(flu) =0.1 and DDC**(flu) =0.18, [3,5].
Shown in Figure 1 lines between second and third marker (from left to right) illustrate that the numbers of cases DCC mostly increased with the increase of the vaccination levels VC (the same is the global trend represented by magenta markers). Opposite trends demonstrate less vaccinated Africa, Lower middle income countries, India, Indonesia, Iran, South Africa, Nigeria, and Egypt. Slightly lower values of DCC in 2022 (in comparison with 2021) have also been observed in Brazil and the UK. Therefore, it is not surprising that the statistical analysis carried out in [32] showed an increase in the numbers of cases with an increase in the percentage of fully vaccinated persons VC. A similar trend was also detected versus BC values, and no decrease in the number of cases DCC with increasing levels of vaccinations was detected even after corrections taking into account the median age of the populations, [32]. Thus, to reduce the number of new COVID-19 cases, further use of existing vaccines is impractical.

Figure 1. Averaged daily numbers of COVID-19 cases DCC per million from 2020-2023 for different countries and regions versus percentages of fully vaccinated people VC. Dashed horizontal magenta lines represent global endemic limits DCC* = 37.2, DCC** = 124.1, [3].
Figure 2 illustrates the trends for the average daily numbers of COVID-19 related deaths per million DDC. Lines between second and third marker (from left to right) show that DDC mostly decrease with the increase of the vaccination levels VC (the same is the global trend shown by magenta markers). Nevertheless, in some highly vaccinated countries and regions (Taiwan, Hong Kong, Japan, South Korea, Canada, Australia, and New Zealand) DDC values increased in 2022 in comparison with 2021 (when the levels of vaccinations were much lower). The statistical analysis carried out in [32] showed an increase in the numbers of deaths with an increase in the percentage of fully vaccinated persons VC. A similar trend was also detected versus BC values, and trends to decrease the number of deaths DDC with increasing levels of vaccinations were not detected even after corrections taking into account the median age of the populations, [32]. Thus, further use of existing vaccines cannot reduce the number of COVID-19 related deaths per capita as well. In most countries it remains higher than seasonal flu mortality (see horizontal magenta dotted lines in (Figure 2), [3,5]).

Figure 2. Average daily numbers of COVID-19 related deaths DDC per million from 2020-2023 for different countries and regions versus percentages of fully vaccinated people VC. Dashed horizontal magenta lines represent global endemic limits DDC* = 0.124, DDC** =0.409, [3]. Dotted horizontal magenta lines represent global flu mortality limits DDC*(flu) =0.1 and DDC**(flu) =0.18, [3,5].
Figure 3 illustrates the trends for the average case mortality risks CFR=DDC/DCC. Lines between second and third marker (from left to right) show that CFR significantly decreased in 2022 in comparison with 2021 (when vaccination levels VC much lower). The CFR decreasing trends in 2022 and 2023 with the increase of VC and BC values were also revealed in [32] without and with taking into account the age of populations. It looks that vaccinations really reduced the probability of dying for persons tested positive (i.e., CFR), despite the sharp CFR increase in 2023 in many countries and worldwide (exceptions are India, South Korea, South Africa, Mexico, Nigeria, Vietnam, and Africa, see lines between third and fourth markers in Figure 3). This increase can be attributed to a decline in vaccination rates (see high slopes between third and fourth markers in Figure 3), but the most likely reason may be a significant reduce in testing levels after mid-2022, resulting in a disproportionate decrease in the numerator and denominator in the formula (3), [32]. It must be noted that according to the number of cases and deaths reported to WHO, [6], during 28 days to 29 September 2024, the global CFR figure 0.0154= 4862/314895 is much higher than the endemic level CFR*=0.0033, [3] shown in (Figure 3) by the dashed magenta line. The corresponding value for Europe CFR=0.0025=758/301397 is close to the endemic level.

Figure 3. Average case fatality risks CFR from 2020-2023 for different countries and regions versus percentages of fully vaccinated people. The dashed horizontal magenta line represents the global endemic value CFR*=0.0033, [3].
Thus, vaccinations and boosters can be recommended in order to reduce the severity of SARS-CoV-2 disease and probability of dying for infected individuals (CFR). Unfortunately, due to the high number of infections (which is proportional to the DCC values and cannot be reduced by existing vaccines), the probably of dying in a population (proportional to the DDC values) will remain high without additional means of controlling the spread of infection. Therefore, it is still necessary to avoid close contacts and crowded places, trace and isolate infected people, wear masks in transport and medical facilities, wash hands more often, correct nutritional diet [33], etc.
Here, the experience of Zero-COVID countries [27], where the number of deaths per capita accumulated as of 10 September 2023 is approximately half as much as in other countries [34], is very indicative. During some periods of the pandemic, these countries managed to maintain very high test-to-case ratios TC which probably allowed completely controlling the spread of infection with very small values of DCC and DDC, [26]. For example, before 2022 the average TC values varied from 71 to 2,733 in Taiwan, Hong Kong, South Korea, Australia, and New Zealand (these figures were calculated with the use of numbers of test per thousand and cases per million accumulated as of 31 December 2021, [2,32] and are much higher than in the US (13.6) and the UK (23.3)). Due to the fact that the number of tests could not be increased accordingly with the increase in the daily number of cases during the new pandemic waves, the number of cases and deaths increased sharply in these countries in 2022 despite a very high level of vaccinations (see Figures 1, 2 and [26]). To control recent waves of SARS-CoV-2 disease, the immediate and sufficient increase of the number of tests can be recommended. If many people having contact with an infected person will be tested and isolated (e.g., TC value have to exceed 200), the spread of infection can be controlled, [26].
Many other factors (e.g., new variants, public health measures) also influence the trends studied, so they should be taken into account in the future, as well as the data incompleteness due to a sharp decrease in the level of testing. The presented analysis is based on the country-level data which may not reflect individual-level effects.
Conclusions
The average daily numbers of cases DCC and death DDC per million, case fatality risks CFR=DDC/DCC in 2020-2024 calculated for 34 countries and regions were used to investigate the trends versus vaccination and booster levels. These trends together with the published before results of statistical analysis show that existing vaccines cannot reduce the number of new COVID-19 cases and deaths. Therefore, it is still necessary to apply non-pharmaceutical measures such as: avoiding close contacts and crowded places, tracing and isolating infected people, wearing masks in transport and medical facilities, hands washing, etc.
Vaccinations and boosters can be recommended in order to reduce the severity of SARS-CoV-2 disease and probability of dying for infected individuals (CFR). Unfortunately, due to the high number of infections (which is proportional to the DCC values and cannot be reduced by existing vaccines), the probably of dying in a population (proportional to the DDC values) will remain high without additional means of controlling the spread of infection. Recent epidemic waves can probably be controlled with the use of the immediate and sufficient increase of the number of tests. Since vaccinations reduce the severity of SARS-CoV-2 disease and probability of dying for infected individuals, they should be recommended for the elderly and those with weakened immune systems.
Competing Interests
The author declares no competing interests.
Clarification Point
No humans or human data was used during this study. No human participants are involved in this study.
Data Availability
The study uses only open statistical data available on the Internet. All data generated or analyzed during this study are included in this text.
Acknowledgements
The author is grateful to Ulrike Tillman, James Robinson, Robin Thompson, Matt Keeling, Paul Brown, and Oleksii Rodionov for their support and providing very useful information.
Financial Support
This paper was written with the support of the INI-LMS Solidarity Programme at the University of Warwick, UK.
References
2. COVID-19 Data Repository by the Center for Systems Science and Engineering (CSSE) at Johns Hopkins University (JHU) [Internet]. Available from: https://github.com/owid/covid-19-data/tree/master/public/data. Accessed 11 December 2023.
3. Nesteruk I. Should we ignore SARS-CoV-2 disease? Epidemiol Infect. 2024 Mar 20;152:e57.
4. Nesteruk I. Endemic characteristics of SARS-CoV-2 infection. Sci Rep. 2023 Sep 8;13(1):14841.
5. Paget J, Spreeuwenberg P, Charu V, Taylor RJ, Iuliano AD, Bresee J, et al. Global mortality associated with seasonal influenza epidemics: New burden estimates and predictors from the GLaMOR Project. J Glob Health. 2019 Dec;9(2):020421.
6. WHO COVID-19 database. https://covid19.who.int/data. Accessed 13 October 2024.
7. WHO/EUROPE population [Internet]. Available from: https://gateway.euro.who.int/en/indicators/hfa_1-0010-mid-year-population/#id=18510. Accessed 13 October 2024.
8. World population. [Internet]. Available from: https://www.worldometers.info/world-population. Accessed 13 October 2024.
9. Lazarus JV, Romero D, Kopka CJ, Karim SA, Abu-Raddad LJ, Almeida G, et al. A multinational Delphi consensus to end the COVID-19 public health threat. Nature. 2022 Nov;611(7935):332-45.
10. Fraser C, Riley S, Anderson RM, Ferguson NM. Factors that make an infectious disease outbreak controllable. Proc Natl Acad Sci U S A. 2004 Apr 20;101(16):6146-51.
11. Eames KT, Keeling MJ. Contact tracing and disease control. Proc Biol Sci. 2003 Dec 22;270(1533):2565-71.
12. Casella F. Can the COVID-19 epidemic be controlled on the basis of daily test reports?. IEEE Control Systems Letters. 2020 Jul 17;5(3):1079-84.
13. Cherniha R, Davydovych V. A mathematical model for the COVID-19 outbreak and its applications. Symmetry. 2020 Jun 10;12(6):990.
14. Ferretti L, Wymant C, Kendall M, Zhao L, Nurtay A, Abeler-Dörner L, et al. Quantifying SARS-CoV-2 transmission suggests epidemic control with digital contact tracing. Science. 2020 May 8;368(6491):eabb6936.
15. Grantz KH, Lee EC, D'Agostino McGowan L, Lee KH, Metcalf CJE, Gurley ES, et al Maximizing and evaluating the impact of test-trace-isolate programs: A modeling study. PLoS Med. 2021 Apr 30;18(4):e1003585.
16. Nesteruk I, Rodionov O. Impact of Vaccination and Testing Levels on the Dynamics of the COVID-19 Pandemic and its Cessation. J Biomed Res Environ Sci. 2021 Nov 23;2(11):1141-7.
17. Pates R, Ferragut A, Pivo E, You P, Paganini F, Mallada E. Respect the unstable: delays and saturation in contact tracing for disease control. SIAM Journal on Control and Optimization. 2022;60(2):S196-220.
18. Alamo T, G Reina D, Millán Gata P, Preciado VM, Giordano G. Data-driven methods for present and future pandemics: Monitoring, modelling and managing. Annu Rev Control. 2021;52:448-64.
19. Sun K, Wang W, Gao L, Wang Y, Luo K, Ren L, et al. Transmission heterogeneities, kinetics, and controllability of SARS-CoV-2. Science. 2021 Jan 15;371(6526):eabe2424.
20. Nesteruk I, Rodionov O. New COVID-19 pandemic waves caused by omicron and effi ciency of vaccinations. J ISSN. 2022;2766(2276):10-37871.
21. Ali ST, Wang L, Lau EHY, Xu XK, Du Z, Wu Y, et al. Serial interval of SARS-CoV-2 was shortened over time by nonpharmaceutical interventions. Science. 2020 Aug 28;369(6507):1106-9.
22. Hu J, Qi G, Yu X, Xu L. Modeling and staged assessments of the controllability of spread for repeated outbreaks of COVID-19. Nonlinear Dyn. 2021;106(2):1411-24.
23. Morris DH, Rossine FW, Plotkin JB, Levin SA. Optimal, near-optimal, and robust epidemic control. Communications Physics. 2021 Apr 20;4(1):78.
24. Nesteruk I, Rodionov O. Omicron Waves of the COVID-19 Pandemic and Effi cacy of Vaccinations and Testing. Journal ISSN. 2022;2766:2276.
25. Parag KV. How to measure the controllability of an infectious disease?. Physical Review X. 2024 Jul 1;14(3):031041.
26. Nesteruk I. Impact of vaccination and testing levels on the COVID-19 waves. J Allergy Infect Dis. 2024;5(1):44-55.
27. Zero-COVID countries. [Internet]. Available from: https://en.wikipedia.org/wiki/Zero-COVID. Accessed 18 January 2024.
28. Rossman H, Shilo S, Meir T, Gorfine M, Shalit U, Segal E. COVID-19 dynamics after a national immunization program in Israel. Nat Med. 2021 Jun;27(6):1055-61.
29. Nesteruk I. Influence of possible natural and artificial collective immunity on new COVID-19 pandemic waves in Ukraine and Israel. Exploratory Research and Hypothesis in Medicine. 2022 Mar 25;7(1):8-18.
30. Nesteruk I. The real COVID-19 pandemic dynamics in Qatar in 2021: simulations, predictions and verifications of the SIR model. Semina: Ciências Exatas e Tecnológicas. 2021 Sep 6;42(1Supl):55-62.
31. Nesteruk I. Improvement of the software for modeling the dynamics of epidemics and developing a user-friendly interface. Infect Dis Model. 2023 Jul 8;8(3):806-21.
32. Nesteruk I. Trends of the COVID-19 dynamics in 2022 and 2023 vs. the population age, testing and vaccination levels. Front Big Data. 2024 Jan 10;6:1355080.
33. Martins IJ. COVID-19 infection and anti-aging gene inactivation. Int. J. Mol. Sci. 2015;16:29554-73.
34. Nesteruk I, Keeling M. Population age as a key factor in the COVID-19 pandemic dynamics. medRxiv. 2023 Dec 1:2023-11.