Abstract
Introduction: Record numbers of new COVID-19 cases and deaths registered in Japan, Europe, and other countries in 2022 aroused questions about efficacy of vaccination and testing. The pandemic waves in Japan, Ukraine, USA, Hong Kong, mainland China, South Korea, the UK, New Zealand, Africa, and Europe in 2020, 2021, and 2022 will be compared. Influence of vaccination and testing levels will be investigated.
Methods: The smoothed daily numbers of new cases and deaths per capita, case fatality risks as the ratio of these characteristics and accumulated numbers of deaths and cases, the tests per case ratio, and the non-linear correlation were used.
Results: As in other countries, new severe waves of the COVID-19 pandemic occurred in Japan in 2022 despite of very high vaccination level. Non-linear correlation revealed, that the daily number of new cases drastically decreases with the increase of the tests per case ratio.
Discussion: Increasing the test per case ratio and application of quarantine restrictions for the entire population, including vaccinated people, can be recommended to reduce the negative consequences of epidemics.
Keywords
COVID-19 pandemic, Efficiency of vaccinations, Testing efficacy, Mathematical modeling of infection diseases, Statistical methods
Introduction
The first studies of the effectiveness of SARS-CoV-2 testing appeared in 2020 immediately after the pandemic outbreak [1-16]. In 2021, with the advent of a sufficient number of vaccinated people, it became possible to study the impact of vaccination levels on the COVID-19 pandemic dynamics [17-26]. Constant changes in its dynamics caused by changes in quarantine conditions and algorithms for testing and vaccination, the emergence of new strains require updating and rethinking the results of previous studies. To compare the pandemic situation in different countries with different sizes of their population the relative characteristics can be used: e.g., the daily numbers of new COVID-19 cases per million (DCC), deaths per million (DDC), and tests per thousand (DTC).
Usually the values of DCC, DDC, and DTC are very random and show some weekly periodicity. For example, COVID-19 Data Repository by the Center for Systems Science and Engineering (CSSE) at Johns Hopkins University (JHU) provides the daily figures of cases, deaths, tests per capita, and calculates also their smoothed values by averaging numbers corresponding to a fixed day and six previous days [27].
In order to find some seasonal trends, the values of DCC, DDC and the case fatality risk CFR = DDC/DCC in 2020, 2021, and 2022 were compared in previous studies [18-21]. Since the influence of vaccinations in 2020 and early 2021 can be neglected, the comparison of the COVID-19 pandemic dynamics for the later period enables us to reveal some influences of vaccination levels.
In our previous study [28] the daily numbers of cases per capita for Argentina, Brazil, India, South Africa, Ukraine, EU, the UK, USA and the whole world for the period from March to August 2020 were compared with the corresponding values in 2021. The DCC, DDC, CFR values, and vaccination levels in the same countries and Australia have been compared for the period from September to January in 2020-2021 and 2021-2022 [18]. In this paper we will focus on the daily numbers of cases and deaths per capita, and case fatality risks registered in Japan in 2020, 2021, and 2022 and will try to find their links with the percentages of fully vaccinated people (VC) and boosters (BC), the daily numbers of tests per thousand DTC and the daily tests per case ratio TC=1000*DTC/DCC. The pandemic dynamics in Japan, Ukraine, USA, Hong Kong, mainland China, South Korea, the UK, New Zealand, Africa, and Europe will be compared. The non-linear regression will be applied to find links between the DCC and TC values.
Results of [16-21,23-26,29,30] and the numbers of cases CC and deaths DC per capita accumulated as of 2022 and 2023 and corresponding VC and BC values will be used to estimate the efficacy of vaccination during the COVID-19 pandemic. We will try to answer the question: was the main aim of vaccinations (reducing the numbers of cases and deaths in different countries and worldwide) achieved? It is necessary to start systematic discussion of this very important issue. Some results are already published in [26,29].
Theoretical studies of the controllability of an infectious disease and their applications to the COVID-19 pandemic can be found in [31-48]. This paper is focused on the tests per case ratio as a controlling tool (already discussed in [20,21,24]). We hypothesize that high levels of the test per case ratio can reduce the numbers of cases and deaths.
Materials and Methods
We will use the smoothed daily numbers of new cases (DCC, per million), deaths (DDC, per million) and tests (DTC, per thousand) registered by JHU, [27] in 2020, 2021, and 2022. We will also use the accumulated percentages of fully vaccinated persons (VC, in 2021 and 2022) and booster doses of vaccines (BC, in 2022) listed in [27]. Since JHU often updates its data sets, we will specify the versions of its file used in different cases.
To find links between DCC values and the daily tests per case ratio TC=1000*DTC/DCC, we will use the non-linear correlation, [20]:
DCC = a + b(TC + c)γ (1)
At γ=1 relationship (1) reduces to a linear one and can be rewritten as follows:
Z = log (DCC - a) = log(b) + γ log(TC + c) (2)
Then for new random variables z and W = log(TC + c) we will have a linear regression. The constant parameters γ , log(b) and corresponding best fitting lines can be found with the use of the standard formulas [49] for every fixed values of constant parameters a and c.
Results and Discussion
Impact of vaccinations on the COVID-19 pandemic waves
Figure 1 illustrates the differences in epidemic characteristics in Japan in 2020 (dotted lines), 2021 (dashed lines) and 2022 (solid lines). We have used the figures corresponding to the version of JHU file published on January 4, 2023, [27]. Blue lines in Figure 1 represent the smoothed daily numbers of cases and display 9 distinct epidemic waves corresponding to the maximum figures of DCC. The maximum values of new daily cases were registered in May–June, August and January–February (2021 and 2022). Thus, we can speak about some seasonal influences on the pandemic dynamics. The highest daily numbers of cases per capita values were registered in August 2022 despite very high levels of vaccination (see green and yellow lines in Figure 1). Similar pandemic waves caused by the Omicron strain were registered in January 2022 in the highly vaccinated UK, USA, and EU [19]. Absence of downward trends for accumulated and daily numbers of COVID-19 cases and deaths per capita with the increase of VC and BC values is also reported in [29] (the results of the linear and non-liner correlations for different periods of the pandemic are listed).
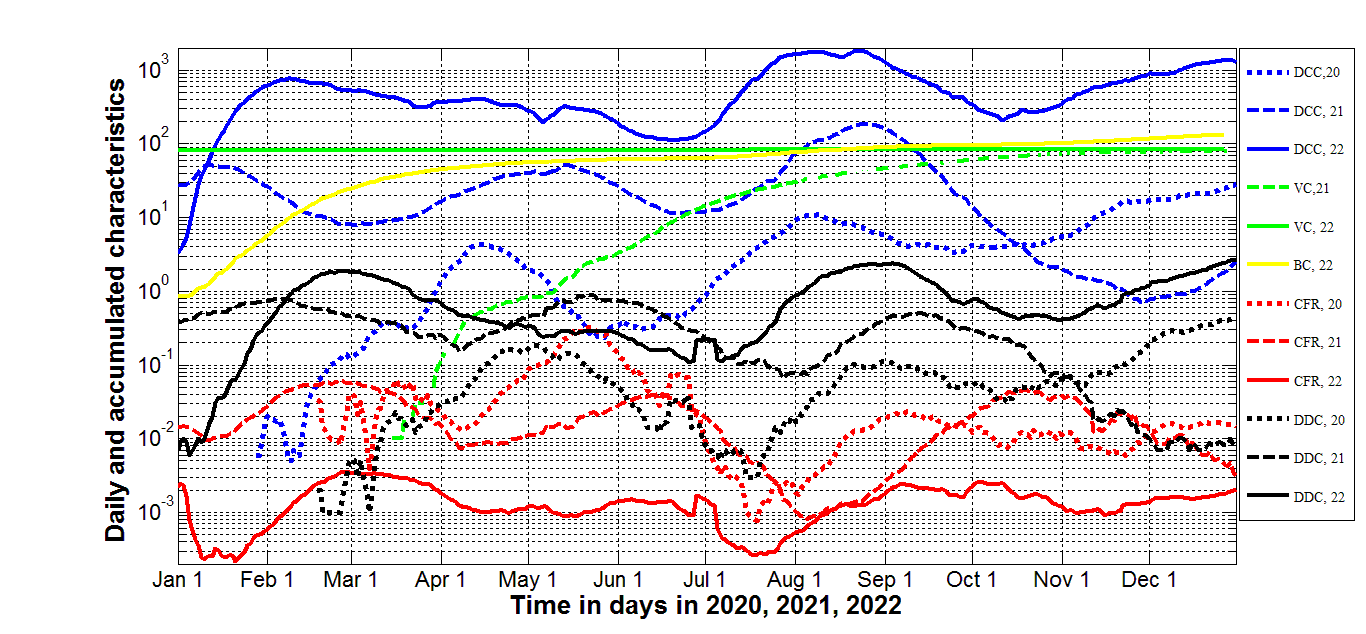
Figure 1. Vaccination levels and pandemic dynamics in Japan in 2020, 2021, and 2022. Averaged daily number of new cases per million (DCC, blue lines), deaths per million (DDC, black lines), vaccination levels (VC and BC, green and yellow lines, respectively), and case fatality risk CFR=DDC/DCC (red lines). Dotted lines correspond to 2020, dashed lines – to 2021 and solid lines - to 2022.
A simple statistical analysis (based on the JHU datasets corresponding to February 1, 2022) revealed the increase in the daily numbers of cases per capita DCC with the growth of the percentage of fully vaccinated people in European countries and worldwide [20]. The same analysis based JHU datasets reported on September 1, 2021 revealed no statistically significant correlation between DCC values and percentages of fully vaccinated people VC, [21]. These changes in the influence of vaccination level can be explained by lifting the quarantine restrictions for vaccinated people in European countries and USA.
Japan did not reduce quarantine restrictions for vaccinated people inside the country, but all people entering the country had to be vaccinated and tested negative. Therefore, it is very interesting to investigate the impact of the vaccination level on the daily numbers of new cases in Japan. Dashed blue and green lines in Figure 1 demonstrate that daily number of new cases diminished with the increase of the vaccination level in September–December 2021. But the trend has changed in 2022 (compare solid blue and green lines). Sharp increase of smoothed daily numbers new cases in 2022 is visible in Figure 1 despite very high vaccination level VC. Daily numbers of cases depend on the percentage of boosters in a wave-like manner, but in the second half of 2022 the number of cases increased with the growth of BC (see solid blue and green lines in Figure 1).
In 2022, Japan has reached a saturation level of vaccination (around 83% of fully vaccinated people, see [27]) and the green solid line in Figure 1), the percentage of boosters has exceeded 100% (see the yellow line). Nevertheless, the total number of cases registered in 2022 (27.4 million, [27]) is approximately 18 times higher than in 2021 (1.5 million, [27]). The number of cases registered in 2023 (before stopping the reporting on May 8, 2023) is 4.7 million [27]. Thus, the 4-month-figure more than 3 times exceeds the annual number of cases in 2021.
Similar trend is visible for global number of cases (203 million with the increase of VC values from zero to 48.6% registered in 2021 and more than twice higher figure - 444 million - in 2022, when the percentage of fully vaccinated people has increased from 48.6 to 63.3) and many other countries and regions according to JHU datasets [27]. For example, in EU 125.4 million cases were registered in 2022 (38.6 million in 2021 with the increase of vaccination level VC from 68.7% to 72.7% during 2022), VC values in the US increased from 64.4% to 69.2%, nevertheless the number of cases registered in 2022 (45,9 million) was higher than in 2021 (34.2 million). Another very telling example is provided by New Zealand, which already at the end of 2021 reached the values VC=74.4% and BC=6.9%. Nevertheless, the huge increase in the number of cases occurred (12 thousand in 2021 and 2 million in 2022). Thus, the epidemic waves in 2022 demonstrated ones more that it is impossible to stop the COVID-19 pandemic with the use of vaccination only [26,29,30].
Nevertheless, vaccinations can reduce mortality. The decrease of daily numbers of deaths DDC and case fatality risks DDC/DCC with the growth of percentages of fully vaccinated people was demonstrated for European countries by linear regression analysis performed in [20]. In the EU the number of deaths in 2022 (286 thousand) was less than in 2021 (528 thousand), [27]. A similar trend can be observed in the USA (263 thousand deaths in 2022 and 470 thousand in 2021). Nevertheless, in New Zealand a huge increase in the number of deaths occurred in 2022 (2,280 in comparison with 26 in 2021) despite the high vaccination level.
In Japan we also see the record increase of daily numbers of deaths DDC in 2022 with the maxima levels corresponding to the end of February and beginning of September 2022 (approximately two weeks later, when the maxima of the daily numbers of cases have been achieved, see solid black and blue lines in Figure 1). The total number of COVID-19 related deaths registered in 2022 (39,120) is approximately twice higher than in 2021 (14,979), [27]. The number of deaths registered in 2023 (before stopping the reporting on May 12, 2023) is 17,156, [27]. Thus, the 4-month-figure exceeds the annual number of deaths in 2021 and very high VC figures have not reduced daily numbers of deaths in Japan. Nevertheless, the global COVID-19 mortality demonstrates opposite trend: the maximum (3.53 million) was registered in 2021, but 1.25 million in 2022 and 0.27 million in 2023, [27]. These particular differences in efficiency of vaccinations in Japan and in the whole world need additional investigations taking into account the age structure, testing level, etc.
The dynamics of the case fatality risk CFR=DDC/DCC in Japan is more similar to the case of European countries. In 2022 it was much lower than in 2021 (compare the solid and dashed red lines in Figure 1). The average annual figures (calculated with the use of JHU datasets [27]) are 0.00143=39,120/27,371,282 in 2022 and 0.00996=14,979/1,503,484 in 2021. This fact can be related to the higher vaccination level in 2022 or an increase in natural immunity. Nevertheless, very low CFR values were also registered in August 2021 (see the dashed red line in Figure 1) despite the low level of vaccinations. Similar low CFR values were registered also in July 2020 (see the dotted red line in Figure 1) before starting the vaccinations. We can explain this fact by the influence of the seasonal factors. The probability of deaths caused by SARS-CoV-2 seems to be lower in the summer. In 2023 (for the period from 1 January to 12 May, [27]) the CFR value of 0.00366=(74,694-57,513)/(33,803,572-29,105,070) was 2.6 times higher than in 2022. Similar increase in the case fatally risks was revealed in many countries and in Europe in 2023 [25] . Probably, it is a result of much lower testing level in comparison with 2022.
The global CFR values demonstrated decreasing trend with the increase in the vaccination levels: 2.27% in 2020, 1.74% in 2021, 0.33% in 2022 and 0.26% in 2023 (these figures were calculated using accumulated numbers of cases and deaths listed in [27]). Thus, globally vaccinations decreased the severity of SARS-CoV-2 disease, in particular, the probability to die for a person tested positive (i.e. the case fatality risk). This fact may encourage people to be vaccinated. Nevertheless, growing numbers of new infections (DCC and CC) in 2022 can increase the general probability to die (i.e., daily DDC or accumulated DC numbers of death per capita) for citizens of some countries and regions (Japan and New Zealand are examples).
In Japan, the increasing percentages of boosters BC have not reduced the daily numbers of cases DCC and deaths DDC, and case fatality risks CFR in 2022 (see blue, black, red, and yellow curves in Figure 1). As of February 1, 2022, the DCC values increased, but DDC and CFR figures decreased with the growth of BC for European countries [20]. The efficiency of boosters in the national and global scale needs additional investigations.
To illustrate the influence of vaccination levels VC and BC in other countries and regions, we have subtracted the numbers of COVID-19 cases CC and deaths DC per million accumulated for the period of January 1 to December 6, 2022 and for the same period in 2023 and listed in [27] (Table 1). The averaged case fatality risks in 2022 and 2023 were calculated with the use of the formula CFR=(DC/CC)*100%. We have also extracted the percentages of fully vaccinated persons VC and boosters BC accumulated as of July 1 in 2022 and 2023 (for the UK and South Korea in 2023 we have taken the last reported percentages). Unfortunately, Japan has stopped to report new COVID-19 cases after 12 May 2023, [27].
Table 1 and Figure 2 illustrate the increasing trends for CC and DC values vs. VC and BC both in 2022 and 2023. Huge difference in the numbers of cases and deaths per capita accumulated in Africa in comparison with much higher vaccinated Europe also calls into question the effectiveness of vaccinations against the COVID-19 pandemic. Average daily numbers of cases and deaths per capita calculated in [25] for 2022 and period from January 1, 2023 to September 10, 2023 using JHU datasets [27] for 34 countries and regions demonstrate increasing trends with the increase of vaccination levels VC and BC. At the confidence level 0.01, one-percent increment of VC causes the average 13.3 increase of daily numbers of cases per million (DCC) in 2022 and 2.7 in 2023; the increases of daily numbers of deaths per million (DDC) are 0.026 and 0.011, respectively; one-percent increment of BC causes the average 14.7 increase of DCC in 2022 and 1.7 in 2023; the increases of DDC are 0.025 and 0.0068, respectively [25].
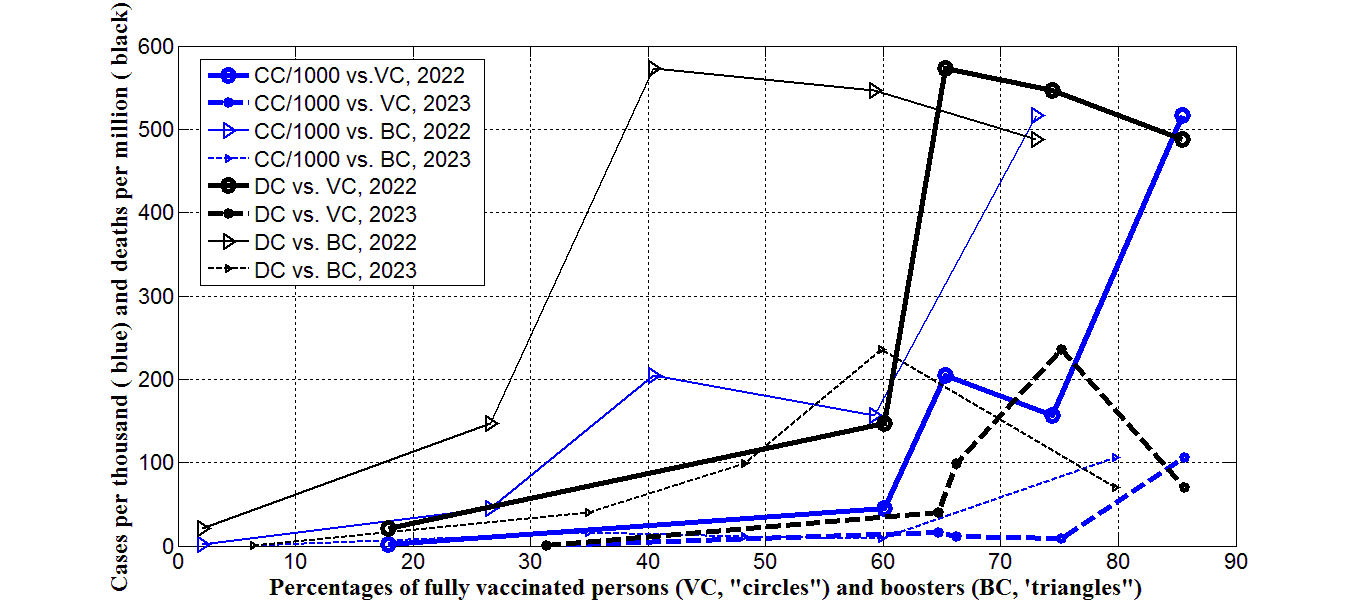
Figure 2. Accumulated numbers of cases per thousand (CC/1000, blue) and deaths per million (DC, black) in 2022 (large markers and solid lines) and in 2023 (small markers and dashed lines) vs. percentages of fully vaccinated persons (VC, “circles”) and boosters (BC, “triangles”). Markers form left to right correspond to Africa, the world, Europe, the UK, and South Korea.
Vaccinated persons can be re-infected [50,51] due to a lot of circulating SARS-CoV-2 variants [52-54], but a very clear uprising trend with increasing VC and BC values could be a result of the age influence, since the most vaccinated countries have older population [25]. Nevertheless, even taking into account the influence of the median age no decreasing trends for the numbers of cases and deaths per capita vs. corrected variations of VC and BC were revealed [25]. Removing restrictions for vaccinated persons and overcrowding in hospitals during vaccinations could also contribute to the additional spread of the infection. Further investigations of the efficiency of vaccinations based on the final accumulated numbers of cases and deaths per capita (started in [26,29]) are necessary in order to use the experience gained during the COVID-19 pandemic to successfully overcome subsequent epidemics.
Impact of tests per case ratio on the COVID-19 pandemic waves
Since the existing vaccines cannot reduce new infections, of particular relevance is the question of methods that could minimize the number of cases. The experience of countries and territories (mostly in Asia and Oceania) that applied a Zero-COVID strategy [55] can be very interesting here. This strategy “involved using public health measures such as contact tracing, mass testing, border quarantine, lockdowns, and mitigation software in order to stop community transmission of COVID-19 as soon as it is detected”, [55]. The goal of Zero-COVID strategy (applied in 2020, 2021, and early 2022) was to “get the area back to zero new infections and resume normal economic and social activities” [55]. Nevertheless, the numbers of cases per capita registered in 2022 and 2023 in Zero-COVID countries were much higher than in other ones (see [56] and compare CC values in South Korea (a Zero-COVID country) with other countries and regions listed in Table 1 and shown in Figure 2). Nevertheless, the Zero-COVID strategy allowed reducing the numbers of deaths per capita and CFR values significantly (see [56] and compare the DC and CFR values in South Korea and other countries and regions listed in Table 1).
|
Characteristics |
Year |
The UK |
Europe |
Africa |
South Korea |
The world |
|
Numbers of fully vaccinated persons per hundred, VC |
2022 |
74.36 |
65.26 |
17.89 |
85.48 |
60.07 |
|
2023 |
75.191 |
66.21 |
31.36 |
85.642 |
64.66 |
|
|
Numbers of boosters per hundred, BC |
2022 |
59.26 |
40.44 |
2.10 |
73.01 |
26.58 |
|
2023 |
59.813 |
48.23 |
6.4 |
79.764 |
34.93 |
|
|
Accumulated numbers of cases per million, CC |
2022 |
157,063 |
204,829 |
2,185 |
516,707 |
44,635 |
|
2023 |
9,155 |
10,891 |
82.603 |
106,388 |
15,890 |
|
|
Accumulated numbers of deaths per million, DC |
2022 |
546.624 |
573.530 |
20.634 |
487.940 |
147.393 |
|
2023 |
236.309 |
99.453 |
0.375 |
70.673 |
40.788 |
|
|
Case fatality risks, %, CFR=100*DC/CC |
2022 |
0.348 |
0.280 |
0.944 |
0.0944 |
0.330 |
|
2023 |
2.581 |
0.913 |
0.454 |
0.0664 |
0.257 |
|
|
1September 11, 2022; 2May 26, 2023; 3September 4, 2022; 4December 12, 2022. |
||||||
Better levels of testing and tracing in Zero-COVID countries have certainly contributed to the detection of more cases. A strong increasing trend of the numbers of cases per capita accumulated in European and African countries as of August 1, 2022 vs. the accumulated numbers of test per capita was revealed in [23] with the use of non-linear correlation. Nevertheless, no correlation was found for 16 European countries with the highest testing levels. No linear correlation between numbers of cases per capita accumulated in European countries as of September 1, 2021 and accumulated numbers of tests per capita was revealed in [21].
Thus, the higher numbers of tests per capita allow detecting more COVID-19 cases, many of them are asymptomatic [12,16,17,57-62]. On the other hand, timely isolation of persons tested positive allows slowing down the spread of infection and reducing the numbers of new cases. These two opposing trends may reduce the impact of the number of tests per capita on the DCC and CC values. Magenta lines in Figure 3 represent the smoothed daily numbers of tests per thousand DTC in Japan listed in [27]. These values were more or less stable in 2021 (see the dashed magenta line). In 2020 the level of testing was much lower (the dotted magenta line), in 2022 it became slightly higher (the solid magenta line). No significant correlations with the daily numbers of new cases (blue lines) are visible.
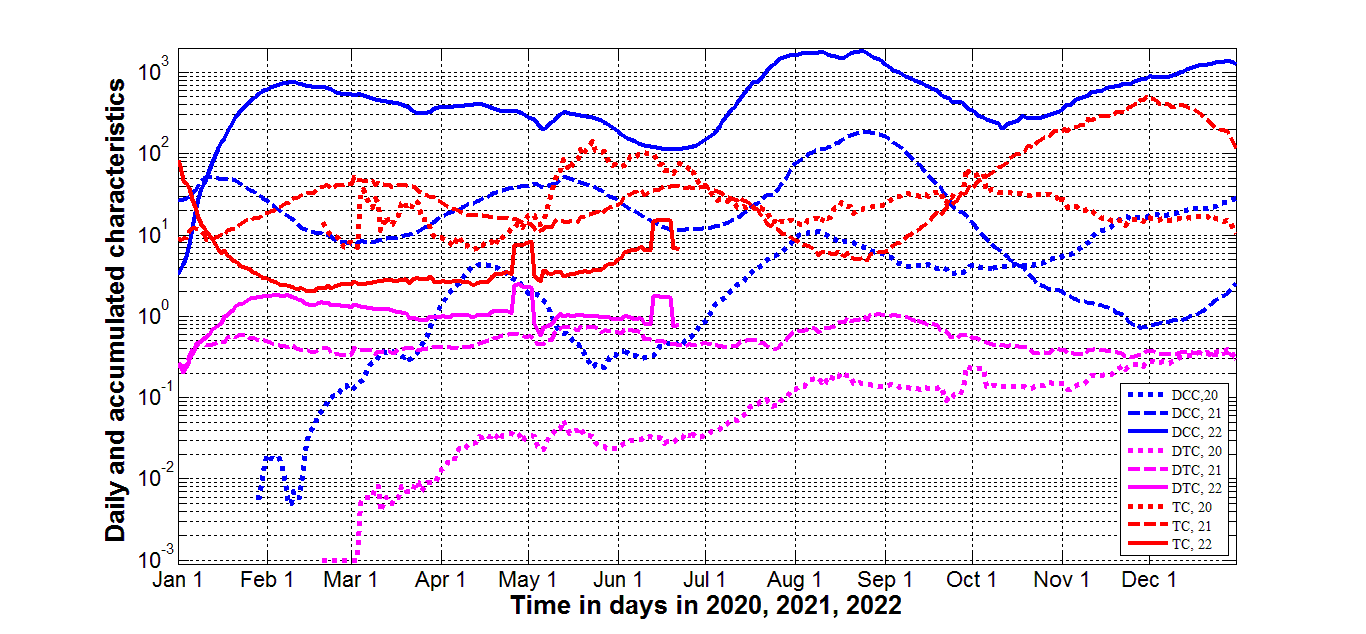
Figure 3. Testing levels and pandemic dynamics in Japan in 2020, 2021, and 2022. Averaged daily number of new cases per million (DCC, blue lines), tests per thousand (DTC, magenta lines), and daily tests per case ratio (TC=1000*DTC/DCC, red lines). Dotted lines correspond to 2020, dashed lines – to 2021 and solid lines - to 2022.
In comparison, the maximal values of the tests per case ratio TC=1000*DTC/DCC (see red lines in Figure 3) correspond to the minimal figures of new daily cases (blue curves). Similar correlation was revealed in [13], where the test positivity rate DCC/(1000*DTC) (a characteristics inverse to the tests per case ratio) was used. To make these correlations more visible, values of DCC, DDC (version of JHU file published on May 26, 2022, [27]) and CFR= DDC/DCC are plotted versus the daily tests per case ratio TC in Figure 4. Blue and black markers illustrate the decreasing of daily numbers of cases and deaths with the growth of the tests per case ratio. The DDC/DCC values are more scattered and show no decreasing trend (see red markers).
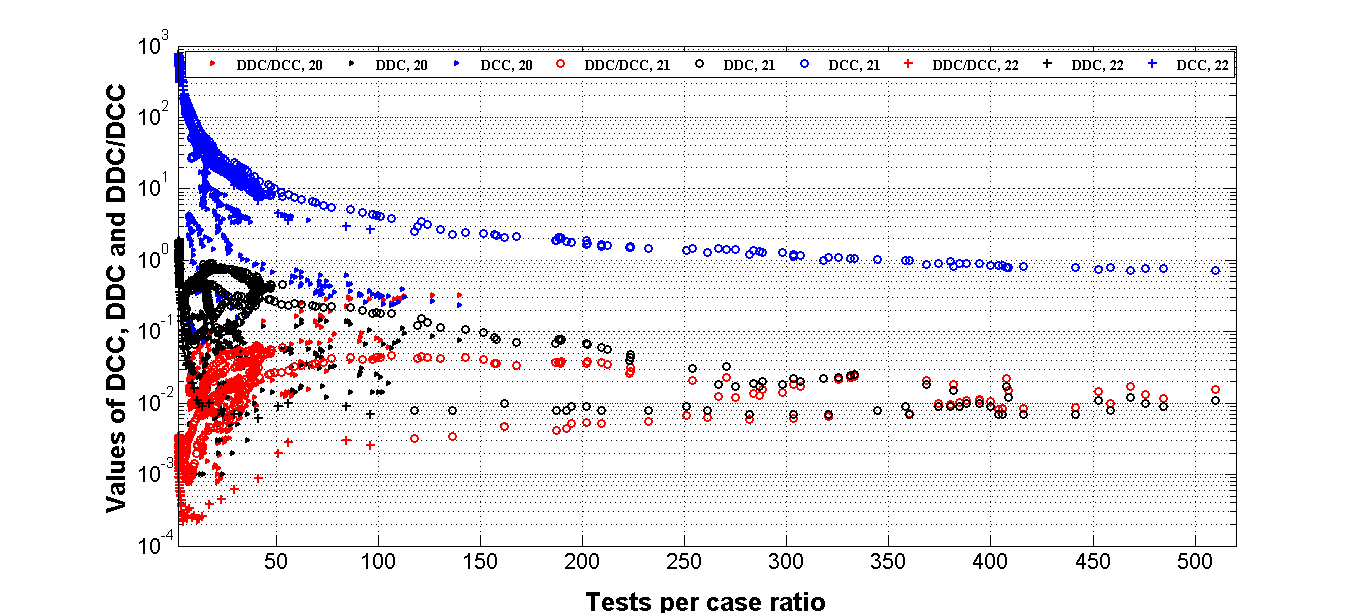
Figure 4. Pandemic dynamics in Japan in 2020, 2021, and 2022 versus daily tests per case ratio. Smoothed daily number of new cases (DCC, blue), deaths (DDC, black ) per million and case fatality risk (DDC/DCC, red) versus daily tests per case ratio (TC=1000*DTC/DCC) in 2020 (“triangles”), 2021 (“circles”) and 2022 (“crosses”).
Daily numbers of new cases per million versus tests per case ratio are shown in [13] for different countries as of January 17, 2021. Despite the rather chaotic nature of the data, we can see a clear trend of decreasing the number of new cases with the increase in the tests per case ratio. Linear regression analysis applied for the datasets corresponding to European and some other countries (including Japan) as of February 1, 2022 showed that the increase of the tests per case ratio TC=1000*DTC/DCC reduces the daily numbers of new cases, [20].
We have applied the nonlinear correlation (1) and the version of JHU file published on May 26, 2022, [27] to find the links between daily numbers of cases per capita DCC and the daily tests per case ratio. The statistical analysis was performed separately for Japan and USA for 2020, 2021, and 2022. The results of calculations are shown in Table 2 and Figure 5. The optimal value of parameter c = - 1 for all cases except the United States in 2022, for which c = -1.09. It can be seen that there are statistically significant correlations for both countries, since the calculated value the Fisher function exceeds the critical one (F / Fc (k1,k2) >1, [49]) for all the cases shown in Table 2. Even in 2020 (when the data was rather scattered in Japan, Ukraine, USA, and Hong Kong, see Figure 4) non-linear correlation (1) was supported by the results of observations at high confidence level 0.001. In 2021 and 2022 the experimental points were very close to the best fitting lines (solid for Japan and dashed for USA). The experimental datasets for Ukraine in 2021 and 2022 are very close to the best fitting lines for Japan in 2021 and 2022 (compare blue and red solid lines with blue and red “triangles” in Figure 5). In 2020, the number of cases per capita in Ukraine were higher than in Japan at fixed values of the tests per case ratio (compare the black solid line and black triangles in Figure 5). The number of cases per capita in USA in 2021 and 2022 were approximately 6-8 times higher than in Japan and Ukraine at the same values of the daily tests per case ratio (see Figure 5). This fact probably reflects the lower level of social distancing in USA.
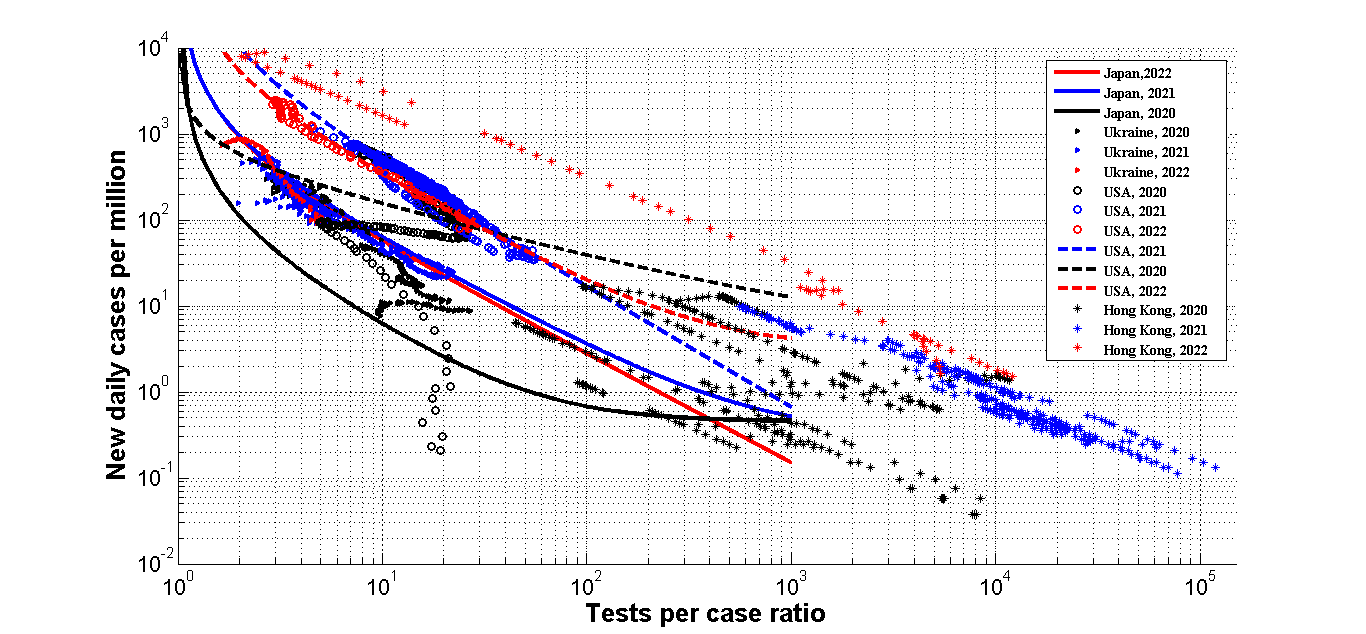
Figure 5. Soothed daily number of new cases per million (DCC) in Japan, Ukraine, USA, and Hong Kong versus smoothed daily tests per case ratio (TC=1000*DTC/DCC) in 2020 (black), 2021 (blue) and 2022 (red). ”Triangles” represent the JHU data [23] for Ukraine, “circles” – for USA, “stars” – Hong Kong. The results of non-linear regression (1) are shown by solid best fitting lines for Japan and dashed ones for USA.
|
Year, country |
Number of observations n |
Correlation coefficient r |
Optimal values of parameter a in eq. (1) |
Optimal values of parameter b
in eq. (1) |
Optimal values of parameter γ in eq. (1)
|
Experimental value of the Fisher function, F
|
Critical value of Fisher function Fc(1,n-2) for the confidence level 0.001
|
F/Fc |
|
2020, Japan |
316
|
-0.4956 |
0.45 |
110.7141 |
-1.3457 |
102.24 |
10.8
|
9.47 |
|
2021, Japan |
365
|
-0.9903 |
0.33 |
944.4762 |
-1.2316 |
18431.7 |
10.8 |
1706.6 |
|
2022, Japan |
100 |
-0.9808 |
0.00 |
918.3058 |
-1.2622 |
2483.54 |
11.6 |
214.1 |
|
2020, USA |
299
|
-0.2603 |
4.14 |
574.36 |
-0.6095 |
21.58 |
10.8 |
1.998 |
|
2021, USA |
365 |
-0.9642 |
0.00 |
10222.8 |
-1.3957 |
4796.96 |
10.8 |
444.2 |
|
2022, USA |
95 |
-0.9962 |
3.27 |
5070.4 |
-1.2371 |
12328.4 |
11.6 |
1062.8 |
Very interesting is the case of Hong Kong where the very high testing level was supported in 2020 and 2021 (see black and blue “stars” in Figure 5). Due to this fact the numbers of new cases were less than 20 per million, i.e., the epidemic was controlled completely. The reduction of the tests per case ratio caused a huge epidemic wave with very high daily numbers of cases per capita DCC. In particular, the DCC values became even higher than at maximum level in the USA (compare red “stars” and “circles” in Figure 5).
The relative characteristics in Hong Kong versus time in 2022 are shown in Figure 6 (dashed lines). The daily number of new cases started to increase after January 18 (see the blue dashed line). Since the number of tests remained constant (see the black dashed line), the daily tests per case ratio diminished drastically (the red dashed line). After some increase of the number of tests (period of January 30 to February 5), the decrease of the test per case ratio stopped, and some stabilization of the number of cases is visible (the blue dashed line). But probably it was already not enough to control the epidemic outbreak, especially after fixing the number of tests. As a result, the drastic increase of the number of cases is visible for the period of February 6 to February 24 (see the blue dashed line). This increase has accelerated after the decrease of the number of tests in the end of February.
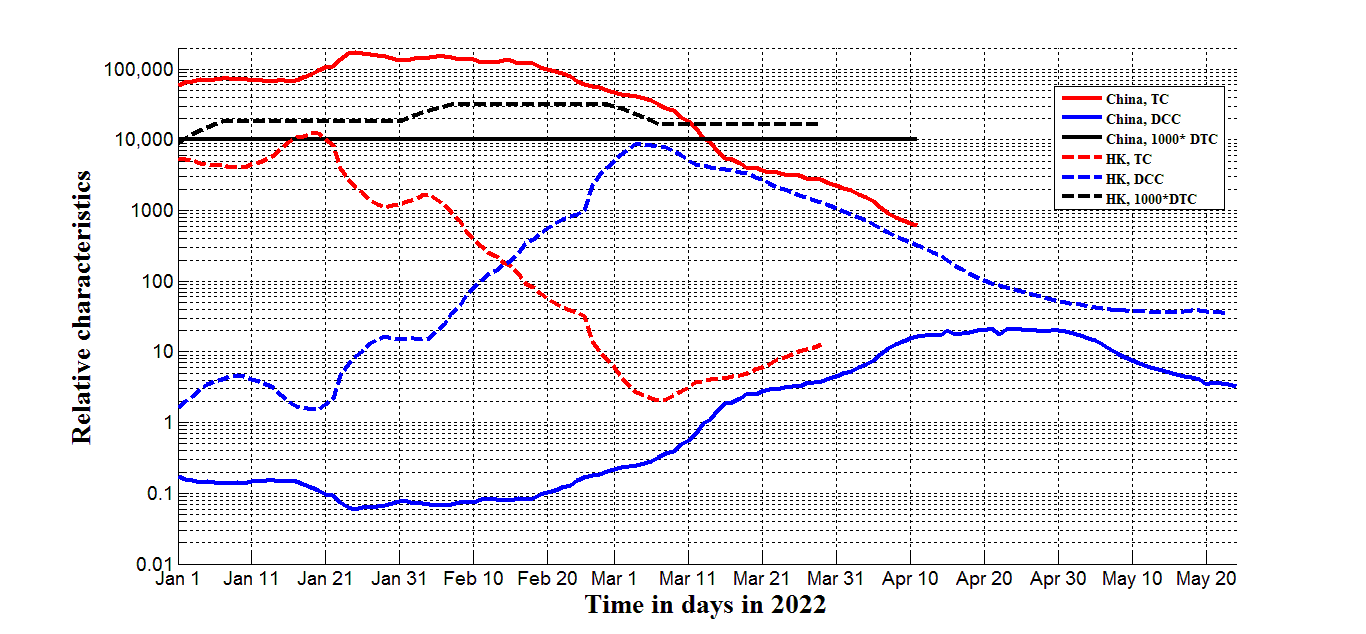
Figure 6. Pandemic dynamics and testing levels in mainland China (solid lines) and Hong Kong (HK, dashed lines) in 2022. Blue lines represents the smoothed daily numbers of new cases DCC, black ones – smoothed daily numbers of tests per million (1000*DTC; JHU datasets [27] published on May 26, 2022). Red lines shows the calculated daily tests per case ratio TC=1000*DTC/DCC.
The daily numbers of tests per capita in mainland China was constant in 2022 and lower than in Hong Kong (compare solid and dashed black lines in Figure 6). Due to much lower number of cases, the test per case ratio TC was much higher in mainland China (compare red solid and dashed lines in Figure 6). Even after starting the new wave in February 2022, the TC values in China did not drop under 500 (see the solid red line). This fact allowed controlling the pandemic. The daily number of new cases per million were lower than 20 in China (see the blue solid line).
New Zealand gives us examples of a synchronous increase in the number of tests with an increase in the number of new cases (compare magenta and blue curves in Figure 7 for March and August 2020, and for August 2021). This policy allowed the tests to case ratio to be very high and the epidemic to be completely controlled (DCC values were less than 15 (see the blue line) and DDC figures less than 0.025 (the black curve)). In October 2021 a new wave started (see the blue line), but the testing level was not increased accordingly (the magenta line). As a result the tests per case ratio TC the ratio fell to values of less than 200 (the brown curve), causing increases in numbers of cases and deaths. A further decline in the TC values after February 2022 caused a record high number of cases and deaths (see blue and black lines in Figure 7). It must be noted that the percentage of vaccinations VC (the green line) was already close to its saturation level. The positive effect of vaccination can be seen only in the reduction of the case fatality risk (in comparison with 2020, see the red line).
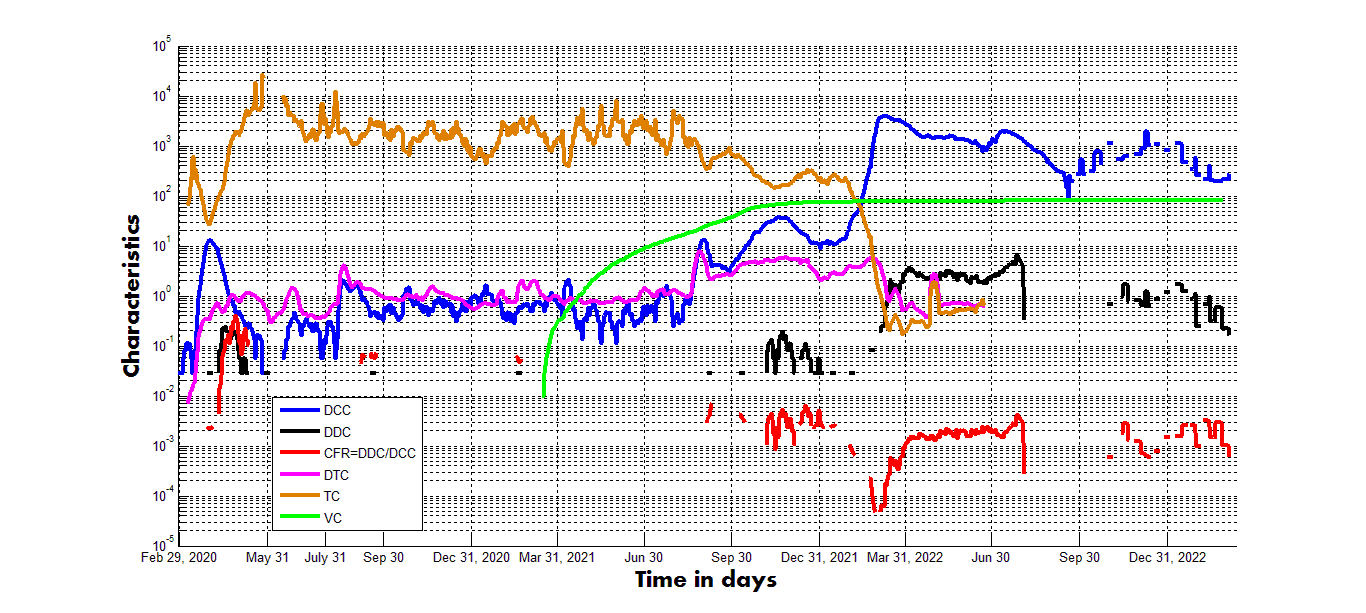
Figure 7. Pandemic dynamics, testing and vaccination levels in New Zealand in 2020-2022. The lines represent the smoothed daily numbers of new cases DCC per million (blue), the smoothed daily numbers of deaths DDC per million (black), smoothed daily numbers of tests per thousand DTC (magenta), and numbers of fully vaccinated people per hundred VC according to JHU datasets [27] published on March 9, 2023. The red curve represents calculated values of the case fatality risk CFR=DDC/DCC, the brown one – the calculated tests per case ratio TC=1000*DTC/DCC.
To have more evidences that the increase of the daily tests per case ratio diminishes the numbers of cases, we have applied the non-linear regression (1) to the pandemic characteristics in Europe, Africa and some other countries listed in [20,63]. The figures correspond to the same day – February 1, 2022 - and were extracted from the JHU tables [27] (version corresponding to February 6, 2022). The results of calculations are shown in Table 3 and Figure 8. For Europe and complete dataset listed in [20] the non-linear correlation (1) is supported at the confidence level 0.025 (see first two rows in Table 3 and blue lines in Figure 8). In the case of Africa, the confidence level is even higher than 0.001.
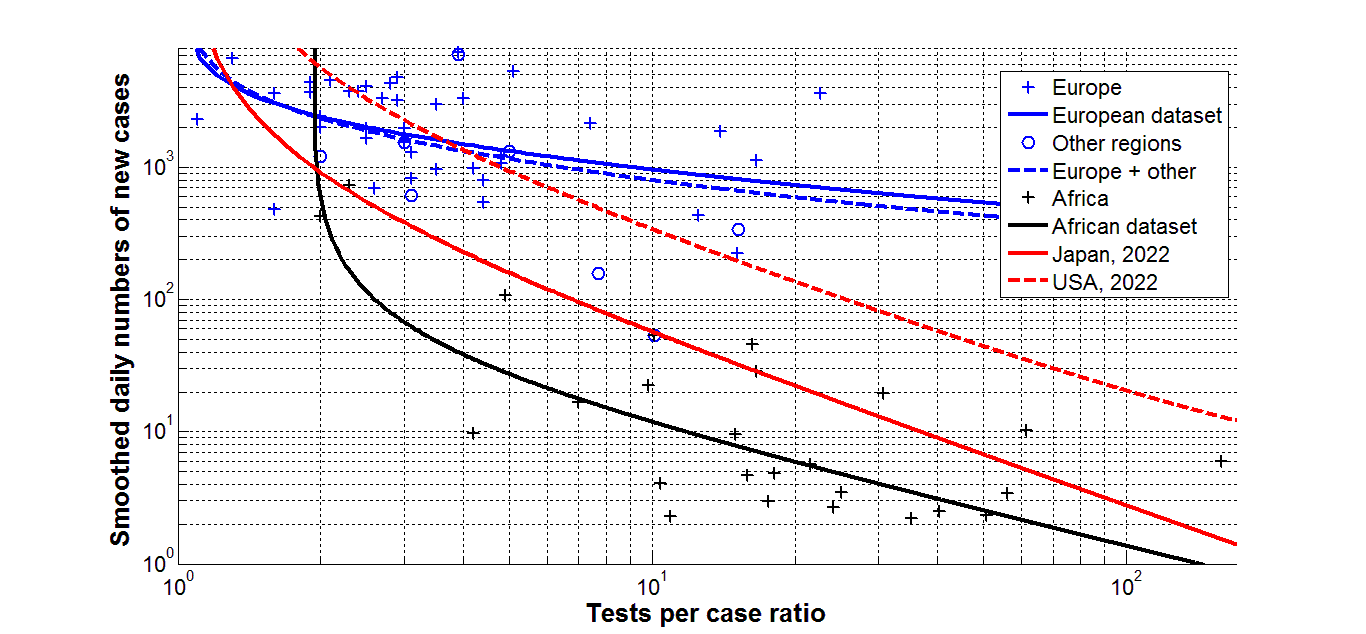
Figure 8. Daily number of new cases per million DCC versus tests per case ratio in European, African, and some other countries as of February 1, 2022. ”Crosses” represent the JHU data [27] for Europe (blue, [20]) and Africa (black, [63]); blue “circles” – other countries listed in [20]. The results of non-linear regression (according to eq. (1) and Table 3) are shown by best fitting lines (the solid blue one for Europe, the dashed blue - for Europe and some other countries listed in [20], the black - for African countries). Best fitting lines for DCC values in 2022 (according to Table 2) are shown in red (solid for Japan (eq. (3)) and dashed for USA).
|
Region, dataset |
Number of observations
n |
Correlation coefficient
r |
Optimal values of parameter a
in eq. (1) |
Optimal values of parameter b
in eq. (1) |
Optimal values of parameter c
in eq. (1) |
Optimal values of parameter γ
in eq. (1)
|
Experimental value of the Fisher function, F
|
Critical value of Fisher function Fc(1,n-2) for the confidence level 0.025
|
F/Fc |
|
Europe, [24] |
39 |
-0.3842
|
219 |
2196.0 |
1.0 |
-0.4944 |
6.407 |
5.50 |
1.16 |
|
Europe and others, [24] |
47 |
-0.4541 |
214 |
2126.6 |
1.0 |
-0.5874 |
11.691 |
5.43 |
2.15 |
|
Africa, [35] |
29 |
-0.7479
|
0 |
72.864 |
1.91 |
-0.8664 |
34.278 |
5.65
|
6.07 |
The best fitting lines shown in Figure 8 support the conclusion that the daily number of cases per capita reduces with the increase of the daily tests per case ratio in Europe and some other countries listed in [20] (see blue lines). This trend is even more evident in Africa (see the black line), where the TC values were in many cases higher than in European countries (compare black and blue “crosses” in Figure 8). To compare with the daily numbers of new cases, the best fitting lines for Japan and USA in 2022 are shown by red solid and dashed lines, respectively. The corresponding optimal values of parameters were taken from Table 2. In particular, for Japan the best fitting non-linear equation can be written as follows:
DCC = 918.3058 / (TC-1)1.2622 (3)
Figure 8 demonstrates that the daily number of cases in Africa can be approximately 5 times lower than in Japan and 30 times lower than in USA at the same level of tests per case ratio. As of May 15, 2022 the accumulated numbers of COVID-19 cases per million in Africa (8,584), Japan (66,400) and USA (247,625), [27], follow these proportions. Very low relative level of infections in Africa is probably connected with the younger age of population. The rather strong correlations between numbers of COVID-19 cases and deaths per capita versus the median age of populations were revealed in [25,56].
Positive values of parameter a in eq. (1) show that new cases will appear even at very high testing levels, since DCC tends to a as TC tends to infinity (at negative values of γ). For example, in 2022 the average daily number of new cases per million in USA cannot be less than 3.27 even at very high testing level (see the last row of Table 2). The estimation for Japan is more optimistic. Eq. (3) demonstrates that in 2022 the numbers of new cases in Japan could be reduced to zero at very high testing levels. For example, if the test per case ratio exceeds 500, the average daily number of new cases per million in Japan will be less than 0.36. This testing level was registered in 2021 with the corresponding number of daily deaths around 0.01 per million (Figure 4). The increase of the tests per case ratio needs additional resources, nevertheless, it could be an effective tool to control any epidemic and the endemic stage of SARS-CoV-2 disease [64]. For this purpose the self testing systems can be accumulated during the periods between epidemic waves and then be used immediately after the beginning of new waves (in order to reduce the load on laboratories).
Conclusions
The COVID-19 pandemic dynamics in 2020, 2021, and 2022 has been compared for Japan, Ukraine, USA, Hong Kong, mainland China, New Zealand, European and African countries. Some seasonal correlations for Japan were revealed. The numbers of cases and deaths in this countries in 2022 and 2023 were higher than in 2021 despite a very high level of vaccinations. The decreasing trend in global case fatality risk demonstrates reducing the severity of SARS-COV-2 disease (i.e., the lower probability to die for persons tested positive). Nevertheless, in Japan and New Zealand, growing numbers of new infections in 2022 and 2023 increased the general probability to die (i.e., the numbers of death per capita). The reasons for this phenomenon require further research.
Non-linear correlation analysis has revealed the close links between the smoothed daily numbers of new cases and the tests per case ratio. To decrease the number of new cases and control an epidemic effectively, the tests per case ratio has to be high enough and the numbers of test has to be increased accordingly and simultaneously with the increase of the numbers of new cases. The influence of other methods of reducing the number of cases (e.g., lockdowns) require further research.
Ethical Approval Statement
No human or animal experiments were used in the study. The statistical information used is public and available on the Internet.
Acknowledgements
The study was supported by INI-LMS Solidarity Programme at the University of Warwick, UK.
The author is grateful to Hiroshi Nishiura, Robin Thompson, Matt Keeling, Paul Brown, and Oleksii Rodionov for their support and providing very useful information.
Some of presented results are available in author’s preprints [24,26,65]. A shortened version of [65] was used in [66] without author’s permission and unrealistic “receiving” dates.
Author Statements
The author declares no conflict of interest.
References
2. Cao S, Gan Y, Wang C, Bachmann M, Wei S, Gong J, et al. Post-lockdown SARS-CoV-2 nucleic acid screening in nearly ten million residents of Wuhan, China. Nature Communications. 2020 Nov 20;11(1):1-7.
3. Aleta A, Martín-Corral D, Pastore Y Piontti A, Ajelli M, Litvinova M, Chinazzi M, et al. Modelling the impact of testing, contact tracing and household quarantine on second waves of COVID-19. Nat Hum Behav. 2020 Sep;4(9):964-71.
4. Kucharski AJ, Klepac P, Conlan AJK, Kissler SM, Tang ML, Fry H, et al. Effectiveness of isolation, testing, contact tracing, and physical distancing on reducing transmission of SARS-CoV-2 in different settings: a mathematical modelling study. Lancet Infect Dis. 2020 Oct;20(10):1151-60.
5. Smith LE, Potts HWW, Amlôt R, Fear NT, Michie S, Rubin GJ. Adherence to the test, trace, and isolate system in the UK: results from 37 nationally representative surveys. BMJ. 2021 Mar 31;372:n608.
6. Iacobucci G. Covid-19: Mass population testing is rolled out in Liverpool. BMJ. 2020 Nov 3;371:m4268.
7. Oshitani H. Cluster-based approach to coronavirus disease 2019 (COVID-19) response in Japan—February–April 2020. Jpn J Infect Dis. 2020 Nov 30;73(6):491-3.
8. Ondoa P, Kebede Y, Loembe MM, Bhiman JN, Tessema SK, Sow A, et al. COVID-19 testing in Africa: lessons learnt. Lancet Microbe. 2020 Jul;1(3):e103-e104.
9. Grassly NC, Pons-Salort M, Parker EPK, White PJ, Ferguson NM; Imperial College COVID-19 Response Team. Comparison of molecular testing strategies for COVID-19 control: a mathematical modelling study. Lancet Infect Dis. 2020 Dec;20(12):1381-89.
10. Godlee F. Covid-19: Testing Testing. BMJ. 2020;369:m1918.
11. Raffle AE, Pollock AM, Harding-Edgar L. Covid-19 mass testing programmes. BMJ. 2020 Aug 20;370:m3262.
12. Voice of America (VOA). Slovakia's Second Round of Coronavirus Tests Draws Large Crowds. https://www.voanews.com/covid-19-pandemic/slovakias-second-round-coronavirus-tests-draws-large-crowds
13. Furuse Y, Ko YK, Ninomiya K, Suzuki M, Oshitani H. Relationship of Test Positivity Rates with COVID-19 Epidemic Dynamics. Int J Environ Res Public Health. 2021 Apr 27;18(9):4655.
14. Gharouni A, Abdelmalek FM, Earn DJD, Dushoff J, Bolker BM. Testing and Isolation Efficacy: Insights from a Simple Epidemic Model. Bull Math Biol. 2022 May 13;84(6):66.
15. Rossman H, Shilo S, Meir T, Gorfine M, Shalit U, Segal E. COVID-19 dynamics after a national immunization program in Israel. Nat Med. 2021 Jun;27(6):1055-61.
16. Nesteruk I. Influence of Possible Natural and Artificial Collective Immunity on New COVID-19 Pandemic Waves in Ukraine and Israel. Explor Res Hypothesis Med. 2022;7(1):8-18.
17. Nesteruk I. The real COVID-19 pandemic dynamics in Qatar in 2021: simulations, predictions and verifications of the SIR model. Semina: Ciências Exatas e Tecnológicas. 2021 Sep 6;42(1Supl):55-62.
18. Nesteruk I, Rodionov O. Comparison of the COVID-19 Pandemic Waves in 2020 and 2021. Int J Cancer Res Ther. 2022;7(1):24-47.
19. Nesteruk I, Rodionov O. New COVID-19 Pandemic Waves Caused by Omicron and Efficiency of Vaccinations. J Biomed Res Environ Sci. 2022 Jan 31;3(1):114-39.
20. Nesteruk I, Rodionov O. Omicron Waves of the COVID-19 Pandemic and Efficacy of Vaccinations and Testing. J Biomed Res Environ Sci. 2022 May 24;3(5):588-94.
21. Nesteruk I, Rodionov O. Impact of Vaccination and Testing Levels on the Dynamics of the COVID-19 Pandemic and its Cessation. J Biomed Res Environ Sci. 2021 Nov 23;2(11):1141-7.
22. Mohammadi A, Meniailov I, Bazilevych K, Yakovlev S, Chumachenko D. Comparative study of linear regression and SIR models of COVID-19 propagation in Ukraine before vaccination. Radioelectronic and Computer Systems. 2021 Oct 5(3):5-18.
23. Nesteruk I, Rodionov O. The COVID-19 pandemic in rich and poor countries. Research Square. Posted December 7, 2022. https://doi.org/10.21203/rs.3.rs-2348206/v1
24. Nesteruk I. Vaccination and testing as a means of ending the COVID-19 pandemic: comparative and statistical analysis. MedRxiv. 2022 Jun 21:2022-06.
25. Nesteruk I. Trends of the COVID-19 dynamics in 2022 and 2023 vs. the population age, testing and vaccination levels. Front Big Data. 2024 Jan 10;6:1355080.
26. Nesteruk I. Efficacy of vaccinations in the COVID-19 pandemic. Research gate. 2024 Jan. DOI:10.13140/RG.2.2.11465.52327
27. COVID-19 Data Repository by the Center for Systems Science and Engineering (CSSE) at Johns Hopkins University (JHU). https://github.com/owid/covid-19-data/tree/master/public/data
28. Nesteruk I, Rodionov O, Nikitin AV, Walczak S. Influences of seasonal and demographic factors on the COVID-19 pandemic dynamics. EAI Endorsed Transactions on Bioengineering and Bioinformatics. 2021 Dec 8;1(4):e2.
29. Nesteruk I. Should we ignore SARS-CoV-2 disease? Epidemiol Infect. 2024 Mar 20;152:e57.
30. Lazarus JV, Romero D, Kopka CJ, Karim SA, Abu-Raddad LJ, Almeida G, et al. A multinational Delphi consensus to end the COVID-19 public health threat. Nature. 2022 Nov;611(7935):332-45.
31. Fraser C, Riley S, Anderson RM, Ferguson NM. Factors that make an infectious disease outbreak controllable. Proc Natl Acad Sci U S A. 2004 Apr 20;101(16):6146-51.
32. Eames KT, Keeling MJ. Contact tracing and disease control. Proc Biol Sci. 2003 Dec 22;270(1533):2565-71.
33. Ferguson NM, Laydon D, Nedjati-Gilani G, Imai N, Ainslie K, Baguelin M, et al. Report 9: Impact of non-pharmaceutical interventions (NPIs) to reduce COVID19 mortality and healthcare demand. London: Imperial College London; 2020 Mar 16.
34. Walport MJ; Professor Sir Mark Walport on behalf of the Expert Working Group for the Royal Society's programme on non-pharmaceutical interventions. Executive Summary to the Royal Society report "COVID-19: examining the effectiveness of non-pharmaceutical interventions". Philos Trans A Math Phys Eng Sci. 2023 Oct 9;381(2257):20230211.
35. Casella F. Can the COVID-19 epidemic be controlled on the basis of daily test reports?. IEEE Control Systems Letters. 2020 Jul 17;5(3):1079-84.
36. McCaw JM, Glass K, Mercer GN, McVernon J. Pandemic controllability: a concept to guide a proportionate and flexible operational response to future influenza pandemics. J Public Health (Oxf). 2014 Mar;36(1):5-12.
37. Anderson R, Donnelly C, Hollingsworth D, Keeling M, Vegvari C, Baggaley R, et al. Reproduction number (R) and growth rate (r) of the COVID-19 epidemic in the UK: methods of estimation, data sources, causes of heterogeneity, and use as a guide in policy formulation. The Royal Society. 2020 Aug 24;2020.
38. Ferretti L, Wymant C, Kendall M, Zhao L, Nurtay A, Abeler-Dörner L, et al. Quantifying SARS-CoV-2 transmission suggests epidemic control with digital contact tracing. Science. 2020 May 8;368(6491):eabb6936.
39. Grantz KH, Lee EC, D'Agostino McGowan L, Lee KH, Metcalf CJE, Gurley ES, et al. Maximizing and evaluating the impact of test-trace-isolate programs: A modeling study. PLoS Med. 2021 Apr 30;18(4):e1003585.
40. Pates R, Ferragut A, Pivo E, You P, Paganini F, Mallada E. Respect the unstable: delays and saturation in contact tracing for disease control. SIAM Journal on Control and Optimization. 2022;60(2):S196-220.
41. Alamo T, G Reina D, Millán Gata P, Preciado VM, Giordano G. Data-driven methods for present and future pandemics: Monitoring, modelling and managing. Annu Rev Control. 2021;52:448-464.
42. Sun K, Wang W, Gao L, Wang Y, Luo K, Ren L, et al. Transmission heterogeneities, kinetics, and controllability of SARS-CoV-2. Science. 2021 Jan 15;371(6526):eabe2424.
43. Ali ST, Wang L, Lau EHY, Xu XK, Du Z, Wu Y, et al. Serial interval of SARS-CoV-2 was shortened over time by nonpharmaceutical interventions. Science. 2020 Aug 28;369(6507):1106-9.
44. Parag KV, Obolski U. Risk averse reproduction numbers improve resurgence detection. PLoS Comput Biol. 2023 Jul 20;19(7):e1011332.
45. Hu J, Qi G, Yu X, Xu L. Modeling and staged assessments of the controllability of spread for repeated outbreaks of COVID-19. Nonlinear Dyn. 2021;106(2):1411-24.
46. Roberts MG, Nishiura H. Early estimation of the reproduction number in the presence of imported cases: pandemic influenza H1N1-2009 in New Zealand. PLoS One. 2011;6(5):e17835.
47. Morris DH, Rossine FW, Plotkin JB, Levin SA. Optimal, near-optimal, and robust epidemic control. Communications Physics. 2021 Apr 20;4(1):78.
48. Parag KV. How to measure the controllability of an infectious disease?. medRxiv. 2023 Oct 10:2023-10.
49. Draper NR, Smith H. Applied regression analysis. John Wiley & Sons; 1998 Apr 23.
50. Guedes AR, Oliveira MS, Tavares BM, Luna-Muschi A, Lazari CDS, Montal AC, et al. Reinfection rate in a cohort of healthcare workers over 2 years of the COVID-19 pandemic. Sci Rep. 2023 Jan 13;13(1):712.
51. Flacco ME, Soldato G, Acuti Martellucci C, Di Martino G, Carota R, Caponetti A, et al. Risk of SARS-CoV-2 Reinfection 18 Months After Primary Infection: Population-Level Observational Study. Front Public Health. 2022 May 2;10:884121.
52. WHO. Tracking SARS-CoV-2 variants. https://www.who.int/activities/tracking-SARS-CoV-2-variants. Retrieved November 30, 2023.
53. Wikipedia. Variants of SARS-CoV-2. https://en.wikipedia.org/wiki/Variants_of_SARS-CoV-2. Retrieved September 13, 2023.
54. https://www.cdc.gov/coronavirus/2019-ncov/variants/variant-classifications.html. Retrieved September 13, 2023.
55. Wikipedia. Zero-COVID. https://en.wikipedia.org/wiki/Zero-COVID. Retrieved November 23, 2023.
56. Nesteruk I, Keeling M. Population age as a key factor in the COVID-19 pandemic dynamics. medRxiv. 2023:2023-11.
57. Statsenko Y, Al Zahmi F, Habuza T, Almansoori TM, Smetanina D, Simiyu GL, et al. Impact of Age and Sex on COVID-19 Severity Assessed From Radiologic and Clinical Findings. Front Cell Infect Microbiol. 2022 Feb 25;11:777070.
58. Davies NG, Klepac P, Liu Y, Prem K, Jit M; CMMID COVID-19 working group; Eggo RM. Age-dependent effects in the transmission and control of COVID-19 epidemics. Nat Med. 2020 Aug;26(8):1205-11.
59. Fowlkes AL, Yoon SK, Lutrick K, Gwynn L, Burns J, Grant L, et al. Effectiveness of 2-Dose BNT162b2 (Pfizer BioNTech) mRNA Vaccine in Preventing SARS-CoV-2 Infection Among Children Aged 5-11 Years and Adolescents Aged 12-15 Years - PROTECT Cohort, July 2021-February 2022. MMWR Morb Mortal Wkly Rep. 2022 Mar 18;71(11):422-28.
60. Shang W, Kang L, Cao G, Wang Y, Gao P, Liu J, et al. Percentage of Asymptomatic Infections among SARS-CoV-2 Omicron Variant-Positive Individuals: A Systematic Review and Meta-Analysis. Vaccines (Basel). 2022 Jun 30;10(7):1049.
61. Schreiber PW, Scheier T, Wolfensberger A, Saleschus D, Vazquez M, Kouyos R, et al. Parallel dynamics in the yield of universal SARS-CoV-2 admission screening and population incidence. Sci Rep. 2023 May 5;13(1):7296.
62. Nesteruk I. Visible and real sizes of new COVID-19 pandemic waves in Ukraine. Innovative Biosystems and Bioengineering. 2021 Aug 12;5(2):85-96.
63. Nesteruk I, Rodionov O. Coronavirus and incomes: the COVID-19 pandemic dynamics in Africa in February 2022. MedRxiv. 2022 Apr 26:2022-04.
64. Nesteruk I. Endemic characteristics of SARS-CoV-2 infection. Sci Rep. 2023 Sep 8;13(1):14841.
65. Nesteruk I. The COVID-19 pandemic waves: comparative and statistical analysis of their dynamics. 13 June 2023, Research Square. https://doi.org/10.21203/rs.3.rs-3048578/v1.
66. Nesteruk I. The COVID-19 Pandemic Waves: Comparative and Statistical Analysis of Their Dynamics. Clinical Medical Reviews and Reports. 2023;5(3):1-6.