Abstract
Chronic kidney disease (CKD) affects 10% of the population worldwide. It often leads to poor quality of life, especially among people suffering from end-stage CKD. Detection and treatment of the renal disorders at an early stage can help in postponing of end-stage disease as well as its treatment options, such as renal transplant and dialysis. The current routine measurement of glomerular filtration rate (GFR) includes methods that are expensive, cumbersome, time-consuming, inaccurate, often inconvenient and invasive for the patients. Non-invasive diagnostic techniques can help to overcome many of these drawbacks. This paper reviews the progress made in the field of transcutaneous GFR measurement as a way for a simpler, non-invasive, cheaper, and patient-friendly assessment of renal function. We have discussed the various markers designed in combination with different measurement devices for the measurement of GFR. Also, we have compared the different kinetic models used to study the marker’s clearance from the plasma; which ultimately helps in calculating the GFR. Most of these techniques have been limited to pre-clinical studies until now, with promising results for their transition into clinical use in the near future.
Keywords
Transcutaneous, Transdermal, Non-invasive, Clearance kinetics, GFR markers
Introduction
The kidneys are responsible for excreting out xenobiotics and metabolites produced within the body through the urine. Therefore, healthy functioning of the kidneys is vital for a healthy being. The formation of urine takes place by three main processes: filtration of plasma via glomeruli, reabsorption and secretion by the tubular cells. Assessment of these three processes can help in evaluating kidney function. Out of the three functions, measurement of glomerular filtration rate (GFR) is by far the most often used renal diagnostic technique. A common way of evaluating GFR is based on the principle of clearance of a marker. An ideal GFR marker should be completely filtered by the glomeruli, should neither be secreted, nor reabsorbed by the renal tubular cells, and should not follow extrarenal clearance pathways. Clearance is expressed as the volume of plasma from which a marker is completely cleared per unit of time. While the endogenous markers such as serum creatinine are inaccurate due to age, gender, muscle mass, body weight and other anthropometric factors, thorough research has been done in search for exogenous GFR markers. This paper reviews the development of these GFR markers and their use in transcutaneous measurements as a way of non-invasive renal assessment [1,2].
Many electronic sensors and devices have been in use for the estimation of the rate of removal of the marker molecules from the body. Most of the devices that detect the emission from the marker have a photodiode or a photomultiplier as the sensing component. The tracers are excited by light sources like LEDs/lasers and the resultant emission is measured. Other radioactive and current detectors are also documented that have the potential to estimate the marker concentration. They differ from one another depending on the dye used and the signal processing involved. Some devices have a block electronic base with a flexible sensor which goes on to the skin while some have been completely miniaturized for better usability.
After the injection of an ideal GFR marker, its concentration in the plasma reaches a peak, followed by an exponential decay due to its diffusion from the plasma into the extracellular space. During the diffusion into the extracellular space, equilibrium between the extra- and the intra-vascular fluid is reached while the marker is already being filtered by the kidneys. As later on, the GFR marker is filtered and excreted by the kidneys, a net diffusion from the extra-vascular space to the intra-vascular space occurs [3]. The clearance of an ideal GFR marker can be calculated by assessing its rate of disappearance from the plasma according to compartmental pharmacokinetic analysis [4]. The distribution of the marker in different physiological compartments influences its disappearance curve and only the choice of an appropriate pharmacokinetic model can provide a correct mathematical description of the data for the estimation of the GFR from the plasma clearance of the tracer.
GFR Markers
The very initial transcutaneous evaluations of renal function involved the use of radiopharmaceuticals such as technetium-99m diethylene triamine pentaacetic acid (99mTc-DTPA), using cadmium telluride (CdTe) crystal detectors. The gamma irradiation of DTPA allows the study of its plasma disappearance curve, and hence the calculation of the corresponding terminal elimination rate constant (α2). The value of α2 is comparable to the fractional turnover of the extracellular fluid volume (ECV) by the kidneys. The plasma disappearance of DTPA hence reflects the renal function similar to the GFR ‘gold standard’ i.e., inulin [5,6]. However, despite the near- ‘gold standard’ results achieved with the help of radiopharmaceuticals, there are still reservations about their clinical routine usedue to difficulties in their handling and routine administration of radioactivity [7].
Reverse iontophoresis (RI) is used as a transdermal technique for measuring GFR using traditional markers such as urea and iohexol. RI involves application of low-intensity current (<1mA) over the skin surface which increases the transport of the marker across the membrane. Initially, subdermal urea (which is in equilibrium with plasma urea, and hence reflects the plasma concentration) was collected using a transdermal patch over a period of 3-5 hours, which was then extracted and analyzed using diacetylmonoxime method of urea assay. Later, iohexol also proved as a successful transcutaneous marker for RI measurement. Intravenous (IV) bolus injection of iohexol is monitored over 6 hours, and the sample, which is collected by the transdermal patch, is analyzed using UV-HPLC [8,9]. Nevertheless, these methods remain time-consuming and call for a much rapid detection method.
Development of fluorescent GFR markers formed a new, faster, and non-invasive technique for assessing renal function. Dorshow et al. are one of the pioneers in this field, suggesting two ways of designing exogenous fluorescent GFR markers: (1) Modifying the already known renal-clearable exogenous compounds to make them more fluorescent, and (2) modifying the structure of the fluorescent lipophilic dyes to get its hydrophilic, anionic version, which therefore follows a renal clearance path [10]. For the first way, majorly poor emitters such as lanthanide metals (europium (Eu3+) and indium (In3+)) have been complexed with ligands such as DTPA-monoamide, to get a higher fluorescence through fluorescence resonance energy transfer (FRET) [10]. Carbostyril-DTPA-Eu is one such complex. The clearance and the extracellular fluid (ECF) distribution of this chelate is comparable to that of 125I-iothalamate and 99mTc-DTPA [11]. The second way has been studied in more detail, mostly with pyrazine-based-scaffolds. For instance, addition of electron-withdrawing groups such as carboxylic acid at 2,5 position, and electron-donating group such as amine at 3,6 position renders a large Stoke’s shift (~100 nm) [10]. This can then be further modified to get desired optical properties. For example, alkylation of the amine group leads to a bathochromic shift of ~50 nm. Also, conversion of carboxylic acid groups to carboxamide derivatives enhances the intra-molecular charge transfer. Moreover, going towards longer wavelengths for absorption and emission wavelength ensures better tissue penetration as it helps to get rid of auto-fluorescence [12,13]. MB-102 is one such example of a modified-pyrazine. Owing to its small size, it distributes within the ECF and is exclusively cleared through glomerular filtration with no secretion or reabsorption by the renal cells. It absorbs at 445 nm and emits at 560 nm. During pre-clinical studies and human clinical trials, MB-102 showed results comparable to iohexol with no adverse effects reported till now [14-18].
The small size of pyrazines allows its distribution in the ECF, thereby leading to longer clearance times. For rapid clearance, various hydrophilic substituents are attached to the pyrazine nucleus, such as moderate-sized poly ethylene glycol (PEG), polyhydroxy alkyl groups, or both [19,20].
Another approach for generating fluorescent GFR probes is through tagging already known GFR markers with a fluorescent dye. Inulin, todate, is considered as the ‘gold standard’ for GFR measurement. The extraction and purification of inulin make it very expensive. Therefore, fluorescein isothiocyanate-conjugated inulin (FITC-inulin) was developed, which reduces the dose of inulin required to be injected for detection. Nevertheless, FITC-inulin is poorly soluble and requires prior heating and dialysis before use, thus making the whole process cumbersome. Sinistrin is a β-D-fructan version of inulin, which shows an activity similar to inulin and comes with an added advantage of being water-soluble, owing to its branching at carbon 6 position (as opposed to a relatively linear structure of inulin) [21-23]. FITC-Sinistrin (FITC-S) is one of the widely used fluorescent GFR marker todate in combination with a transcutaneous measurement. It is also cleared completely via renal filtration with no secretion or reabsorption by the tubular cells. When excited in the blue region, FITC-S emits in the green region of the visible spectrum, roughly around 516 nm. Transdermal read-out of FITC-sinistrin has been widely used in biomedical research to assess kidney function [24]. Nevertheless, sinistrin remains an expensive source of GFR marker, and as it is a natural product it comes with a poor availability and a high batch-to-batch variability.
The search for a cheaper and more easily available GFR marker led to the synthesis of 2-hydroxylpropyl-cyclodextrins (HPCDs)-based fluorescent probes. HPCDs are highly hydrophilic, with very low plasma protein binding (PPB). Three different types of cyclodextrins, i.e., HPαCD, HPβCD, and HPγCD were conjugated to FITC, fluorescein, and XITC (a decarboxylated FITC dye). All these dye-cyclodextrin combinations have their absorption peak in the blue region and emission in the green region, similar to the dyes themselves. Therefore, the addition of cyclodextrin does not interfere with the dye’s fluorescence. These potential GFR markers were compared for their physiochemical and optical properties, aggregation analysis, PPB, cell-toxicity, stability, clearance half-life, bio-metabolism, and urinary recovery of the markers. Out of all the markers tested, FITC-HPβCD proved to be most efficient, with nearly 99% urinary recovery within 12 hours [25].
More recently, near-infrared (NIR) dyes are being explored as an improvement to the previous dyes. These dyes offer an added advantage of reduced signal attenuation, as there are fewer biological molecules that absorb light in the NIR range. One such research involved study of HPβCD tagged to anionic, cationic and zwitterionic variants of the heptamethine cyanine dye (Figure 1). While anionic and cationic dyes suffer from inherent problems of being secreted/reabsorbed by the tubular cells in the kidney and a high PPB, zwitterionic cyanine dyes (AAZWCY and ABZWCY) bound to HPβCD proved exceptional, even better than some ‘gold standard’ markers in terms of PPB. They have a high urinary recovery, with over 97% recovery within 9 hours after injection. The ABZWCY-HPβCD and AAZWCY-HPβCD fluorescent probes absorb at around 704 nm and emit at around 790 nm in plasma, with a Stoke’s shift of roughly 86 nm. This allows deeper tissue penetration and easier transcutaneous measurement [2,26]. Similarly, Cy7.5 dye is used to label carboxymethyl inulin (CMI) to image the NIR-GFR marker using a transcutaneous pulse dye densitometer (TPDD) [27].
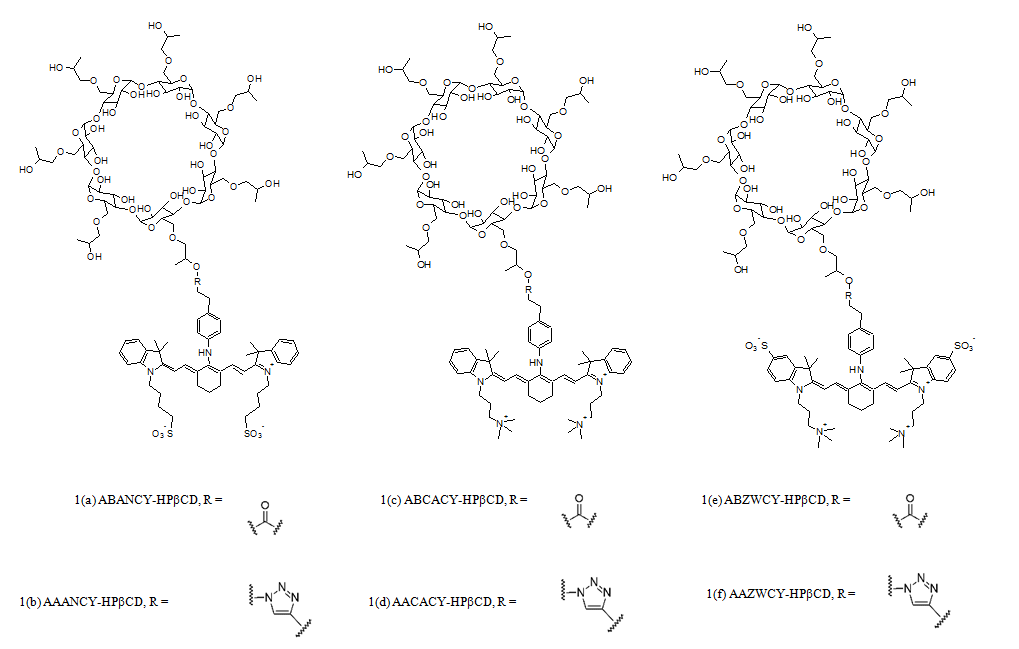
Figure 1: Structure of the cyanine dyes conjugated to HPβCD (Structure adapted from Huang et al.) [2].
Non-Invasive Measurement Techniques
Owing to the various advantages of non-invasive transcutaneous measurements over the conventional techniques, a wide range of electronic and electrical techniques can estimate the elimination of GFR markers by calculating the amount of marker left in the body at any given time. Early in the 90’s, Rabito et al. presented a renal function monitoring device- ‘Ambulatory renal monitor’ [6,28]. The monitor consists of a detector, batteries and a data logger. A circular cadmium telluride detector is placed in the centre of a collimator shaped like a hemicylinder. The hemi shield is covered with a lead-vinyl sheet which is long enough to surround the arm, thus resembling a pressure cuff. The radioactive agent used with this device is 99mTc-DTPA. The calculation using the information from the data logger is based on a one compartment model.
Dorshow et al. describe a method of GFR estimation based on using optical probes for fluorescence detection. A bifurcated silica optical fiber is used to illuminate and detect the marker. The common end of this fiber is placed near the ear lobe of a rat. One end of this fiber is connected to the laser for excitation while the other end is connected to a collimating lens eventually sending the light to a photomultiplier. The resultant signal is amplified and the digital data is used by the software for further analysis. A pyrazine-based compound having an excitation wavelength of 449nm and an emission wavelength of 559 nm is injected. This agent distributes from vasculature into the interstitial space; hence, a two-compartment model is used for analysis of the data obtained [29].
Another prototype medical device with fiber probes was developed and tested by MediBeacon Inc. The common end of each of the four bifurcated fibers is placed on four different sites on the body of the subject- sternum, forehead, arm and trunk [30]. One leg from each of the bifurcated fibers is fed by a 4-way split LED source, which excites at a wavelength of 450 nm. The light emitted as a result of exciting the fluorescent marker is collected by the common end and travels up via the second leg of the bifurcated end into a filtering system which is eventually fed into photomultipliers. A lock-in amplifier is used to amplify the signal at a frequency that is in accordance with the source frequency. The analysis is done by incorporating a two-compartment model. The fluorescent agent, also developed by MediBeacon Inc., is MB-102.
TPDD (transcutaneous pulse dye densitometer) is another transcutaneous technique, which uses NIR light to measure the injected marker. The main concept is similar to that of a pulse-oximeter, where the arterial concentration of the dye is calculated [27]. Two wavelengths that correspond to the highest and lowest light absorption of the dye are used for illumination. This method measures the light transmission which varies as a result of heartbeats (arterial pulsation). It calculates the light transmission at the peaks and troughs at the two different wavelengths. One of the main advantages for this method is the use of dyes, which are in the NIR range as it facilitates deeper penetration into the tissues. The dye used is Cy7.5-inulin conjugate. The clearance of this marker is calculated as per the two-compartment model.
The majority of the described methods for GFR estimation are based on bolus clearances. Another gold standard for injecting the marker is a technique known as constant infusion clearance (CIC). In this method, it is required to know when the steady state marker concentration in the distribution volume is reached. To reach such a steady state; a loading dose is given along with subsequent maintenance doses. A feedback-controlled mechanism is developed to manage the infusion of the maintenance dose based on the response from the prior infusions [31]. Different experiments were performed to conclude that the shortest time to reach a steady state is when the maximum concentration is maintained after the initial dose. Thus, a reference dose is set which is dependent on the response from the initial dose. A proportional controller is designed on a host PC which signals to release more marker into the vascular system. The fluorescent agent used for this type of set-up is FITC-S.
The use of LEDs for excitation of a biological marker along with a photodiode to detect its fluorescence has been extensively researched over the last decade. Such a device is free from optical probes and large mechanical parts. One such assembly is described by Schreiber et al. and consists of a single photodiode sandwiched between two LEDs packed into a miniaturized device, [32,33] where the light sources have an emission peak at 470 nm. Multiple layers of filters are incorporated in front of the photodiode to reach a maximum sensitivity of 525 nm. Amplification and 16-bit digitization of the data is performed on the signal received from the photodiode which is stored inside a memory unit and is subsequently transferred on to a PC. The data from the device is recorded for a baseline (without dye) after which FITC-S is injected intravenously. A modified version of this device has been developed using NIR LEDs, which uses ABZWCY-HPβCD that has an emission maximum at 790 nm [26].
When we talk about non-invasive techniques, using optical electronics is not the only way to monitor markers. Reverse Iontophoresis (RI) is a technique that involves administering a transdermal marker while maintaining a voltage difference across the skin to facilitate the transport of marker across the skin. Having a wide range of applications in detecting various drugs and clinical parameters like glucose, the concept of RI can also be used to monitor the renal marker iohexol [8]. In vivo experiments were done on the arm of pediatric subjects. A silver/silver-chloride anode and cathode were placed on the arm and a current of 0.5mA was given for 5 hours. This current induction was started after half hour of injecting iohexol intravenously. The patches were replaced at a regular interval of 2 hours. The cathode patches are analyzed to calculate the extraction flux of the marker using Faraday’s law and finally the elimination rate is estimated. The extraction flux, based on previous studies with lithium, is considered to be proportional to the elimination rate.
Transcutaneous measurements are known to have a significant challenge of overcoming background noises and signals resulting from skin reflection and auto fluorescence. An electronic apparatus put forth by Shmarlouski et al. is based out of two concepts specifically designed to separate the desired and undesired signals: LTDM (lifetime-decomposition measurement) and TCSPC (time-correlated single-photon counting) [34]. The illumination is provided by a diode laser emitting at a wavelength of 485 nm. One end of a measuring unit, the sensor, is placed near the skin while the other end is connected to a flexible fiber bundle. The fiber goes on to supply the light into a photomultiplier, which is responsible for photon counting. The signal coming from the sensor is counted in time intervals which are equal to the duration of the laser excitation. The arrival times of the counted photons are tracked, and their histograms are generated. Each histogram is modeled into three terms corresponding to signal coming from three different parameters – fiber reflection, skin auto fluorescence and fluorescence coming from the GFR marker. The advantage of this technique is that it lowers the concentration of the dye that is needed to be injected into the subject.
Kinetic Models for the Calculation of the GFR
The pharmacokinetic modeling describes the distribution and the elimination of the GFR markers in the body conceptualized as a series of compartments [4].
Plasma clearance is calculated by the formula Clplasma= D/AUC in which D is the dose of the marker and the AUC is the area under the plasma concentration over the time that can be calculated with specific formulas for different pharmacokinetic models.
According to the one-compartment model, the GFR marker is only excreted from the compartment where it is injected into, so the plasma clearance is represented by one exponential function.
In the two-compartment model, the marker is distributed between two compartments consisting of the vascular and the extra-vascular space and it is eliminated from the plasma. This model is described mathematically by the sum of two exponential functions with two elimination rate constants. When three compartments are involved, the mathematical description of the model corresponds to the sum of three exponential functions with three different elimination rate constants [4].
Conventionally, the concentration curve of a filtration marker is described as bi-exponential up to 4 hours, but it can actually consist of three exponentials. The last exponential describes the fractional rate at which the ECF is filtered at the glomerular membrane (GFR) and its rate constant is a very close estimation of GFR normalized on ECV [5].
Thus, the area under the line corresponding to the one exponential function in the one-compartment model is smaller than the one under the real concentration curve, leading to the overestimation of the GFR; hence mathematical corrections need to be applied.
However, a one-compartment characterization is largely employed for GFR measurement in clinics because of the advantage to require less blood samples, simplifying the procedure and the analysis as only the late exponential is characterized [35,36].
Similar to the methods based on blood sampling in which plasma concentrations are plotted versus time, the transcutaneous measurements are monitored over time and an appropriate kinetic model can describe the fit of the curve to the data providing an accurate estimation of the GFR.
Already in the 90's, Rabito et al. described the use of a device that detects the activity of the radiopharmaceutical agent 99mTc-DTPA, placing it on the arm of the patients [6]. 99mTc-DTPA clearance was evaluated by calculating its rate constant as the single slope of the log activity versus time. Fitting the one-compartment model was possible by calculating the rate constant after 15-45 minutes when the tracer reaches the equilibration in the ECV. Placing the detector on a different body area may affect the estimation. For instance, positioning it in the precordial area, where most of the recorded activity derives from the vascular space, would require a two compartment characterization [6].
Further studies regarding the transcutaneous detection of 99mTc-DTPA, elucidate when it is possible to calculate the GFR based only on the use of the terminal elimination rate constant.The clearance of the marker can be expressed as following:
Clearance = Q/ (A/α1 +B/α2) where Q is the dose of the marker and the denominator of the equation represents the area under the marker concentration-time curve. Although the 99mTc-DTPA clearance from the plasma is described by a bi-exponential decay with two rate constants, the distribution phase constant (α1) can be excluded as the value of A/α1 varies a little, especially in diseased patients. Therefore, the terminal elimination rate constant (α2) can be directly expressed as GFR normalized to ECV [5].
FITC-S has been largely used for the transcutaneous measurements of the GFR over the last decades. But when fluorescence intensity is assessed transcutaneously, the elimination kinetics can be only measured as change in a relative emission signal over time and not as absolute tracer concentrations.
In this case, GFR can be estimated from the excretion half-life (t1/2) of the FITC-S by using an empirically derived conversion factor, established by simultaneous measurements of plasma concentrations of FITC-S [32].
The semi empirical conversion factor can be calculated multiplying the mean half-life of the FITC-S and the mean GFR deriving from plasma sampling calculated as D/AUC. When modeled as one-compartment in rats, it resulted in 31.26 ml/100 g body weight (b.w.) [37], and as a two-compartment model in mice, it was equal to 14 616.8 μl/100 g b.w. [32,38,39].
However, the formula for calculating the conversion factor assumes that the ECV/100 g b.w. is comparable in all investigated groups. For instance, the conversion factor may not estimate the ECV uniformly in all mice because of a multitude of factors (e.g., age, sex, hydration status, weight) [40].
Moreover, if a change in ECV occurs (e.g. edema), the distribution time of the marker and the overall measured signal intensity are affected, but it does not influence the final t1/2 [38].
Thereby, the evaluation of GFR based only on the excretion half-life of the marker represents a valid approach for an unbiased analysis.
Concerning the determination of the FITC-S half-life, different kinetic models have been fitted to the transcutaneous data for the analysis of the elimination kinetic curve.
First, it is necessary to offset the background skin signal before the marker injection, then, the beginning of the exponential can be marked, and the t1/2 can be calculated [41].
In Schock-Kusch et al., the transcutaneous measurement of the GFR in rats is evaluated by quantifying the fluorescence intensity of the FITC-S in rat ears [37]. Due to the hemoglobin absorbance in the green, the FITC-S fluorescence in blood vessels could not be detected demonstrating that this approach cannot assess properly all the compartments; therefore, a one-compartment model that only describes the terminal slow decrease in plasma concentration, was chosen [37].
In later experiments, when the relative emission of FITC-S is measured positioning a device on the back of conscious rodents, a two-compartment model was fitted to the transcutaneous measurements for the t1/2determination in rats [42]. This mathematical modeling makes it possible to assess the entire course of the marker through the combination of a negative and a positive exponential term, although this approach may lead to bias especially in kidney impairment cases [43]. In addition, in mice, the strong movements following the light anesthesia needed for the device placement make it difficult to assess the GFR transcutaneously with the two-compartment kinetic model described for rats [32,41].
In this regard, it is important to note that the transcutaneous method does not involve anesthesia during the measurements as anesthesia leads to uncontrolled changes in blood pressure, affecting the GFR.
Transcutaneous measurement of GFR was performed also in larger animals [44,45], where the half-lives were calculated from the single exponential slope (m) of the FITC-S disappearance curve according to the one compartment model and expressed by the formula t1/2= ln2/m.
Since m is equal to GFR normalized to ECV, the GFR has been estimated without the use of a conversion factor, which is not calculable when the number of animals employed for the studies is low [44].
In pigs, GFR was evaluated by extrapolating the AUC from the marker plasma curve according to a two-compartment model. In this study, the transcutaneous measurements were based on the TPDD technique, in combination with a different tracer, inulin-Cy7.5. The AUC was calculated by taking into account the area under the bi-exponential curve reflecting the equilibrium of the marker in the blood pool as well as, the component prior to t0 (pre-equilibrium phase) [27].
More recently, a three-compartment model with a modulated baseline has been applied for the transcutaneous measurement of the GFR with FITC-S in rats. It can show the complete course of the marker and its precision is comparable to gold standard techniques that make use of constant infusion of markers. The injection compartment was introduced in order to describe the kinetics from the start of the injection and an automated baseline correction term was determined to correct the baseline drifts.
Moreover, a new conversion factor was generated in order to solve the GFR overestimation issue that arises when it is calculated based on the one-compartment model [43].
The three-compartment model was also the choice for the GFR estimation based on lifetime-decomposition measurement (LTDM) that aims to reduce the dose of administered FITC-S for transcutaneous measurements. LTDM is based on the measurement of the fluorescence lifetime of the used GFR marker and it involves other components such as skin autofluorescence and reflection. For this reason, a specific statistical processing of the data is required to separate the signal from the background [34].
However, a different approach based on the constant infusion of FITC-S provides the precise onset of the steady state of the marker concentration by transcutaneous measurements. The dynamic equilibrium between infusion and excretion of the marker at the steady state can be well described by the two-compartment model. When the steady state is reached (ts), the transcutaneous fluorescence signal i(ts) is also expected to be stable and the GFR is proportional to the infusion flow rate (IFR); this can be expressed as the following mathematical correlation:
GFR= IFR x Cinf/Cp x Iref/i(ts) where Cinf represents the FITC-S concentration (mg/ml), Cp(mg/ml) is the FITC-S plasma concentration, and Iref is the regulation reference fluorescence level. Thereby, the GFR can be estimated by taking a single blood sample when the steady state is reached [31].
Lately, the use of a novel fluorescent marker, MB-102 has been validated in clinical trials, modeling the transcutaneous measurements by using both one and two-compartment models [7,46].
When the equilibration of the marker between the vascular space and the extracellular space occurs, a correlation between the fluorescence decay and the plasma concentration of the marker over time was observed. The decay curves were fit to a single exponential starting between 30 and 120 minutes after agent injection. In order to fit the data to a two-compartment model, the starting time of the measurements was established between 0.3 and 10 minutes after injection [7].
Among other non-invasive techniques recently described, reverse iontophoresis (RI) has been employed in combination with the transdermal injection of the GFR marker iohexol [8].
The method was developed by using simulated kinetic parameters, estimated by sampling the subdermal concentration of the marker over time and then compared to those calculated from the iontophoretic extraction fluxes.
The terminal elimination phase of the iohexol from the blood is well-tracked by its RI extraction flux from the subdermal interstitial fluid and characterized by the same rate constant that is used for estimating the GFR [8].
Ultimately, the development of free and user-friendly software for fitting the data to the compartmental analysis represents a very useful implementation for the transcutaneous method.
In this instance, the use of an open source, freely downloadable software “GFR measure” based on MATLAB has been described for calculating the half-life of the agent ABZWCY-HPβCD by fitting the signal measured by the NIR device to one, two or three-compartment models [26].
Conclusion
Current clinical diagnostic tests for assessing renal function can be inaccurate (e.g., serum creatinine, cystatin C etc.), expensive (e.g., inulin, sinistrin), cumbersome and invasive due to multiple blood/urine sampling [1]. The switch to transcutaneous measurement of a fluorescent GFR marker can be of great advantage because of its faster, non-invasive, cheaper, and more patient-friendly nature. Wide range of electronic components are used to estimate the rate of decay of the GFR marker. Miniaturized devices that work with NIR dyes have the comfort of fixation on the skin, which encourages frequent measurements if needed. Most of the work done until now in the field of fluorescent GFR markers has been limited to the visible spectrum. Nevertheless, NIR dyes are making their way into the state of the art with their added benefits of higher molar extinction coefficients and deeper tissue penetration. This is useful for injecting lower doses of the marker, thus making it less toxic and cheaper, and for getting rid of background signals from biological tissues during transcutaneous measurements.
Although factors such as photo bleaching, skin autofluorescence and inefficient attachment of the device on the skin can potentially affect the measurements, the introduction of correction terms can limit their impact on the analysis [43] and the development of more suitable tracers can overcome some of these issues.
Furthermore, obtaining a large number of transcutaneous measurements can facilitate the modeling of the resulting data based on a complex kinetic characterization, leading to GFR estimation with improved accuracy. For instance, the incomplete assessment of the marker distribution/elimination as seen in the one-compartment model gives rise to overestimation of the GFR.
Another significant advantage of the techniques discussed so far, is the possibility to perform the measurements on conscious animals, not requiring anesthesia that affects the renal function by producing variations in the blood pressure.
The field, although yet majorly limited to pre-clinical studies, shows scope for further development and translation to clinical application as a cheaper, convenient, and simpler tool for early-stage renal diagnosis.
Acknowledgements
This study has received funding from the European Union’s Horizon 2020 research and innovation programme under the Marie Sk?odowska-Curie Grant agreement no. 813839 (RenalToolBox).
References
2. Huang J, Weinfurter S, Daniele C, Perciaccante R, Federica R, Ciana LD, et al. Zwitterionic near infrared fluorescent agents for noninvasive real-time transcutaneous assessment of kidney function. Chemical science. 2017;8(4):2652-60.
3. Schwartz GJ, Furth SL. Glomerular filtration rate measurement and estimation in chronic kidney disease. Pediatric nephrology. 2007 Nov;22(11):1839-48.
4. Frennby B, Sterner G. Contrast media as markers of GFR. European radiology. 2002 Feb;12(2):475-84.
5. Bauman LA, Watson NE, Scuderi PE, Peters MA. Transcutaneous renal function monitor: precision during unsteady hemodynamics. Journal of clinical monitoring and computing. 1998 May;14(4):275-82.
6. Rabito CA, Moore RH, BougaS C, Dragotakes SC. Noninvasive, real-time monitoring of renal function: the ambulatory renal monitor. Journal of Nuclear Medicine. 1993 Feb 1;34(2):199-207.
7. Debreczeny MP, Dorshow RB. Transdermal optical renal function monitoring in humans: development, verification, and validation of a prototype device. Journal of biomedical optics. 2018 May;23(5):057003.
8. Djabri A, van’t Hoff W, Brock P, Wong IC, Guy RH, Delgado-Charro MB. Iontophoretic transdermal sampling of iohexol as a non-invasive tool to assess glomerular filtration rate. Pharmaceutical research. 2015 Feb;32(2):590-603.
9. Ebah LM, Read I, Sayce A, Morgan J, Chaloner C, Brenchley P, et al. Reverse iontophoresis of urea in health and chronic kidney disease: a potential diagnostic and monitoring tool?. European journal of clinical investigation. 2012 Aug;42(8):840-7.
10. Rajagopalan R, Dorshow RB. Exogenous Fluorescent Agents for the Determination of Glomerular Filtration Rate. Chronic Kidney Disease. 2012 Mar 16:251.
11. Rabito CA, Chen Y, Schomacker KT, Modell MD. Optical, real-time monitoring of the glomerular filtration rate. Applied optics. 2005 Oct 1;44(28):5956-65.
12. Poreddy AR, Asmelash B, Galen KP, Fitch RM, Shieh J-J, Wilcox JM, et al. N-alkylated aminopyrazines for use as hydrophilic optical agents. Proc SPIE. 2009;7190:71900P.
13. Poreddy AR, Asmelash B, Neumann WL, Dorshow RB. A highly efficient method for the N-alkylation of aminopyrazines: Synthesis of hydrophilic red fluorescent dyes. Synthesis. 2010;(14):2383-92.
14. Dorshow RB, Debreczeny M, Johnson JR, Shieh JJ, Rogers TE, Martin KJ, et al. Clinical study results of a real-time point-of-care glomerular filtration rate measurement. J Am Soc Nephrol. 2017;28:597.
15. Dorshow RB, Bugaj JE. Next tier in vitro and in vivo nonclinical studies further elucidating the safety and toxicity profile of MB-102, a novel fluorescent tracer agent for measurement of glomerular filtration rate. Regulatory Toxicology and Pharmacology. 2019 Oct 1;107:104417.
16. Dorshow RB, Debreczeny MP, Dowling TC. Results of the first-in-human clinical trial for MB-102, a novel fluorescent tracer agent for real-time measurement of glomerular filtration rate. Proc SPIE. 2015;9339:933906.
17. Shieh JJ, Riley IR, Rogers TE, Kao LF, Dorshow RB. Characterization of MB-102, a New Fluorescent Tracer Agent for Point-of-Care Renal Function Monitoring. J Pharm Sci. 2020;109(2):1191-8.
18. ClinicalTrials.gov. Pharmacokinetics of MB-102 and Use of the Non-invasive Optical Renal Function Monitor (ORFM) Device in Subjects With Normal and Impaired Renal Function and a Range of Skin Color Types. Identifier NCT02772276; 2020 Nov.
19. Poreddy AR, Asmelash B, Debreczeny MP, Fitch RM, Freskos JN, Galen KP, et al. Development of fluorescent tracers for the real-time monitoring of renal function. Proc SPIE. 2011;7910:791010.
20. Poreddy AR, Neumann WL, Freskos JN, Rajagopalan R, Asmelash B, Gaston KR, et al. Exogenous fluorescent tracer agents based on pegylated pyrazine dyes for real-time point-of-care measurement of glomerular filtration rate. Bioorg Med Chem. 2012;20(8):2490-7.
21. Huang J, Gretz N. Light-Emitting Agents for Noninvasive Assessment of Kidney Function. ChemistryOpen. 2017;6(4):456-71.
22. Lorenz JN, Gruenstein E. A simple, nonradioactive method for evaluating single-nephron filtration rate using FITC-inulin. Am J Physiol. 1999;276(1):F172-7.
23. Pill J, Issaeva O, Woderer S, Sadick M, Kranzlin B, Fiedler F, et al. Pharmacological profile and toxicity of fluorescein-labelled sinistrin, a novel marker for GFR measurements. Naunyn Schmiedebergs Arch Pharmacol. 2006;373(3):204-11.
24. Schock-Kusch D. Transcutaneous measurement of glomerular filtration rate in conscious laboratory animals: State of the art and future perspectives. Naunyn-Schmiedeberg's Arch Pharmacol. 2017;390:S87-S.
25. Huang J, Weinfurter S, Pinto PC, Pretze M, Kränzlin B, Pill J, et al. Fluorescently Labeled Cyclodextrin Derivatives as Exogenous Markers for Real-Time Transcutaneous Measurement of Renal Function. Bioconjug Chem. 2016;27(10):2513-26.
26. Daniele C, Nardozi D, Torelli A, Khan AUM, Gretz N. Transcutaneous Measurement of Glomerular Filtration Rate in Rodents. Methods Mol Biol. 2020;2067:129-37.
27. Hauser-Kawaguchi A, Milne M, Li F, Lee TY, Luyt LG. The development of a near infrared inulin optical probe for measuring glomerular filtration rate. Int J BiolMacromol. 2019;123:255-60.
28. Rabito CA, Panico F, Rubin R, Tolkoff-Rubin N, Teplick R. Noninvasive, real-time monitoring of renal function during critical care. J Am Soc Nephrol. 1994;4(7):1421-8.
29. Dorshow RB, Asmelash B, Chinen LK, Debreczeny MP, Fitch RM, Freskos JN, et al. New optical probes for the continuous monitoring of renal function. Proc SPIE. 2008;6867:68670C.
30. Debreczeny MP, Dorshow RB. Transdermal optical renal function monitoring in humans: development, verification, and validation of a prototype device. J Biomed Opt. 2018;23(5):1-9.
31. Schock-Kusch D, Shulhevich Y, Xie Q, Hesser J, Stsepankou D, Neudecker S, et al. Online feedback-controlled renal constant infusion clearances in rats. Kidney Int. 2012;82(3):314-20.
32. Schreiber A, Shulhevich Y, Geraci S, Hesser J, Stsepankou D, Neudecker S, et al. Transcutaneous measurement of renal function in conscious mice. Am J Physiol Renal Physiol. 2012;303(5):F783-8.
33. Herrera Pérez Z, Weinfurter S, Gretz N. Transcutaneous assessment of renal function in conscious rodents. J VisExp. 2016;2016(109):1-8.
34. Shmarlouski A, Schock-Kusch D, Shulhevich Y, Buschmann V, Rohlicke T, Herdt D, et al. A Novel Analysis Technique for Transcutaneous Measurement of Glomerular Filtration Rate With Ultralow Dose Marker Concentrations. IEEE Trans Biomed Eng. 2016;63(8):1742-50.
35. Peters AM. The kinetic basis of glomerular filtration rate measurement and new concepts of indexation to body size. Eur J Nucl Med Mol Imaging. 2004;31(1):137-49.
36. Murray AW, Barnfield MC, Waller ML, Telford T, Peters AM. Assessment of glomerular filtration rate measurement with plasma sampling: a technical review. J Nucl Med Technol. 2013;41(2):67-75.
37. Schock-Kusch D, Sadick M, Henninger N, Kraenzlin B, Claus G, Kloetzer HM, et al. Transcutaneous measurement of glomerular filtration rate using FITC-sinistrin in rats. Nephrol Dial Transplant. 2009;24(10):2997-3001.
38. Schock-Kusch D, Geraci S, Ermeling E, Shulhevich Y, Sticht C, Hesser J, et al. Reliability of transcutaneous measurement of renal function in various strains of conscious mice. PLoS One. 2013;8(8):e71519.
39. Street JM, Koritzinsky EH, Bellomo TR, Hu X, Yuen PST, Star RA. The role of adenosine 1a receptor signaling on GFR early after the induction of sepsis. Am J Physiol Renal Physiol. 2018;314(5):F788-F97.
40. Scarfe L, Schock-Kusch D, Ressel L, Friedemann J, Shulhevich Y, Murray P, et al. Transdermal Measurement of Glomerular Filtration Rate in Mice. J Vis Exp. 2018;2018(140):58520.
41. Ellery SJ, Cai X, Walker DD, Dickinson H, Kett MM. Transcutaneous measurement of glomerular filtration rate in small rodents: through the skin for the win? Nephrology (Carlton). 2015;20(3):117-23.
42. Schock-Kusch D, Xie Q, Shulhevich Y, Hesser J, Stsepankou D, Sadick M, et al. Transcutaneous assessment of renal function in conscious rats with a device for measuring FITC-sinistrin disappearance curves. Kidney Int. 2011;79(11):1254-8.
43. Friedemann J, Heinrich R, Shulhevich Y, Raedle M, William-Olsson L, Pill J, et al. Improved kinetic model for the transcutaneous measurement of glomerular filtration rate in experimental animals. Kidney Int. 2016;90(6):1377-85.
44. Mondritzki T, Steinbach SML, Boehme P, Hoffmann J, Kullmann M, Schock-Kusch D, et al. Transcutaneous glomerular filtration rate measurement in a canine animal model of chronic kidney disease. J Pharmacol Toxicol Methods. 2018;90:7-12.
45. Steinbach S, Krolop N, Strommer S, Herrera-Pérez Z, Geraci S, Friedemann J, et al. A pilot study to assess the feasibility of transcutaneous glomerular filtration rate measurement using fluorescence-labelled sinistrin in dogs and cats. PLoS One. 2014;9(11):e111734.
46. Achilefu S, Raghavachari R, Debreczeny MP, Dorshow RB. Development and clinical trial results of a prototype device for trans-cutaneous monitoring of kidney function. Proc SPIE. 2017;10079:100790K.