Abstract
The pandemic caused by coronavirus COVID-19 are of great concern. A detailed scientific analysis of this phenomenon is still to come, but now it is urgently needed to evaluate the parameters of the disease dynamics in order to make some preliminary estimations of the number of cases and possible duration of the pandemic. The corresponding mathematical models must be simple enough, since their parameters are unknown and have to be estimated using limited statistical data sets. The SIR model, statistical approach to the parameter identification and the official WHO daily data about the confirmed cumulative number of cases were used to calculate the SIR curves and make some estimations and predictions. Some prospects for the global pandemic dynamics are discussed.
Keywords
Coronavirus pandemic, Epidemic outbreak in Italy, Coronavirus COVID-19, Coronavirus 2019-nCoV, Mathematical modeling of infection diseases, SIR model, Parameter identification, Statistical methods
Introduction
Here, we consider the development of epidemic outbreak in Italy caused by coronavirus COVID-19 (2019-nCoV) [1]. Some investigations of the epidemic spreading in mainland China [2-7] could be useful to understand the epidemic outbreak in other countries, since we deal with the same pathogen. A preliminary comparison of the epidemic dynamics in Italy and in mainland China has been done in [8,9]. In the study by Li et al. [10], the global coronavirus epidemic dynamics was analyzed. In this paper, we will use the official WHO daily data [1] for the confirmed accumulated number of patients (victims) V(t) (number of persons who caught the infection and got sick; t is time measured in days), the SIR model [11-14] and the statistics-based method of parameter identification [14] in order to calculate the pandemic characteristics and to make some estimations and predictions.
Data
The official data about the accumulated number of confirmed cases in Italy Vj; European region VEj , USA VUj and global numbers VGj (without cases in mainland China and the Republic of Korea) from the WHO daily situation reports (numbers 33-65, [1]) will be used. The corresponding moments of time tj (in days) are also shown in Table 1.
|
Day in February and March, 2020
|
Time moments in days tj |
Number of cases in Italy, VJ
|
European Region, VEJ |
USA, VUj |
Global without cases in mainland China and South Korea, VGJ |
|
21 |
-1 |
9 |
54 |
35 |
1056 |
|
22 |
0 |
76 |
121 |
35 |
1167 |
|
23 |
1 |
124 |
169 |
35 |
1306 |
|
24 |
2 |
229 |
279 |
53 |
1482 |
|
25 |
3 |
322 |
379 |
53 |
1657 |
|
26
|
4 |
400
|
486 |
59
|
1898 |
|
27 |
5 |
650 |
798 |
59 |
2354 |
|
28 |
6 |
888 |
1107 |
62 |
2859 |
|
29 |
7 |
1128 |
1457 |
62 |
3433 |
|
1 |
8 |
1689 |
2136 |
62 |
4562 |
|
2 |
9 |
2036 |
2732 |
64 |
5753 |
|
3 |
10 |
2502 |
3367 |
108 |
7341 |
|
4 |
11 |
3089 |
4307 |
129 |
8993 |
|
5 |
12 |
3858 |
5820 |
148 |
11197 |
|
6 |
13 |
4636 |
7491 |
213 |
14347 |
|
7 |
14 |
5883 |
9453 |
213 |
17593 |
|
8 |
15 |
7375 |
12242 |
213 |
21291 |
|
9 |
16 |
9172 |
15130 |
472 |
25265 |
|
10 |
17 |
10149 |
18124 |
696 |
29609 |
|
11 |
18 |
12462 |
23112 |
987 |
36410 |
|
12 |
19 |
15113 |
28892 |
1264 |
43788 |
|
13 |
20 |
17660 |
36263 |
1678 |
53427 |
|
14 |
21 |
21157 |
45060 |
1678 |
64304 |
|
15 |
22 |
24747 |
55623 |
1678 |
78197 |
|
16 |
23 |
27980 |
64135 |
3503 |
89680 |
|
17 |
24 |
31506 |
74703 |
3536 |
101612 |
|
18 |
25 |
35713 |
86994 |
7087 |
120173 |
|
19 |
26 |
41035 |
104425 |
10442 |
144121 |
|
20 |
27 |
47021 |
128434 |
15219 |
175858 |
|
21 |
28 |
53578 |
151173 |
15219 |
201747 |
|
22 |
29 |
59138 |
171226 |
31573 |
242368 |
|
23 |
30 |
63927 |
195261 |
42164 |
281973 |
|
24 |
31 |
69176 |
220249 |
51914 |
323194 |
SIR Model and Optimal Values of its Parameters
The SIR model for an infectious disease [6,11-14] relates the number of susceptible persons S (persons who are sensitive to the pathogen and not protected); the number of infected is I (persons who are sick and spread the infection; please don’t confuse with the number of still ill persons, so known active cases) and the number of removed R (persons who no longer spread the infection; this number is the sum of isolated, recovered, dead, and infected people who left the region); α and ρ are constants.
To determine the initial conditions for the set of equations (1-3), let us suppose that at the moment of the epidemic outbreak to, [6,14]:

The analytical solution for the set of equations (1-3) was obtained by introducing the function  , corresponding to the number of victims or cumulative confirmed number of cases, [14]:
The solution for the SIR set of differential equations depends on four parameters N, α, v= ρ/α, to, which can be identified with the use of the statistical approach developed in Nesteruk study [14]. This method and Vj data set for Italy were used to define the optimal (the most reliable) values of four parameters and calculate numbers of infected I , susceptible S, removed R persons and the number of victims V=I+R . Corresponding dependences versus time are shown in Figure 1.
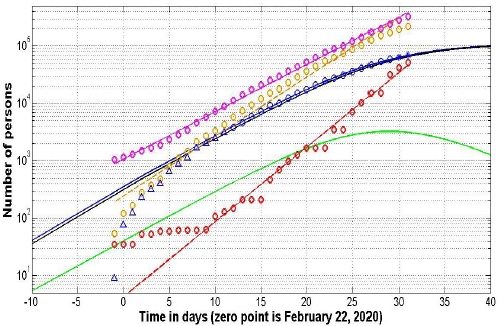
Figure 1: SIR curves for Italy (solid lines). Pandemic development in Europe, USA and in the World (without cases in mainland China and South Korea) (dashed lines).
Results for Italy
Usually the number of cases during the initial period of an epidemic outbreak is not reliable. To avoid their influence on the results, only Vj values for the period March 5-22, 2020 (12 ≤tj ≤ 29) were used for calculations (see blue “circles” in Figure 1). Other points were used only for comparison (blue “triangles”) and verification of predictions (blue “stars”). The use of data corresponding the initial stage of the epidemic (“circles” and “triangles” together) did not yield a stable reliable prediction. The calculated optimal values of parameters are:
N=534656; V=476712.744111309; α =3.47467962473570e-06; to=-18.3797687612985;
Now every person familiar with differential equations can use this data to integrate Eqs. (1-3) with initial conditions (4) to obtain the SIR curves and to check the results of calculations (it is also possible to use the analytical solution available in [6]). The values of final number of susceptible persons S∞ ≈ 423108 and the final number of victims (final accumulated number of cases) V∞ ≈ 111548 were calculated. Unfortunately, in Italy more people will be infected in comparison with mainland China, where the saturation level V∞ ≈ 81257 was predicted in Nesteruk study on March 4, 2020 in [9] (on March 24 the accumulated number of cases confirmed in mainland China is 81848, see [1], situation report No 65). On March 9, 2020 it was calculated that the epidemic in Italy develops more rapid than it was in China, [15]. Unfortunately, this conclusion seems to be true.
For Italy: numbers of infected I (green line), removed R (black line) and the number of victims V=I+R (blue line); “circles” correspond to the confirmed accumulated number of cases taken for calculations; “triangles” correspond to the cases during initial stage of the epidemic; “stars” –last two data points used only for a verification of the prediction. Brawn, red and magenta markers represent respectively the numbers of cases in European region, USA and in the World (without cases in mainland China and South Korea); corresponding dashed lines fit the points.
To estimate the duration of the coronavirus epidemic outbreak in Italy, we can use the condition V(tfinal)=1 which means that after this moment less than one person still spread the infection. The calculations give us the value tfinal ≈ 79.5. According to this estimation, we can expect that local transmission of the epidemic in Italy could stop only after May 12, 2020, provided that existing quarantine measures and patient isolation rates continue.
It is also possible to calculate the value of parameter ρ=Vα=1.6564 and the inverse value 1/ρ=0.6037. Thus, the average time of spreading the infection in Italy can be estimated as 14.5 hours. By comparison, in South Korea was approximately 4.3 hours [16] and in mainland China - 2.5 days [9]. By mid-April 2020, there will still be more than thousand people spreading the infection in Italy (see green line in Figure 1).
The calculated value t0and blue line in Figure 1 demonstrate that the first cases of coronavirus infection have not been identified in Italy and sick people spread it rather long time. As a result, more cases are expected in Italy in comparison with China. Probably, due to the rapid isolation of infected persons, the more or less stable number of cases in South Korea (9137 on March 24) is much smaller than in Italy.
All the parameters in SIR model are supposed to be constant. If the quarantine measures and speed of isolation change or new infected persons are coming in the country, the accuracy of the prediction reduces. Usually the number of cases during the initial period of an epidemic outbreak is not reliable. To avoid their influence on the results, some new estimations have been published in [17]. Unfortunately, the forecast for Italy worsened: the epidemic will stop only at the end of May with the number of cases 148-153 thousand.
Discussion of Global Prospects
Since the recent situation in mainland China and the Republic of Korea is stable, The estimations of global pandemic prospects have been done without cases in this two regions. The corresponding numbers VGj are shown in the last column of Table 1 and in the Figure 1 (magenta “circles”). The number of cases VEj and VUj are also shown in Figure 1 (brown and red “circles” respectively). It can be seen that VEj, VUj and VGj numbers more or less follow straight lines in the logarithmic scale. It means that the epidemic dynamics in these regions is close the exponential one.
To estimate the slopes of these straight lines, the linear regression for the values log(VYj), Y =E, U, G was used (see, e.g., [14,18]). The corresponding best fitting dashed lines are shown in Figure 1. To avoid influence of the initial epidemic outbreak stages, calculations have been done only for VYj >100, Y =E, U ; repeating values were used only once. It can be seen that the most rapid is the epidemic in USA (the number of cases duplicates every 2.31 days). The European and global duplications rates are 2.91 and 3.65 days respectively. Without stabilization by mid-April 2020 (22 days after March 24) we can have in Europe 41 million cases; 38 millions in USA and 211 millions globally. Fortunately, the pandemic development in last days of March showed some stabilization [19], and these sad figures are no longer relevant. Let us hope that quarantine measures and fast isolation of infected persons will stabilize the COVID-19 pandemic development.
Acknowledgements
I would like to express my sincere thanks to Gerhard Demelmair and Ihor Kudybyn for their help in collecting and processing data.
References
2. Li Q, Guan X, Wu P, Wang X, Zhou L, Tong Y, et al. Early transmission dynamics in Wuhan, China, of novel coronavirus–infected pneumonia. New England Journal of Medicine. 2020 Jan 29.
3. Wu JT, Leung K, Leung GM. Nowcasting and forecasting the potential domestic and international spread of the 2019-nCoV outbreak originating in Wuhan, China: a modelling study. The Lancet. 2020 Feb 29;395(10225):689-97.
4. Zhao S, Lin Q, Ran J, Musa SS, Yang G, Wang W, et al. Preliminary estimation of the basic reproduction number of novel coronavirus (2019-nCoV) in China, from 2019 to 2020: A data-driven analysis in the early phase of the outbreak. International Journal of Infectious Diseases. 2020 Mar 1;92:214-7.
5. Tang B, Bragazzi NL, Li Q, Tang S, Xiao Y, Wu J. An updated estimation of the risk of transmission of the novel coronavirus (2019-nCov). Infectious Disease Modelling. 2020 Jan 1;5:248-55.
6. Nesteruk I. Statistics-based predictions of coronavirus epidemic spreading in mainland China. Innovative Biosystems and Bioengineering. 2020;4(1):13-8.
7. Batista M. Estimation of the final size of the COVID-19 epidemic. Preprint.] medRxiv. 2020.
8. Nesteruk I. How can we estimate the dangers of the coronavirus epidemic in Europe?. Preprint.] ResearchGate. 2020.
9. Nesteruk I. Characteristics of coronavirus epidemic in mainland China estimated with the use of official data available after February 12, 2020. Preprint.] ResearchGate. 2020.
10. Li Y, Liang M, Yin X, Liu X, Hao M, Hu Z, Wang Y, Jin L. COVID-19 epidemic outside China: 34 founders and exponential growth. medRxiv. 2020 Jan 1.
11. Kermack WO, McKendrick AG. A contribution to the mathematical theory of epidemics. Proceedings of the Royal Society of London. Series A, Containing papers of a mathematical and physical character. 1927 Aug 1;115(772):700-21.
12. Murray JD. Mathematical biology, 3rd edn, vol. 2. Mathematical biology: II. Spatial models and biomedical applications. 2003.
13. Langemann D, Nesteruk I, Prestin J. Comparison of mathematical models for the dynamics of the Chernivtsi children disease. Mathematics and Computers in Simulation. 2016 May 1;123:68-79.
14. Nesteruk I. Statistics based models for the dynamics of Chernivtsi children disease. 2017(5):26-34.
15. Nesteruk I. Comparison of the coronavirus epidemic dynamics in Italy and mainland China. Preprint.] ResearchGate. 2020.
16. Nesteruk I. Estimations of the coronavirus epidemic dynamics in South Korea with the use of SIR model. Preprint.] ResearchGate. 2020.
17. Nesteruk I. Long-term predictions for COVID-19 pandemic dynamics in Ukraine, Austria and Italy. medRxiv. 2020 Jan 1.
18. Nesteruk IG. Maximal Speed of Underwater Locomotion. Innovative biosystems & bioengineering. 2019(3, no. 3):152-67.
19. Nesteruk. I.. Kydybyn I.. Demelmair G. “Coronavirus pandemic dynamics in March. 2020. What can we expect in April?” 2020 April.