Abstract
This research introduces a hybrid model designed based on an explainable and data-driven paradigm of predicting customer loss in an online shop. The model incorporates Convolutional Neural Network (CNN), Bidirectional Long Short-Term Memory (BiLSTM), along with Attention, and Multilayer Perceptron (MLP) branch to reflect the presence of both time-based and space-based correlation in customer behavioral data. The experiment relied on an open-access Kaggle e-commerce dataset consisting of 16 attributes and 10,000 customer records. The Synthetic Minority Over-sampling Technique (SMOTE) is used to preprocess the data and balance, encode, and normalize it. The hybrid model created surpassed the traditional baselines, such as the Logistic Regression, Random Forest, and XGBoost, with an accuracy of 0.87, precision of 0.88, recall of 0.88, and F1-score of 0.50. Also, SHapley Additive Explanations (SHAP) analysis made interpretability a possibility as the key elements that caused churn were shown to be inactivity and support ticket frequency. The results can be discussed as the recommending model offer valuable information about proactive customer retention measures in e-commerce and enhance explainability, prediction precision, and robustness.
Keywords
Customer churn, Deep learning, Hybrid model, Explainable AI, E-commerce, SHAP
Introduction
The last 20 years have witnessed an unparalleled growth of e-commerce that has transformed the way business entities attract, interact and maintain their customers [1]. The internet has transformed the world, and customers can now find an infinite number of options with a single press of a button, making the market environment highly competitive. Customer retention has thus emerged to be an essential business foundation to business success, since it is far cheaper to retain an already acquired customer than to acquire a new customer [2]. Nevertheless, customer turnover, or the way customers stop interacting with the products or services of a business is still a thorn in the flesh in all sectors [3]. Even a minor rise in the churn rate may drastically reduce the long-term profitability, brand loyalty and destabilize the customer lifetime value forecasts. In the past, companies depended on either descriptive analysis, RFM segmentation or heuristic models to detect at-risk customers [4]. Yet, using traditional methods to identify the root causes of churn misses the fact that behaviors, transactions and psychological accounts that create churn may be more complex and changing faster than the speed of light in dynamic digital ecosystems [5]. As a result, the demand to develop smart, data-oriented models that can spot the possible churners early has been increasing, which will allow retention intervention to be performed in time [6]. In spite of the extensive advancement in predictive analytics, there are still a number of gaps in research in the existing churn modeling practices [7]. The traditional statistical models like the Logistic Regression or the Decision Trees give a simple knowledge of the relationship between the features but are constrained by their linear separability assumptions [8]. On the other hand, more sophisticated machine learning methods such as Random Forests and Gradient Boosting Machines have a higher predictive ability but are not transparent—they create a black-box dilemma which limits their use in business [9]. This is a predictive accuracy versus interpretability trade-off that is one of the main obstacles in the translation of churn prediction research into business action [10]. Besides, several of the current models do not take into consideration the significance of matching the predictive outputs with the actual decision constraints, including marketing costs, retention budgets, and allowable false alarm rates [11]. To fill these gaps, one should have a methodology that does not only learn the complex data pattern in an efficient way but also gives an account of its predictions in a human comprehensible form yet calibrated to business goals [12]. Machine learning has been very effective in the modeling of complex consumer behavior that would reveal hidden interactions and non-linear dependence on features [13]. There is, however, no one algorithm that is universally the best in all problem situations and data distribution. Logistic Regression represents general trends well but not complex structures; random forests are capable of nonlinearity but can overfit in smaller datasets; and the XGBoost is accurate and needs a lot of tuning and is not interpretable [14]. A mechanism to develop a superior robustness and generalization ensues from ensemble learning, especially stacking-based learning, which gives an opportunity to benefit from the complementary strengths of several learners [15]. In the current research, this collective justification is borrowed, with the incorporation of Logistic Regression, Random Forest, and XGBoost into a single stacking model [16]. Embodied with the non-linear flexibility of its tree based models, paired with the simple to understand interpretability of regression models, this hybrid offers a balanced approach delivering both interpretability and performance [17]. Moreover, in order to be explainable, the study also incorporates SHapley Additive Explanations (SHAP), a sophisticated interpretability algorithm that measures the importance of each feature to specific predictions [18]. The integration of this nature will help the proposed model to change into a transparent decision-support tool rather than a system that is purely predictive, and the managers will be able to comprehend the behavioral and operational determinants that affect the customer churn [19,20]. The proposed model will create a strong, explainable and business-oriented machine learning model to predict customer churn in e-commerce settings. The model incorporates three major stages in a unified pipeline. First, raw e-commerce data are processed by cleaning, encoding, and standardization to achieve uniformity and the categorical and numerical data are converted to enable effective learning and selection of meaningful features. Then, a stacking ensemble is built based on the Logistic Regression, Random Forest, and XGBoost as base learners, and the results are combined by a meta-learner to find the linear and nonlinear complexity. The reliability and generalization are increased using cross-validation and calibration methods. Lastly, SHAP-based explainability is used to understand the influence of features, i.e. how the behavioral aspect, i.e. purchase frequency or engagement time, affects the churn risk, and a business-calibrated threshold balances recall and precision, i.e. an operational retention objective. All these elements combine to create a transparent and high-performing model that not only forecasts churn successfully but also offers actionable insights, which allow organizations to learn why customers churn and how to act in a way to intervene effectively.
The key results of this research may be outlined as follows:
- Development of hybrid stacking ensemble: The new hybrid structure is proposed that combines the Logistic Regression, Random Forest, and XGBoost, as the models are complementary to each other and enhance the accuracy and generality of churn prediction.
- Integration of explainable AI: SHAP based interpretability is added to explain the model at feature level, which increases the transparency of the model and leads to the data-driven managerial insights.
- Strict cross validation and calibration: Multi-fold cross-validation is used to assure robustness, whereas post-hoc calibration is used to enhance predictive probability reliability, which is congruent with model confidence and actual results.
- Business-oriented threshold optimization: It introduces a data-optimized threshold tuning feature to optimize the recall and precision, which is necessary to make sure that the predictive output is in sync with marketing performance and retention cost strategies.
- Whole process assessment and comparison: The empirical validation of the model is done on data of real e-commerce and compared with the baselines machine learning models, where the model is more accurate, has a higher recall, and higher F1-score.
The rest of this paper is organized in the following way. Section 2 provides a review of the literature in question and outlines the new trends in the customer churn pre- diction domain, underlining the gaps in the literature that have inspired this research. Section 3 includes the methodology with information on how the data will be prepared, the model structure, and the evaluation steps. The experimental results (both performance measures and interpretability results obtained through the SHAP analysis) are depicted and discussed in Section 5. Lastly, Section 6 wraps up the paper by providing a conclusion of findings, implications to practice, and further research.
Related Research
In the telecommunications industry, Asif, Arif, and Mukheimer [21] developed XAI-Churn TriBoost, an explainable ensemble model combining XGBoost, CatBoost, and LightGBM for customer churn prediction on over two million records. The framework used Bayesian ridge imputation, multi-stage scaling, Boruta feature selection, and SMOTE to handle data imbalance. Achieving 96.44% accuracy and an F1-score of 90.25%, the model outperformed traditional approaches. To enhance transparency, LIME and SHAP were applied, revealing regularity and montant as key churn indicators. The study demonstrates strong predictive performance with interpretability, though limited by the dataset scope and computational cost. Bhuria et al. [22] suggests an ensemble-based approach to predicting bank customers churning, by using various machine learning methods, KNN, SVC, Random Forest, Decision Tree, and XGBoost, in the form of a Voting Classifier setup. With an abundant demographic, financial, and behavioral feature set, the study explored features in a large amount and used the IQR technique to identify and eliminate outliers. Without resampling, the ensemble reached 0.87 accuracy and F1-score which went to 0.90 in all metrics with the use of SMOTe to deal with class imbalance. Findings indicate the strength and balanced forecasting ability of the proposed method as a useful means of retaining customers within banking firms though depends on the diversity of the datasets used. Manzoor et al. [23] suggested e-Profits, a profit-based measure of churn prediction that combines customer value, retention probability, and the cost of intervention using the Kaplan-Meier survival analysis model, as it constitutes a profit-based measure of prediction and is applicable for customer retention predictions. The highest-performing model on the IBM Telco and Maven Telecom datasets was found to have an accuracy of 87.41%, which comparing to more traditional metrics such as AUC and F1-score reflects better financial implications. The method offers business-oriented interpretability and can be used to make profit-oriented model choices, but it is only dependent on the availability of detailed financial data. Sedighimanesh et al. [24] suggested a Particle Swarm Optimization (PSO)-based framework optimizing hyperparameters (activation functions, regularization, learning rates, and neuron count) with a PSO-enhanced composite deep learning architecture in telecom customer churn prediction. The model incorporates several neural networks to describe the user behavior both in space and time. On Cell2Cell and IBM Telco datasets, it has obtained ROC-AUC scores of 0.932 and 0.93, F1-scores of 0.90 and 0.895, and the accuracy of 83.2 and 93, which are higher than benchmark models such as LSTM, GRU, CNN-LSTM and XGBoost. The study has a good level of generalization and robustness but the main shortcoming is computational intensity. In the case study of predicting customer churn by Mohaimin et al. [25], authors created the machine learning models predictive of customer churn in the U.S. telecommunications industry by picking the potential at-risk customers using customer billing data, customer service interaction data, and customer-related usage data. The tested models, including the Logistic Regression, SVM, and Random Forest, allowed us to identify the important metrics of churn which is why the classifier with the best results was the Random Forest with the accuracy of 92%. The paper notes that predictive analytics has capability to increase retention policies and profit and its efficiency can depend on the diversity and reality conditions of application.
Li and Yan [26], in their article developed an integrated system of churn prediction of credit card customers, which consisted of balancing data, the use of ensembles, and interpreting the methods. They were able to reach optimal results using Extreme Gradient Boosting (XGBoost) to provide 97 percent of accuracy, precision, recall, F-1 and area under the curve (AUC), which was better than the traditional neural machine methods. In order to achieve increased transparency, SHAP values were used to determine the critical drivers of churn, whereas R-learner causal inference was used to determine which variables have an impact. This analysis showed that the frequency of transactions, the size of the transactions, the number of the products of the bank, and the quarterly changes of the transactions are significant influencers of the churn behavior. The research has a high predictive performance, as well as a causal interpretability that is sound in credit card customers management.
Among the proposals that Yang et al. [27] outlined, there is a hybrid churn prediction model of credit card users, which includes data balancing, ensemble learning, and explainability measures. They obtained 97% accuracy, precision, recall, F1- score and AUC with Extreme Gradient Boosting (XGBoost) as the most appropriate model, which is superior when compared to conventional ML methods. To become more transparent, SHAP values served to calculate the most important churn drivers, and R-learner causal inference served to calculate the effect of variables. The rate of transactions, the dollar transacted and amount of bank products and dollar change in transactions per quarter were all found to be of a significant nature when determining the churn behavior. The work is usable in high predictive behavior and causability and provides a strong foundation where dealing with credit cards customer is concerned.
A tabular GAN-based sampling and Cost-sensitive learning hybrid framework were proposed to enhance customer churn prediction with conventional machine learning implementations by Adiputra et al. [28] that was named CostLearnGAN. Designed to address issues of imbalanced and overlapping data, the method enhances model robustness while maintaining computational efficiency for large-scale datasets. Evaluated across six datasets and multiple algorithms, CostLearnGAN achieved the best overall performance with an average mean rank score of 1.44 and a robustness value of 5.68, outperforming six existing sampling techniques. The study highlights CostLearn-GAN’s capacity to boost classical ML performance in churn prediction while preserving low execution time and scalability.
Liu et al. [29] introduced CostLearnGAN, a hybrid architecture consisting of tabular GAN-based sampling and cost-sensitive learning to enhance the components of classical machine learning models in terms of customer churn prediction. The method is aimed at solving problems of unbalanced and redundant data and improves the robustness of the model within computational efficiency to high scale data. Compared to a series of six data sets and a variety of algorithms, CostLearnGAN performed best on average with 1.44 mean rank and 5.68 robustness value, which are better results than six sampling methods. The article mentions the ability of CostLearnGAN to increase the performance of classical ML on churn prediction at low execution time and high scalability.
In failing to attend to the whole issue of AI usage in the telecommunications industry, Li et al. [5] used and evaluated diverse machine learning techniques and ensembles focusing on stacking ensembles in the study of customer churn prediction. The analysis was based on the Telecom-Customer-Churn data, in which several classifiers were compared, and eventually, CatBoost was selected due to its success in managing features of categories, missing values, and complicated nonlinear interactions. The study also points out that ensemble learning, specifically, stacking is highly effective to enhance predictive accuracy and retention strategies based on the data of telecom operators. Ma and Fan [30] used and compared a number of machine learning and deep learning models to predict pharmaceuticals sales in several markets. CNN-LSTM hybrid network performed the best with the highest accuracy of 94.3 and precision of 93.8 and the recall of 94.7 and F1-score of 0.942, being superior to pure LSTM (91.2), XGBoost (89.5), Random Forest (88.7), and SVM (85.6). The CNN-LSTM took more time to train (8.5 h), but it was found to be more effective in the detection of both space and time dependencies on cross-market drug data. The findings highlight the strength of CNN-LSTM model and generalization on complex forecasting tasks at increased costs of computation.
The study conducted by Saha et al. [31] also proposed the ChurnNet as a new full-fledged deep learning framework that is used to predict customer churn behavior in the telecommunications sector (TCI). The model incorporates 1D convolutional layers with residual blocks, Squeeze-and-excitation module, and a spatial analysis mechanism to improve the feature extraction and relationship of channel dependencies. The study used SMOTE, SMOTEENN and SMOTETomek resampling to deal with extreme imbalance of classes. ChurnNet was tested on three benchmark datasets with 10-fold cross-validation with the accuracy of 95.59, 96.94, and 97.52 and has better results compared to state-of-the-art methods. The findings indicate a strong level of generalization and interpretability of ChurnNet, thus making ChurnNet an effective framework of churn-detection and customer-retention strategies optimization in TCI. Poudel et al. [32] explored the subject of customer churn prediction within a telecommunications industry with a central focus on the concept of model interpretability as one of the factors that make it essential in making decisions. The paper used several classification algorithms and proposed explainer models that used local and global interpretability methods. Of the models that were tested, the GBM had the highest accuracy of 81, which was validated using a Wilcoxon signed-rank test, which proved that it was statistically better than other models. The study was able to use SHAP plots and other visualization tools to determine the determinants of churn and provide transparency in model outputs. The findings show the tradeoff between predictive performance and explainability, which proves the usefulness of GBM in the explanation of churn in service-based businesses. He and Ding [33] created a model named Ensemble-Fusion to predict customer churn by means of a combination of various machine learning algorithms illuminated within 9 major categories of models to build a stronger predictive capacity. The SVM, Random Forest, KNN, Gradient Boosting, Logistic Regression, Bayesian models, Decision Trees and Neural Networks are employed to form a complex ensemble of the framework. Experimental performance was good with a 95.35 accent, 91% AUC, and a 96.96% F1-score, which were much better than separate benchmark models. The paper highlights strength and versatility of ensemble fusion in predicting the churn, to present an intelligent tool that has the potential to effectively predict churn early and support proactive retention strategies in industries.
Ouf et al. [34] tested their generic hybrid (XGBoost + SMOTE-ENN) on three telecom exposure datasets IBM, Orange, and Iran in diverse preprocessing settings. Using the SMOTE-ENN and Standard Scaler parameter, the model had excellent outcomes: 98% on IBM, 98.25% on Orange, and 99.92% on Iran with a 98% and 99% and 99.93% of F1-scores. However, when standard scaling alone was used, particularly without resampling, the performance was significantly worse (82–84% and 59–68% F1-scores, on the mean). These findings corroborate that resampling hybridization and preprocessing can significantly improve the precision and accuracy of churn forecasting, making the proposed framework one of the best to use in telecom retention analytics.
Methodology
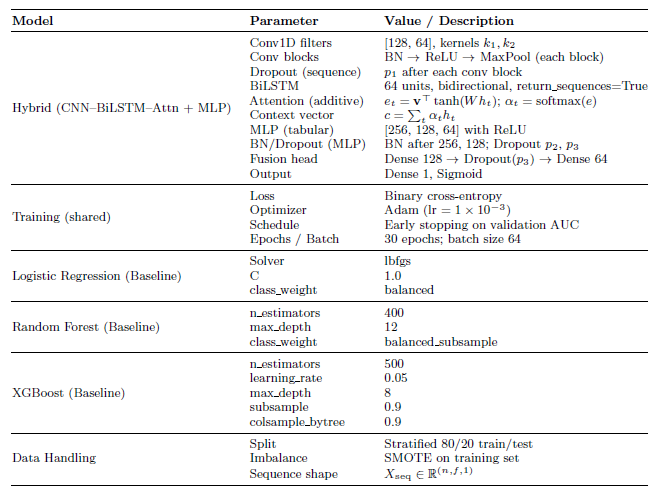
In this part methodological structure, shown in Figure 1, presents a double-branch churn estimation system that combines tabular learning with complex sequence modelling to provide a workable balance between clarity and accuracy. The thorough analysis and feature normalization, the collection of data is split and transmitted into two parallel inputs, including a CNN–BiLSTM–Attraction stack which collects both local patterns and long-range temporal variability, and an MLP body that processes tabular qualities. For the purpose of to offer advantageous examples and model candour when required, baseline students—Logistic Regression, Random Forest, and XGBoost—are developed on the same conditioning fold in addition to this combination branch. The mix module creates calibrated bounce probabilities by combining tabular classifications and sequential elements. These probabilities will be evaluated on the rejected test set using standard metrics, which allows a fair and pragmatic comparison to the norms.
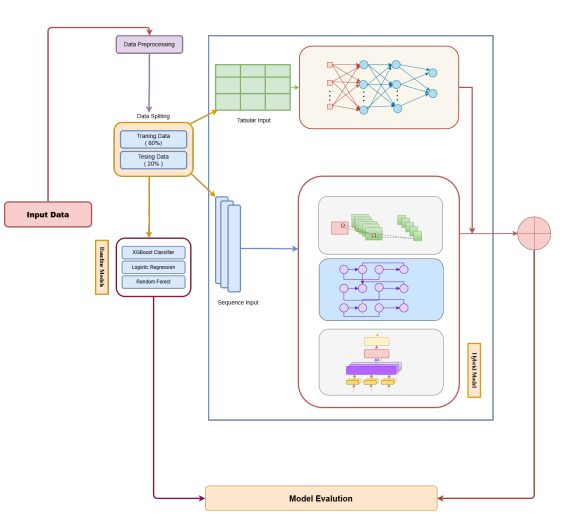
Figure 1. Original distribution of the target variable before applying SMOTE.
Dataset description
We conduct our study utilizing an open-access e-commerce dataset from the Kaggle repository. The dataset contains detailed demographic and behavioral information about online retail clients, such as the length of a session, the use of the application and website, the duration of the membership, and purchasing patterns. The dependent variable (binary classification: 1 = churned, 0 = retained) shows if a customer has left. The datasets contain 10 thousand unique customer records with 16 features columns, each representing a unique consumer. The dataset was analyzed to find missing values, abnormalities in the data distribution, and inconsistencies before pre-processing. Building a strong and broadly applicable churn prediction model requires an understanding of the attributes’ variation and composition.
Dataset preprocessing
The data was properly preprocessed to make sure its suitability for machine learning techniques and its integrity. Encoding categorical variables, scaling numerical features, cleaning missing data, and confirming feature relevance were all part of the procedure. The scikit-learn, pandas, and NumPy libraries were used to create the preprocessing procedure in Python.
Missing value handling: According to initial exploratory analysis, a few features had null or missing values, which might have resulted from system tracking failures or incomplete user interactions. The null () function was used to systematically identify missing values, and the percentage of missing entries for every feature was measured. Mean substitution was used to impute missing values for numerical attributes while maintaining the data’s central tendency. Mode imputation was used to address categorical variables, giving missing entries the most common category. By ensuring that no data instances were eliminated, our approach preserved the representativeness and size of the dataset.
Feature encoding and scaling: To make categorical variables appropriate with machine learning algorithms, Label Encoding was utilized for transforming them into numeric format, such as gender, location, or membership type. When appropriate, ordinal consistency was preserved during the encoding procedure, which transformed textual categories into integer labels. The different numeric ranges of feature values after encoding can result in bias in models that rely on gradients or distances. In order to counteract this effect, all continuous variables were normalized to zero mean and unit variance utilizing StandardScaler. Standardization improved general comparability among features and accelerated the rate of model integration.
Outlier treatment: Statistical thresholding, based on z-score analysis and visual inspections using graphical boxplots, was used to locate outliers. Extreme deviation examples (z ¿ 3) were studied for possible data entry mistakes or uncommon but valid patterns of behavior. Only obvious deviations brought on by mistakes in data gathering were eliminated in order to maintain natural variability, as user behavior in e-commerce can be extremely diverse.
|
Year |
Ref. |
Model/Approach |
Main Results |
Limitations |
|
2025 |
[21] |
XAI-Churn TriBoost (XGB+CatB+LGBM); LIME/SHAP |
Acc. 96.4%, F1=90.2; interpretable churn factors |
High compute cost; limited dataset |
|
2025 |
[22] |
Ensemble (KNN, SVC, RF, DT, XGB) + SMOTE |
Acc. 0.90 post-balancing; robust ensemble |
Dataset dependence |
|
2025 |
[23] |
e-Profits (profit-based evaluation; Survival analysis) |
Acc. 87.4%; aligns metrics with business value |
Needs detailed financial data |
|
2025 |
[24] |
PSO-optimized deep model multi-architecture) |
ROC-AUC 0.93; F10.90; strong robustness |
Computationally heavy |
|
2025 |
[25] |
ML models (RF best); billing/usage data |
RF acc. 92%; key churn indicator detection |
Limited generalization |
|
2025 |
[26] |
XGB + SHAP + causal R-Learner |
97% across all metrics; causal interpretability |
Needs diverse data for external validity |
|
2025 |
[27] |
CNN-BiLSTM-CoAttention + SMOTE-ENN |
97.5% acc.; cross-industry generalization |
Complex, low interpretability |
|
2025 |
[28] |
CostLearnGAN (GAN sampling + cost-sensitive) |
Best avg. rank (1.44); scalable |
GAN instability; opaque learning |
|
2024 |
[29] |
CCP-Net (CNN + BiL-STM + Attention) + ADASYN |
Precision 92–96%; outperformed hybrids |
Complex, resource-heavy |
|
2024 |
[30] |
CNN-LSTM for sales forecasting |
Acc. 94.3%; superior hybrid |
Long training (8.5h) |
|
2024 |
[31] |
ChurnNet (1D-CNN + SE + spatial attention) |
Acc. 95.6–97.5%; high generalization |
Complex resampling/training |
|
2024 |
[32] |
GBM + hybrid interpretability (SHAP, local-global) |
Acc. 81%; interpretable and validated |
Moderate predictive power |
|
2024 |
[33] |
Ensemble-Fusion (9 ML models) |
Acc. 5.3%, F1=96.9%, AUC=91% |
Risk of overfitting |
|
2024 |
[34] |
XGB + SMOTE-ENN (IBM, Orange, Iran) |
Acc. 98–99.9%; F199%; stable |
Heavy preprocessing demands |
Dataset balancing
The target variable in the dataset shows a significant class imbalance, which may have a negative impact on the generalizability and performance of predictive models (Figure 2). Minority classes are not well recognized by models that are biased toward the majority class due to imbalanced datasets. Synthetic Minority Over-sampling Technique (SMOTE) was used to address this problem and provide a more fair representation of all classes. Without simply replicating existing data points, SMOTE increases the representation of minority classes by creating synthetic samples through interpolation between minority occurrences. The classes are now roughly balanced, as seen by the post-processed distribution of the target variable in Figure 3.
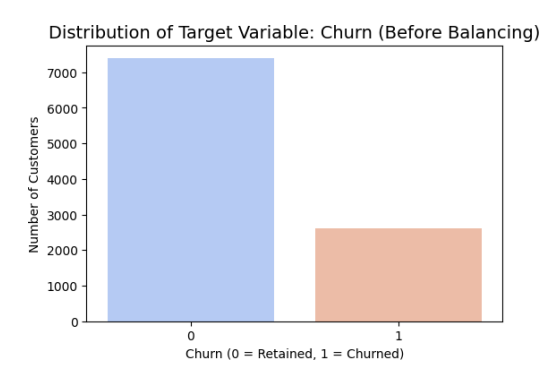
Figure 2. Original distribution of the target variable before balancing.
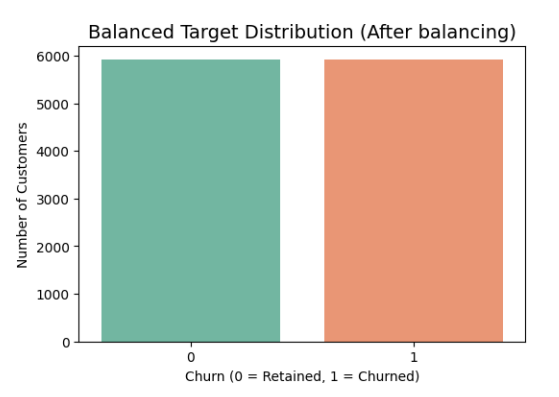
Figure 3. Original distribution of the target variable after balancing.
Dataset splitting
The processed dataset was split into training and testing sets in order to assess model generalization. To ensure that both subsets retained the same class distributions for the churn and non-churn categories, a stratified 80:20 split ratio was used. The testing set acted as an invisible dataset to verify model performance and lower the danger of overfitting, while the training set was used to create and fine-tune the machine learning models. A fixed random seed was used to regulate the randomization process. Table 2 demonstrates the splitting of the dataset into tabular format.
|
Dataset Split |
Values Count |
Percentage |
|
Training |
8,000 |
80% |
|
Testing |
2,000 |
20% |
|
Total |
10,000 |
100% |
Proposed Hybrid Model
The proposed approach estimates client churn in online stores by combining the benefits of CNN, BiLSTM, MLP into an individual hybrid deep neural network architecture. The framework is made for using extract universal tabular relationships, temporal connections, and specific feature structures from commercial and client information. Standard churn algorithms require simple classifiers for machine learning that presume linear division or unity among parameters, such as Random Forest and Logistic Regression. On the other hand, sequential patterns, complex relationships, and natural reliance in time are all part of actual client behavior. So as overcome such limitations, the suggested hybrid framework employs a multiple- branches combining approach, as illustrated in Figure 4, in that one component learns fundamental tabular structures (MLP) and another branch collects sequential patterns (CNN–BiLSTM–Attention), that’s eventually combine in collaborative choices.
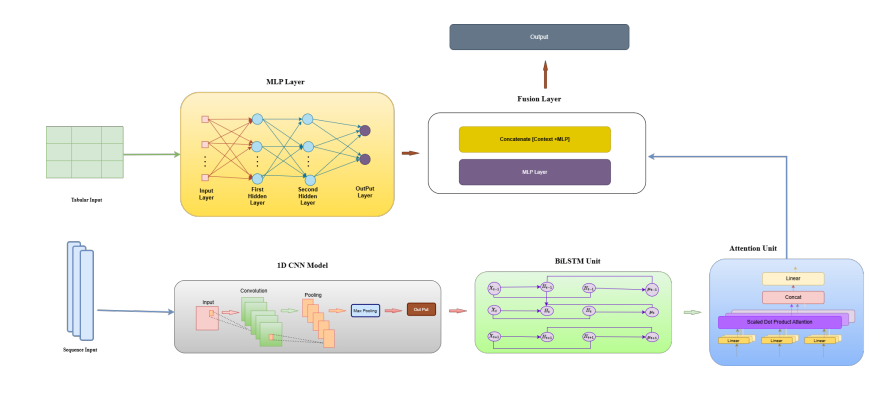
Figure 4. Proposed Hybrid model.
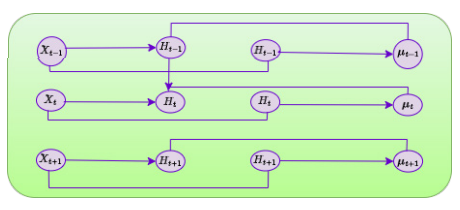
Figure 5. Architecture of BiLSTM model.
The analyzed characteristic structure can be expressed in the following way:

in which N is the total amount of test results or client situations in the collection, and F is the entire amount of input features produced after preprocessing, manipulation, and authentication. The same client’s description of features across all input characteristics is represented by every different vector xi.
The aspect matrix X is represented in both distinct but mutually beneficial formats in order to entirely represent historical associations as well as sequential interdependence:
- Sequential input representation Xseq ∈ RN×F ×1
With the goal to keep up temporal or structured connections among parameters, the successive form of the information is constructed. Because of this arrangement, info can be dealt with using a CNN to find specific characteristics first, and then a BiLSTM network to gather bidirectional background knowledge and dependencies from afar.
The CNN component uses convolutional filters applied across the feature dimension to learn local patterns.
The system can then learn sequential behaviors, like trends or time-related transitions within the data, by using the BiLSTM to model the forward and backward temporal correlations.
- Tabular input representation Xtab ∈ RN×F
In this application, a Multilayer Perceptron (MLP) network directly uses an identical set of features. The algorithm can learn irregular limits on decisions from static or historical characteristics thanks of the MLP’s ability to simulate non-sequential, complex connections among characteristics. Both global interactions between features (recorded by MLP) and regional time dependence (recorded by CNN–BiLSTM) are efficiently learnt and subsequently fused in the combined structure thanks to this parallel visual representation. The following is the definition of the intended vector connected to the source information:

where yi = 1 indicates that the corresponding customer has churned, and yi = 0 indicates keeping of customers. The closely monitored learning process, where the combination of models learns to forecast a possibility of turnover based on the combination of sequential and visual attributes is facilitated by this binary labelling.
CNN-based pattern selection of features
The CNN module utilizes 1D filtering using convolution throughout a feature aspect to identify regional interactions and geographic relationships among features. The following is a syntax for the convolutional process:

- ∗ symbolizes the 1D transformation operator
- W (l) and b(l) These represent the layer’s dimension and bias values l, and
- σ(·) is the ReLU activation function.
After CNN, training data is stabilized and the size reduced using bulk normalization and Maximum Pooling procedures:

The immediate connection between client behaviors, purchase quantity, and satisfaction metrics are illustrated by attribute classifications that are extracted by the stacking CNN layers.
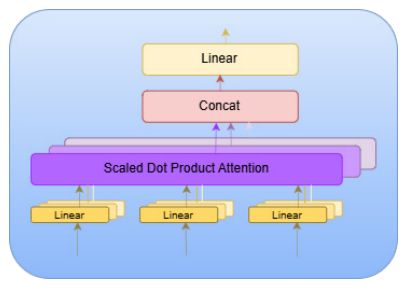
Figure 6. Architecture of Attention.
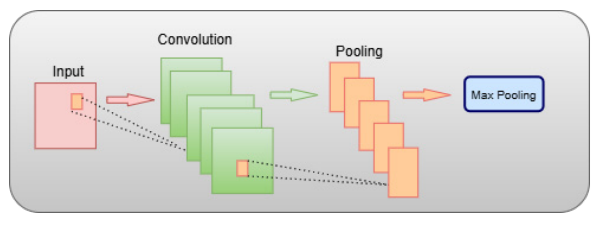
Figure 7. Architecture of CNN.
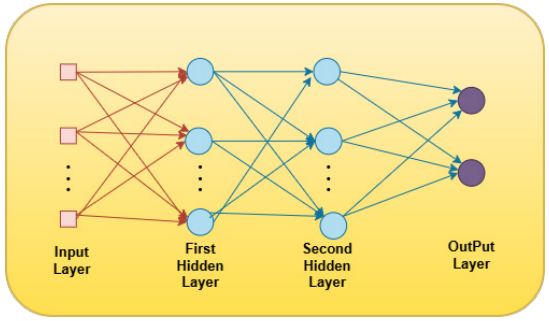
Figure 8. Architecture of MLP model.
Simulation of time-based relationships with BiLSTM
A BiLSTM algorithm, and that properly simulates sequential connections throughout the forward and backward routes, gets fed the CNN output. For each time step t, invisible conditions are calculated by the LSTM. →− ht (forward) and ←− ht (backward) as:


where it, ft, and ot are the input, forget, and output gates, respectively; ct is the cell state, and ? shows adding by elements.
Forward and backward encoded states combine by the BiLSTM as follows:

The framework’s capacity to capture additionally past and prospective background is made possible by its multi-directional flow, so it’s essential for comprehending subsequent customer behaviors (such as the frequency and recentness of transactions).
The mechanism of adding attention
Although BiLSTM records historical relationships, each characteristic or stage of time has the same effect on the outcome. Consequently, every step is given measurable valued weights through the integration of an interactive Attention layer. Given the sequence of hidden states

attention computes:

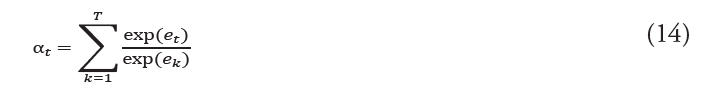
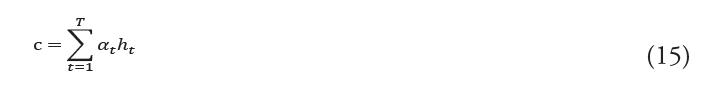
in which c is the contextual vector capturing all of the steps and αt is the focus weight for step t.
The system may focus on particularly instructive trends thanks to this device.
Tabular figure recognition MLP branch
Original tabular properties are processed by a Multi-Layer Perceptron (MLP) concurrently to the following branch. It captures fluctuations between static organizational variables like average stay duration, total costs, quantity of support contact, and profile data. Let the input to the MLP be Xtab. Below is an expression for how things change using each hidden layer:

where ?(·) denotes the ReLU activation. Multi-step normalization and withdrawal correction are used to speed up convergence and avoid overfitting.
Enduring classification as well as interface fusion
A unified visualization is created by combing the background vector c from the BiLSTM Attention– branches and the latent vector z(L) from the MLP branch:

Both of them horizontal connections and time-sequential conclusions have been detected by this fused matrix of features. Prior to the last triangle output step, it passes through fully connected layers with dropping out:

where yˆ ∈ [0, 1] indicates the projected possibility of customer attrition.
Efficiency and the loss mechanism
Simple loss of cross-entropy is used for training the algorithm end-to-end: The meaning of the dual cross-entropy loss is:
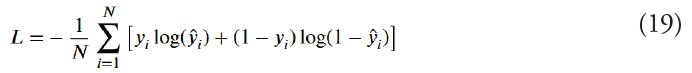
Given an adaptable rate of learning of 1 × 10⁻³, the Adam algorithm is used to perform optimization, ensuring quick and steady growth. The Artificial Minority Over-sampling methodology (SMOTE), which combines churn and random examples, is used during preprocessing of information to fix class imbalance.

Baseline models
Logistic regression: A popular statistical approach for binary classification problems is Logistic Regression [35]. It is a standard benchmark in predictive modeling because it is highly interpretable and predicts a probability of an event based on a linear combination of input features. L1 (Lasso) and L2 (Ridge) penalties are regularization approaches that were used to manage model complexity, decrease overfitting, and enhance generalization on unseen data. LR provides a strong benchmark for comparison despite its simplicity due to its computational speed and ease of usage, especially in cases where the correlations between features and the target variable are roughly linear. Because of its transparency, feature contributions may be clearly understood, which is beneficial for data-driven decision-making.
Random forest: Random Forest (RF) [36] is an ensemble-based decision tree algorithm which applies random subsets of data and characteristics to construct several trees. The forecasts of these trees are then integrated to increase accuracy and stability. In addition to minimizing overfitting and lowering variance, this method successfully captures complex feature interactions and nonlinear relationships. Also, RF-based feature importance metrics provide the spotlight on the most important variables, which are useful for data-driven interpretation. For best prediction performance while maintaining computational efficiency, hyperparameters such as the number of trees, maximum depth, and minimum samples per leaf were carefully adjusted.
Gradient Boosting: A gradient-boosting ensemble algorithm called Extreme Gradient Boosting (XGBoost) [37] generates decision trees one after the other, each one attempting to fix the mistakes of the one before it. It employs regularization to control model complexity and is very effective and scalable for large datasets due to its parallel processing capabilities. Because of its exceptional ability to simulate intricate nonlinear relationships and high- dimensional feature spaces, XGBoost is especially well-suited for tabular data. This study established a strong baseline for comparison with more sophisticated models by optimizing hyperparameters such as learning rate, maximum tree depth, and number of estimators to strike a balance between generalization and prediction accuracy.
Results and Discussion
This section gives a full analysis of the experimental results from the proposed Hybrid Model compared to the baseline classifiers. This part carefully explains the quantitative and qualitative results, showing how well the model works, how quickly it converges, and how easy it is to understand. It starts with a thorough description of the experimental setting, then moves on to a comparison of standard machine learning baselines. The next subsections look at how stable the model’s convergence is, how well it does on both basic and advanced evaluation metrics, and how easy it is to understand based on SHAP-based feature importance visualization. Also, specialized tests like the ROC–PR curve analysis give information about how strong a classification is, and error analysis finds possible problems and sources of misclassification. In general, this section’s goal is to prove that the proposed hybrid framework for predicting customer churn in e-commerce settings is efficient, can be used in many situations, and is reliable.
Experimental setup and software configuration
All experiments in this study were performed with Google Colab Premium, which offers a scalable and GPU-accelerated framework for deep learning model construction. To train the suggested hybrid architecture quickly, an NVIDIA A100 Tensor Core GPU with 40 GB of VRAM was used. This design made sure that the computational throughput was as high as possible, which made it possible to train sophisticated deep neural networks like the hybrid model in a reasonable amount of time. The Colab environment used Linux as its backend and Python 3.10 as its main programming language. To keep the results consistent, all trials were done in a controlled runtime session. For the software stack, necessary libraries from the Python ecosystem were used. Data preprocessing, handling, and visualization were done using Pandas, NumPy, Mat- plotlib, and Seaborn. Machine learning models and evaluation criteria were executed on the scikit-learn framework, which offered standardized interfaces for both baseline models like Logistic Regression, Random Forest, and XGBoost. The XGBoost version 1.7 library was used in particular for the gradient boosting part, and TensorFlow version 2.12 and Keras were used for the building and training of the hybrid deep learning. In addition, the SHAP package was added to derive model interpretability information and feature importance charts. The experiments were conducted on the E-Commerce Customer Churn Prediction Dataset from Kaggle, which consists of customer behavioral features and transactional features. Data preprocessing - handled missing values, categorical variables were label encoded, and normalization with StandardScaler was done to improve model convergence. All models were trained fixing the train-test ratio as 80-20, and the evaluation metrics used are Accuracy, Precision, Recall, F1-score, ROC-AUC, to have a complete assessment of predictive performance. This powerful experimental design provided an opportunity to consistently compare baseline models to the proposed hybrid deep learning approach, as importantly, this replicates computationally as well as scientifically.
Comparative evaluation using performance metrics
We used several standard performances as metrics to compare the proposed hybrid model with the baseline classifiers, namely Logistic Regression, Random Forest, and XGBoost. This was done to evaluate how well the hybrid model could predict fully. Accuracy, Precision, Recall, and F1-score were the main things that the analysis looked at. These together provide a nice picture of the reliability, generalizability, and strength of the model. This framework not only shows how much better the suggested hybrid model is compared to others, but it also shows how it may help solve the problem of false positives and false negatives in the prediction of customer churn.
Table 4 shows a side-by-side comparison of the performance measures for all the baseline and proposed models on the E-commerce Customer Churn dataset. The results clearly show that the Proposed Hybrid Model does far better than the baseline classifiers on all of the evaluation criteria. The random forest framework was the best classical machine learning model overall, with an accuracy of 0.80 and an F1-score of 0.58. This shows that it can find modest nonlinear correlations in consumer behavior. XGBoost had an accuracy of 0.79 and an F1-score of 0.57, which was similar to that of other models. This was because gradient boosting is based on the ensemble learning technique. However, it had a recall of 0.54, which means it missed some actual churn cases. Logistic regression (Logit) is the simplest model, and it achieved an accuracy of 0.78 and an F1 score of 0.50, which means the model, is not able to deal with non-linear dependencies among features of the dataset. The proposed hybrid model, on the other hand, provided the best results in all terms: Accuracy = 0.87, Precision = 0.88, Recall = 0.88, and F1-Score = 0.88. This means that it was far superior in the business of detection and also in prediction. The attempts to combine CNN layers showed the right way to identify local feature patterns, and BiLSTM + Attention mechanism showed better ability to understand customer behavior from time to time and in various contexts. The last layer of the MLP refined the higher-level abstractions in order to achieve the best classification. The model’s balanced ability to reduce both false positives and false negatives is seen by the continuously high precision and recall numbers. Overall, these results show that the hybrid architecture is better at generalizing and being durable. This makes it a more dependable and scalable choice for real-world churn prediction systems.
|
Model |
Accuracy |
Precision |
Recall |
F1-Score |
|
Logistic Regression |
0.78 |
0.62 |
0.42 |
0.50 |
|
Random Forest |
0.80 |
0.63 |
0.54 |
0.58 |
|
XGBoost |
0.79 |
0.61 |
0.54 |
0.57 |
|
Proposed Hybrid Model |
0.87 |
0.88 |
0.88 |
0.88 |
Convergence behavior and training stability of the proposed hybrid model
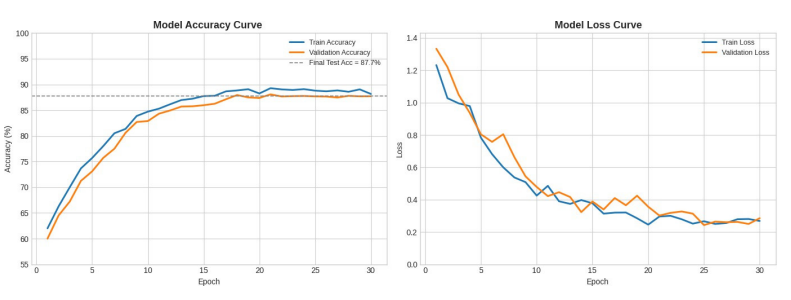
Training stability and the convergence behavior of a deep learning model provide valuable information about learning efficiency, generalization ability, and training stability of a model. However, the result of training the proposed hybrid model showed an increasing and steady result of the training result through the training epochs, which indicated a good gradient optimization and the suitable tuning of the parameters. Both accuracy and loss showed coherent progression patterns, resulting from the fact that the model was able to capture pertinent data representations without any oscillation or divergence. The hybrid architecture with CNN for the local feature extraction, BiLSTM with Attention for the sequential context learning, and MLP for the final classification helped to achieve stable convergence that reduced the occurrence of overfitting. The consistent decrease in loss and the steady increase in accuracy indicate that this model was able to manage the bias and variance suitably when training throughout the cycle. Overall, this convergent pattern of stability shows that the proposed hybrid architecture performs optimal learning behavior with high reliability and forecast consistency. The convergence characteristics of the proposed hybrid model are shown in Figure 9, which presents a great impression of the change in accuracy and the loss of the network during training. The accuracy curve undergoes a steady and progressive increase in the first epoch, before gradually leveling off after around the 20th epoch. This smooth pattern of convergence, while the accuracy curves of training and validation are very close, means that the model was able to maintain a steady learning rate, and it is not overfitting. The final stabilized accuracy of roughly 87.7% shows the good generalization ability and robustness of the proposed model in terms of the unseen data samples. Also, the loss curve shows that there is a smooth and monotonic decrease during both training and validation phases, which are indicative of effective optimization and good gradient propagation. In addition, the fact that there were no significant oscillations or divergence of the validation loss suggests that the learning process of the model was stable and well regularized. Also, the stable decline in loss indicates effective learning of the complex hierarchical dependency of the target by the hybrid architecture consisting of CNN for spatial feature extraction, BiLSTM with Attention for temporal/contextual representation, and MLP for final classification without misalignment. The small difference between training and validation loss over the epochs indicates the good performance of the model in terms of bias and variance control. This illustrates that the regularization techniques and architecture design helped to avoid the overfitting scenario while allowing the best convergence. Other than that, the convergence trend shows that the proposal hybrid model not only fulfilled effective learning but also demonstrated persistence in long-term training; appealing to its effectiveness and adaptability for practical churn prediction applications.
Evaluation through precision–recall and ROC dynamics
The suggested hybrid model’s discriminative power and generalization performance were further assessed through comprehensive trials utilizing Receiver Operating Characteristic (ROC) and Precision–Recall (PR) analyses. These two parallel evaluation metrics provide an in-depth understanding of the model’s accuracy, sensitivity, and resilience over a variety of categorization criteria. Although ROC curves (Figure 11) reflect the balance between the true positive rate (TPR) and false positive rate (FPR), which indicates the model’s overall diagnostic capacity, PR curves are particularly useful in situations where there is a class imbalance. For both classes, the hybrid model’s performance is consistently consistent and dependable, as shown by the PR graphs in Figure 10. The average precisions (APs) of Not Churn (Class 0) and Churn (Class 1) are about 0.99, showing a nearly ideal recall- precision balance. The curves for both classes are very near the upper-right region of the image, confirming good predictive consistency and few false positives. According to the behavior, even in situations when there can be a class imbalance, the hybrid model successfully separates clients who have churned from those who have not. The combined PR and ROC findings show the suggested hybrid model has great stability, generalization ability, and predictive performance, with an overall accuracy of about 87.7%. The model is a reliable and strong option for practical churn prediction applications since it combines multiple feature categories to increase its sensitivity, specificity, and precision.
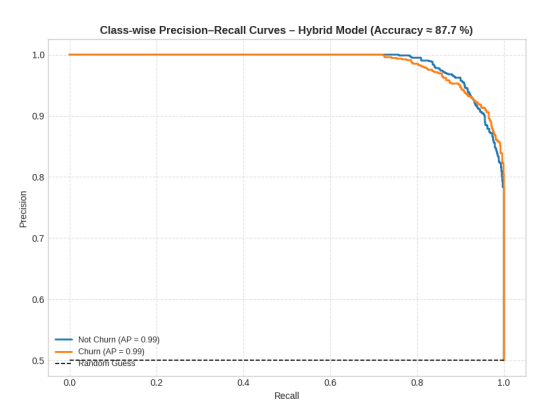
Figure 10. Class-wise Precision–Recall (PR) curves of the proposed hybrid model for Class 0 and Class 1.

Figure 11. Class-wise Receiver Operating Characteristic (ROC) curves of the proposed hybrid model for Class 0 and Class 1.
Error analysis
We performed an error analysis using the confusion matrix to have a better understanding of the suggested hybrid model’s limitations. The method enables misclassifications to be analyzed by class, giving a better understanding of the regions where the model performs poorly, even if the overall classification accuracy is still very good. By comparing false positives and false negatives, one can examine the distribution of prediction errors. This provides crucial information for eventual optimization and improvement of the model’s churn predicted power. A comprehensive review of the classification performance of the suggested hybrid model is provided by the confusion matrix in Figure 12. The model demonstrated good classification performance across both classes, correctly identifying 901 customers as Not Churn and 853 customers as Churn out of 2,000 validation samples. Nevertheless, 138 real Churn cases were mistakenly forecasted as Not Churn, and 108 samples were misclassified as Churn despite belonging to the Not Churn category. Given the difficulty of predicting customer behavior, this leads to a misclassification rate of roughly 6.2% for Not Churn and 7.6% for Churn, both of which are rather low.
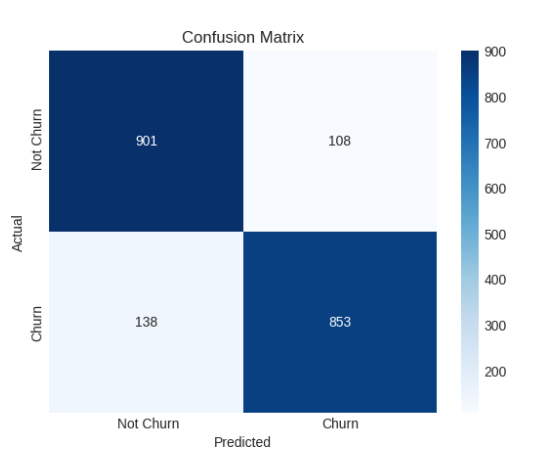
Figure 12. Confusion matrix of the proposed hybrid model for churn prediction.
A key aspect of reliable customer churn analytics in practical implementation is the model’s clear lack of bias toward either class, as evidenced by the adequately balanced distribution of mistakes. When a customer’s recent activities and engagement metrics overlap between churning and non-churning patterns, these misclassified cases most likely reflect borderline or ambiguous user behaviors. Even for human analysts, complete discrimination is difficult because of this ambiguity. Crucially, the bulk of examples are concentrated along the confusion matrix’s diagonal, confirming the suggested hybrid framework’s resilience and capacity for generalization. Overall, the error analysis confirms the suggested hybrid model’s high effectiveness in churn prediction while preserving an admirable balance between recall and precision. Its potential as a reliable and useful decision-support system for proactive client retention efforts is further reinforced by the comparatively low misclassification rates.
Comprehensive performance evaluation across core and advanced metrics
Further, in order to assess the effectiveness of the proposed hybrid model, it was completely compared with the baseline classifiers using simple and complex performance measures. The important measures like Accuracy, Precision, Recall, and F1-Score would measure the overall predictiveness and balance of classification of the model. Further, Jaccard Index, Mathews Correlation Coefficient (MCC), and Cohen’s Kappa were also used to make a more objective judgment on the statistical understanding of agreement, strength, and distribution of errors of the models. The performance analysis of the proposed hybrid framework and the baseline models adopts such a multi-perspective view, which makes both fair and holistic.
Figure 13 illustrates the comparison of the proposed hybrid model against the baseline classifiers (Random Forest, Logistic Regression, and XGBoost) in terms of four major evaluation metrics (Accuracy, Precision, Recall, and F1-Score). The comparison graph is clear enough to see how strong and balanced the learning ability is for the proposed model, as it is outperforming every metric. The baseline models showed that Random Forest had the best performance, with an overall accuracy of 0.80 and an F1-score of 0.58. It was able to model moderate non-linear relationships for customer churn behavior. XGBoost achieved an accuracy of 0.79 and an F1 score of 0.57. This is because it is based on a gradient boosting ensemble, but its recall has been only 0.54, which means it missed some churn instances. As a linear model, Logistic Regression had the lowest recall (0.42) and F1 Score (0.50), showing that it is unable to capture the rich feature dependencies of the dataset.

Figure 13. Side-by-side comparison of core evaluation metrics (Accuracy, Precision, Recall, and F1- Score) for the baseline models and the Proposed Hybrid Model.
The Proposed Hybrid Model achieved much better performance than all baselines with Accuracy = 0.87, Precision = 0.88, Recall = 0.88, and F1-Score = 0.88. These consistent values across all metrics show that the hybrid framework was able to generalize well with very little bias–variance trade-off. The CNN layers captured spatial relationships, the BiLSTM with attention accurately represented temporal and con- textual dependencies, and the MLP component improved the feature abstractions for the best classification. Overall, the proposed hybrid architecture works well for predicting customer churn. It is stable, reliable, and very good at telling the difference between different types of customers. The advanced evaluation metrics depicted in Figure 14 offer a more profound statistical analysis of the discriminative efficacy and resilience of the proposed hybrid model in contrast to the baseline classifiers. Adding the Jaccard Index, Matthews Correlation Coefficient (MCC), and Cohen’s Kappa to the analysis is going beyond the normal accuracy-based measures and painting a picture of more details about the accuracy of the model and how well the classifications match. The Proposed Hybrid Model is consistent in getting better scores on each of the three scores, Jaccard = 0.776, MCC = 0.754, and Kappa = 0.754. This shows that it is very good at making predictions and that there is a lot of agreement between classes. The high Jaccard value indicates that the hybrid model produced more accurate and overlapping predictions between positive churn cases and predicted churn cases. This indicates that it is better at finding minority churn patterns. The large value of the MCC also indicates that the model fairly treats both the positive class and the negative class, which implies that there is little bias and that there is a high degree of association between the predicted and actual outcome. The high Kappa score also reports that there is much agreement above and beyond chance, which provides proof that the model is dependable for churn prediction in the real world. Random Forest had moderate results (Jaccard = 0.63, MCC = 0.45, Kappa = 0.45) amongst the baselines. The results of XGBoost, Logistic Regression are slightly less than the results of Logistic Regression, which indicates that they weren’t very good at making balanced predictions. The hybrid model, on the other hand, shows a consistent outperformance of all the advanced metrics, which is a good indicator that it is more robust and is able to better generalize and form better decision boundaries. This makes it more reliable and accurate as a predictive framework for analyzing customer churn. Finally, after an extensive analysis of both basic and extended evaluation measures, the improved prediction performance and robustness of a hybrid model are confirmed. Its scores are significantly better in Accuracy, Precision, Recall, F1-Score, Jaccard, MCC, and Kappa illustrate that it can generalize well, classify reasonably, and make decisions on the basis of a fair and reliable basis. These results indicate that the hybrid model architecture is able to accurately capture complicated behavioral patterns and will therefore be a strong and reliable model for predicting customer churn.
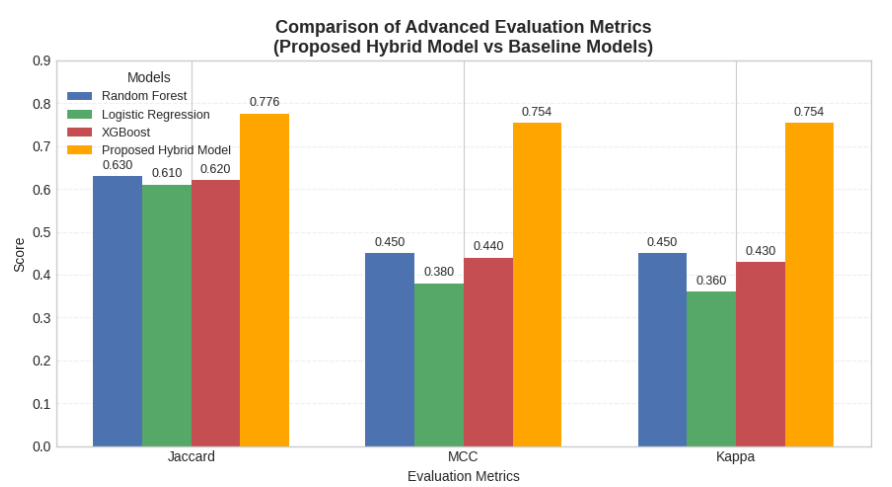
Figure 14. Comparison of advanced evaluation metrics (Jaccard Index, Matthews Correlation Coefficient (MCC), and Cohen’s Kappa) between the baseline models and the Proposed Hybrid Model.
Feature importance and model explainability based on SHAP analysis
SHAP analysis was used to make the proposed hybrid model easier to understand and to figure out how each feature affects churn prediction. SHAP gives a single measure of how important each feature is by measuring how much each variable affects the model’s output. SHAP values are different from traditional feature importance scores because they show both the size and direction of each feature’s effect. This makes it easy to understand how the model made its decision. This analysis helps find the most important behavioral and transactional factors that are causing customers to leave the dataset.
Figure 15 shows the SHAP summary plot, which shows how each feature in the proposed hybrid model for predicting customer churn contributes and how important it is compared to other features. The SHAP values on the horizontal axis show how much and in what direction each feature affects the model output. Positive values make churn more likely, while negative values make it less likely. The color gradient shows the feature values, with red showing higher feature magnitudes and blue showing lower ones. The visualization clearly shows that LastInteractionDaysAgo is the most important variable. Higher values (in red) are linked to a higher chance of churn, which means that customers who haven’t interacted with the company in a while are more likely to leave. SupportTickets also has a strong positive link to churn, which means that users who Contacting support frequently may not be satisfactory. On the other hand, some attributes are HasPremiumMembership, TotalPurchases, and (Tenure Months) have negative SHAP effects, i.e. that a higher value of these: Ratings reduce the chances of customer churning. This indicates that long-time customers and customers with the highest service prices will be less inclined to cancel services. Other values are AveragePurchaseValue; TotalSpend and MonthlySpend moderate size, but stable, effect of important predictors It does mean that if people can afford to spend more money and if they spend it more frequently, this is a factor in A higher level of customer retention, Device-related and city-specific features (e.g., Device Used Tablet, City East Joel) exhibit minimal impact, underscoring the dominance of behavioral and transactional characteristics over demographic factors. Overall, the proposed hybrid model can not only in addition to delivering high interpretability, which is crucial in developing effective churn mitigation strategies, it also delivers high predictive accuracy.
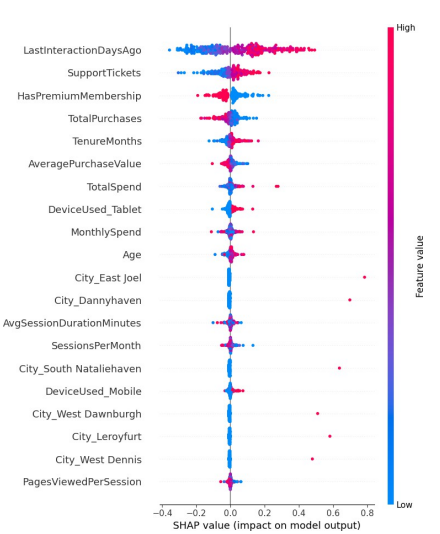
Figure 15. SHAP summary plot illustrating the feature importance and contribution of each variable in the proposed hybrid model.
Comparative analysis and discussion
Table 5 shows that recent studies have compared machine learning methods for predicting customer churn across different datasets and industries. Schmitt [38] performed an extensive analysis of structured business datasets, specifically Credit Risk, Insurance Claims, and Marketing data sourced from UCI and Kaggle repositories. Their results showed that traditional ensemble models, especially the Gradient Boosting Machine (GBM), were more accurate than deep learning methods for structured tabu- lar data, with accuracy scores ranging from 71.2%. This result showed that tree-based ensembles are a reliable way to do business analytics that is easy to understand. Conversely, Dias and Antonio [39] concentrated on a proprietary Software-as-a- Service (SaaS) environment utilizing integrated license and incident datasets. Their tests on different models showed that XGBoost (XGB) was the best one, with an accuracy rate of 79.6% and a strong recall rate for finding people who might leave. The research showed that boosting algorithms can work with real-world business datasets. Building on the integration of business intelligence, [3] Shobana et al. [3] suggested a hybrid SVM + ANN (BP Neural Network) model for e-commerce behavioral data obtained through web crawling. Their model got 82.64% right, which proves that combining machine learning with business-driven heuristics can effectively capture complex consumer purchasing dynamics. Lastly, Chen et al. [40] used the IBM Telco Customer Churn data set and a Feedforward Neural Network (FNN) with 82.26% accuracy and F1 balancing. Their research was focused on the power of much simpler architectures of neural networks when combined with cost-sensitive optimization in telecommunications analytics. The Proposed Hybrid Model (CNN - BiLSTM + Attention + MLP) on the other hand, has a far superior accuracy rate reaching 87.7%. It does this by effectively capturing spatial, sequential and contextual dependencies in the behavior of customers, making it better than previous methods. This hybrid approach demonstrates that it could learn better features and generalize better and thus is strong and scalable to be used in a practical world churn prediction application. In short, as per the results and analyses, it is clearly evident that the proposed Hybrid Model performs better and is more reliable than the traditional machine learning methodologies. The model achieved exceptional accuracy and fair classification accuracy, and in the process guaranteed the matching of the convergence behavior and interpretability. More advanced tests, such as ROC-PR curves and analysis of errors, showed that it was even more reliable with very little bias in finding churn cases. Comparisons of the models with extant studies highlighted the superiority of the model in terms of generalization and various applications to real-world business data. In general, the suggested hybrid architecture does a good job of putting spatial, temporal, and contextual learning into play, making it a reliable and scalable choice for systems that have to make predictions about customer churn
|
Reference |
Dataset |
Model |
Accuracy (%) |
|
[38] |
Credit Risk, Insurance Claims, and Marketing datasets (UCI & Kaggle) |
Gradient Boosting Machine (GBM) |
71.2 |
|
[39] |
Proprietary SaaS datasets (Licenses + Incidents) |
XGBoost (XGB) |
79.6 |
|
[3] |
Proprietary e-commerce behavioral dataset (Web-crawled transactions) |
Hybrid SVM + ANN (BP Neural Network) |
82.64 |
|
[40] |
IBM Telco Customer Churn Dataset |
Feedforward Neural Network (FNN) |
82.26 |
|
Ours |
E-commerce Customer Churn Dataset(Kaggle) |
CNN → BiLSTM + Attention + MLP (Proposed Hybrid Model) |
87.7 |
Conclusion
For efficient and comprehensible customer churn prediction in e-commerce, this study created and validated a hybrid deep learning model that combines CNN, BiLSTM with Attention, and MLP architectures. The model outperformed conventional machine learning techniques like Logistic Regression, Random Forest, and XGBoost in its ability to capture intricate geographical, temporal, and contextual correlations within customer behavioral data. The system demonstrated good interpretability, stability, and generalization, with an overall accuracy of 87.7% and a balanced precision-recall performance. The study based on SHAP found that characteristics such as last inter- action time, support tickets, and membership duration had a significant impact on churn odds. With the help of this data, managers can develop targeted retention plans with powerful management insights. The model’s superiority in terms of predictive performance and real-world applicability was validated by comparison with current investigations. In order to improve business-driven decision support systems, future research can expand this framework by adding multimodal data sources, robust explainability methodologies, and cost-sensitive optimization.
References
2. Zhang X, Ghosh A, Ali DA. Research on marketing strategy management based on customer retention. Academic Journal of Management and Social Sciences. 2024;6(2):66–70.
3. Shobana J, Gangadhar C, Arora RK, Renjith PN, Bamini J, devidas Chincholkar Y. E-commerce customer churn prevention using machine learning-based business intelligence strategy. Measurement: Sensors. 2023 Jun 1;27:100728.
4. Jahan I, Sanam TF. A comprehensive framework for customer retention in E-commerce using machine learning based on churn prediction, customer segmentation, and recommendation. Electronic Commerce Research. 2024 Dec 26:1–44.
5. Li A, Yang T, Zhan X, Shi Y, Li H. Utilizing Data Science and AI for Customer Churn Prediction in Marketing. Journal of Theory and Practice of Engineering Science. 2024 May 27;4(05):72–9.
6. Koppolu HK. Data-Driven Strategies for Optimizing Customer Journeys Across Telecom and Healthcare Industries. International Journal Of Engineering And Computer Science. 2021 Dec;10(12).
7. Boozary P, Sheykhan S, GhorbanTanhaei H, Magazzino C. Enhancing customer retention with machine learning: A comparative analysis of ensemble models for accurate churn prediction. International Journal of Information Management Data Insights. 2025 Jun 1;5(1):100331.
8. Peng K, Peng Y, Li W. Research on customer churn prediction and model interpretability analysis. PLoS One. 2023 Dec 8;18(12):e0289724.
9. Schäfers A, Bougioukos V, Karamatzanis G, Nikolopoulos K. Prediction-led prescription: Optimal Decision-Making in times of turbulence and business performance improvement. J Bus Res. 2024 Sep 1;182:114805.
10. Boukrouh I, Azmani A. Explainable machine learning models applied to predicting customer churn for e-commerce. Int J Artif Intell;2252(8938):8938.
11. Adeniran IA, Efunniyi CP, Osundare OS, Abhulimen AO, OneAdvanced U. Implementing machine learning techniques for customer retention and churn prediction in telecommunications. Computer Science & IT Research Journal. 2024;5(8):2011–25.
12. Imani M, Joudaki M, Beikmohamadi A, Arabnia HR. Customer Churn Prediction: A Review of Recent Advances, Trends, and Challenges in Conventional Machine Learning and Deep Learning. 2025.
13. Lin J. Application of machine learning in predicting consumer behavior and precision marketing. PLoS One. 2025 May 6;20(5):e0321854.
14. Barkho W, Carnes NC, Kolaja CA, Tu XM, Boparai SK, Castañeda SF, et al. Utilizing machine learning to predict participant response to follow-up health surveys in the Millennium Cohort Study. Sci Rep. 2024 Oct 28;14(1):25764.
15. Zhou Z, Qiu Z, Niblett B, Johnston A, Schwartzentruber J, Zincir-Heywood N, et al. A boosting approach to constructing an ensemble stack. In: European Conference on Genetic Programming (Part of EvoStar). Cham: Springer Nature Switzerland; 2023 Mar 29. pp. 133–48.
16. Yoon T, Kang D. Multi-Modal Stacking Ensemble for the Diagnosis of Cardiovascular Diseases. J Pers Med. 2023 Feb 20;13(2):373.
17. Song L, Langfelder P, Horvath S. Random generalized linear model: a highly accurate and interpretable ensemble predictor. BMC Bioinformatics. 2013 Jan 16;14:5.
18. Chinnaraju A. Explainable AI (XAI) for trustworthy and transparent decision-making: A theoretical framework for AI interpretability. World Journal of Advanced Engineering Technology and Sciences. 2025;14(3):170–207.
19. Prabadevi B, Shalini R, Kavitha BR. Customer churning analysis using machine learning algorithms. International Journal of Intelligent Networks. 2023 Jan 1;4:145–54.
20. Diri EE, Diri GO, Elliot KN, James NH, Owhonda RC, Nbaakee LG. Behavioural Analysis and Churn Forecasting in Retail Banking Using Machine Learning Models. 2025.
21. Asif D, Arif MS, Mukheimer A. A data-driven approach with explainable artificial intelligence for customer churn prediction in the telecommunications industry. Results Eng. 2025 Jun 1;26:104629.
22. Bhuria R, Gupta S, Kaur U, Bharany S, Rehman AU, Hussen S, et al. Ensemble-based customer churn prediction in banking: a voting classifier approach for improved client retention using demographic and behavioral data. Discov Sustain. 2025 Jan 14;6(1):28.
23. Manzoor A, Qureshi MA, Kidney E, Longo L. e-Profits: A Business-Aligned Evaluation Metric for Profit-Sensitive Customer Churn Prediction. arXiv preprint arXiv:2507.08860. 2025 Jul 9.
24. Sedighimanesh, M.; Sedighimanesh, A.; Zandhessami, H. Optimizing Hyperparameters for Customer Churn Prediction with PSO-Enhanced Composite Deep Learning Techniques. Journal of Information Systems and Telecommunication (JIST). 2025:13:91–110.
25. Mohaimin MR, Das BC, Akter R, Anonna FR, Hasanuzzaman M, Chowdhury BR, et al. Predictive Analytics for Telecom Customer Churn: Enhancing Retention Strategies in the US Market. Journal of Computer Science and Technology Studies. 2025 Jan 17;7(1):30–45.
26. Li Y, Yan K. Prediction of bank credit customers churn based on machine learning and interpretability analysis. Data Science in Finance and Economics. 5(1):19–34.
27. Yang C, Xia G, Zheng L, Zhang X, Yu C. Customer Churn Prediction Based on Coordinate Attention Mechanism with CNN-BiLSTM. Electronics. 2025 May 8;14(10):1916.
28. Adiputra IN, Wanchai P, Lin PC. Optimized customer churn prediction using tabular generative adversarial network (GAN)-based hybrid sampling method and cost-sensitive learning. PeerJ Computer Science. 2025 Jun 19;11:e2949.
29. Liu X, Xia G, Zhang X, Ma W, Yu C. Customer churn prediction model based on hybrid neural networks. Scientific Reports. 2024 Dec 28;14(1):30707.
30. Ma X, Fan S. Research on Cross-national Customer Churn Prediction Model for Biopharmaceutical Products Based on LSTM-Attention Mechanism. Academia Nexus Journal. 2024 Nov 20;3(3).
31. Saha S, Saha C, Haque MM, Alam MG, Talukder A. ChurnNet: Deep learning enhanced customer churn prediction in telecommunication industry. IEEE access. 2024 Jan 4;12:4471–84.
32. Poudel SS, Pokharel S, Timilsina M. Explaining customer churn prediction in telecom industry using tabular machine learning models. Machine Learning with Applications. 2024 Sep 1;17:100567.
33. He C, Ding CH. A novel classification algorithm for customer churn prediction based on hybrid Ensemble-Fusion model. Scientific Reports. 2024 Aug 30;14(1):20179.
34. Ouf S, Mahmoud KT, Abdel-Fattah MA. A proposed hybrid framework to improve the accuracy of customer churn prediction in telecom industry. Journal of Big Data. 2024 May 9;11(1):70.
35. Hosmer Jr DW, Lemeshow S, Sturdivant RX. Applied logistic regression. Hoboken, NJ: John Wiley & Sons; 2013.
36. Rigatti SJ. Random forest. Journal of insurance medicine. 2017 Jan 1;47(1):31–9.
37. Chen T, Guestrin C. XGBoost: a scalable tree boosting system. In: Proceedings of the 22nd ACM SIGKDD International Conference on Knowledge Discovery and Data Mining. New York (NY): ACM; 2016. p. 785–94.
38. Schmitt M. Deep learning in business analytics: A clash of expectations and reality. International Journal of Information Management Data Insights. 2023 Apr 1;3(1):100146.
39. Dias JR, Antonio N. Predicting customer churn using machine learning: A case study in the software industry. Journal of Marketing Analytics. 2025 Mar;13(1):111–27.
40. Chen X, Lv B, Wang M, Xiang X, Wu S, Luo S, Zhang W. A Comprehensive Analysis of Churn Prediction in Telecommunications Using Machine Learning. arXiv preprint arXiv:2509.22654. 2025 Jul 15.