Abstract
Neuroendocrine neoplasms (NENs) are a heterogeneous group of tumors that occur in many organs. The routinely used IHC markers for NEN diagnosis include chromogranin A (CgA), synaptophysin, Ki67 and CD56. These markers have limitations including a lack of correlation to clinical outcomes and their presence in non-tumor tissue. Identification of additional markers in NEN tissue has the potential to improve clinical outcomes. We generated a detailed tumor profile of tissue from a patient with a grade 3 colonic NEC using phenotypic cancer markers and correlated this with the marker expression of the corresponding patient circulating tumor cells. Immunohistochemical analysis was carried out on tumor and adjacent normal tissue and on corresponding circulating tumor cells from patient blood. Differences in the expression of twelve markers were found in tumor relative to adjacent non-tumor tissue, including higher levels of five markers in tumor tissue (Ki67, synptophysin, CgA, CD56 and CD44) and lower or undetectable levels of seven markers (Ep-CAM, CDX-2, E-cadherin, β-catenin, pan-cytokeratin, CK7 and CK20), relative to adjacent normal tissue. The corresponding CTC marker profile matched that of the tumor tissue, suggesting that the marker expression of CTCs may indicate tumor status. Our data support the concept that cells within the tissue had undergone transition to a mesenchymal phenotype, generating CTCs. The utility of individual patient marker profiling of tumor and CTCs has potential for prognostic disease stratification and needs to be further investigated in more patients.
Keywords
Neuroendocrine tumor, tumor marker profile, circulating tumor cells
Abbreviations
NEN: Neuroendocrine Neoplasm; NEC: Neuroendocrine Carcinoma; CTC: Circulating Tumor Cell; EMT: Epithelial-Mesenchymal Transition
Introduction
Neuroendocrine neoplasms (NENs) are characterized by the expression of neuroendocrine markers, usually demonstrable by immunohistochemistry. A common site of NENs is the gastrointestinal tract. NENs are classified as well-differentiated tumors (NETs) and poorly differentiated carcinomas (NECs) according to the 2019 WHO classification [1]. NECs are small cell type or large cell type, both poorly differentiated and both with mitotic rated and Ki?67 >20%. The recent 2019 WHO classification distinguishes well differentiated G3 NETs (Mitotic rate of ³ 20/10HPF and Ki-67 >20%) from poorly differentiated NECs. NENs stage groupings are based on the embryonic origin of the primary tumor, tumor size, extent of invasion, nodal status and distal metastasis according to ENETS (European Neuroendocrine Tumor Society) and AJCC (American Joint Committee on Cancer) 8th edition staging systems [2,3].
NEN diagnosis relies on histological morphology and immunohistochemical criteria. Current established diagnostic immunohistochemical markers include chromogranin A (CgA), synaptophysin (reviewed in [4,5]), Ki-67 a marker of proliferation and CD56. These markers however pose many limitations including their lack of correlation to clinical outcomes or their presence in non-tumor tissue. Thus, the management of neuroendocrine tumors is hampered by a lack of understanding of the underlying biology, lack of biomarkers and insensitivity of detection methods [6].
Less is known about high grade NECs than differentiated NETs [7]. A recent study of high-grade gastrointestinal NECs indicated that 64.6% patients presented at stage IV with advanced disease and poor overall survival of 13.3 months [8]. Several studies have shown that gastrointestinal NECs are heterogeneous with respect to treatment response and survival, and need to be better classified [9,10]. Marker heterogeneity was further illustrated in other studies where some morphologically well-differentiated tumors had a Ki-67 index of >20% [7,11]. The origin of NECs, whether representing de-differentiation of a well differentiated NET or de novo production from a stem cell is not clear [7] and tumors originating from different regions of the gut show different clinicopathological features [12].
Recently the ENETs group identified unmet needs in the field of neuroendocrine neoplasms including a general lack of reliable predictive and prognostic markers in both tumor tissue and in blood that could help direct therapeutic choices [13,14]. Single analyte biomarkers cannot indicate the multiple variables and complexity of cancer (proliferation, metabolic activity, invasive potential, metastatic propensity) that constitute a tumor. Analysis of additional molecules whose function is known to be altered in cancer would provide extra information for diagnosis, stratification of tumors and insights into the pathogenesis of NECs.
The epithelial-mesenchymal transition (EMT) provides a model system for understanding cancer metastasis. The EMT is a process by which epithelial cells lose their cell-cell adhesion properties and gain migratory and invasive characteristics to become mesenchymal cells [15,16]. The molecular pathways underlying EMT have been well-characterized in breast cancer and breast cancer cell culture models [17]. Less is known about the EMT processes in neuroendocrine tumors but in gastrointestinal NETs, the EMT markers β-catenin and N-cadherin were proposed for differential diagnosis of small-cell vs large-cell NEC [18], indicating the utility of such an approach.
The aim of this study was to firstly to develop a tumor profile of a single colonic NEC, based on the immunohistochemical detection of proteins associated with cell proliferation, cell adhesion, stem cell phenotype and metastasis in patient tissue and blood. Secondly, to correlate the marker profile of the tumor tissue with that of the circulating tumor cells that represent the motile component of the tumor. To date there is lack of evidence to support use of circulating tumor cell marker analysis as useful prognostic tool for NECs [19]. Detailed profiling of NEC tissue markers and corresponding circulating cells may contribute to the development of more reliable prognostic and predictive tools for clinical application and enable a greater understanding of the pathogenesis of this disease.
Materials and Methods
Tissue
Tissue from a patient with colorectal high-grade neuroendocrine carcinoma (large cell type) was obtained as part of a pilot clinical trial of NAB-paclitaxel in combination with carboplatin as first line treatment of gastrointestinal Neuro-Endocrine Carcinomas (NABNEC). The staging at the time of diagnosis was according to the TNM 7th edition (AJCC 2010), and was pT4 pN1 cM1, R1 resection. Tumor and non-tumor tissue, and a blood sample were obtained at diagnosis.
Ethics
The NABNEC pilot study received ethics approval from Barwon Health RSH104 and Deakin University (2014-239).
Biomarker selection
A range of 14 markers for detection in both tissue and blood samples was selected on the basis of their role in cancer progression, including indicators of cell adhesion, motility/angiogenesis, proliferation, tumor suppression, secretion, including those involved in EMT and markers specific to epithelial cells and blood (Table 1).
Tumor tissue processing for immunodetection of biomarkers: Regions of patient tissue showing normal gut morphology were classed as non-tumor and regions where tissue was disorganized, containing cells with irregular nuclei and showing heterogeneity of size was classified as tumor tissue [20]. Formalin-fixed paraffin-embedded tissue blocks were cut into 5-8 μm sections, placed on glass slides and incubated at 60°C overnight. Sections were deparaffinized in xylene solution, 2 immersions for 10 min each, and then rehydrated in decreasing concentrations of ethanol (from 100% to 50%) for 5 min in each solution. Finally, the slides were incubated in deionized water for 5 min and stored in PBS buffer at 4°C. As tissue blocks had been fixed in formalin, a process that can mask antigen sites, antigen retrieval was carried out prior to antibody incubation to improve the antigen-antibody binding efficiency. Slides were boiled in 1mM EDTA pH 8.0 for 15 minutes for antigen retrieval.
For immunoperoxidase staining, endogenous peroxidase activity was removed from sections by immersion at room temperature for 30 min in 0.3% H2O2. Blocking solution (1% BSA in PBS) was added to slides for 1 hr. at room temperature, followed by addition of the primary antibodies diluted to the required concentration and then incubated overnight at 4°C. Slides were washed 4 times for 10 min in PBS and appropriate HRP conjugated secondary antibodies (ThermoFisher, Australia) were added to the sections - incubated for 1 hr. at room temperature. After four 10 min PBS washes, DAB substrate (ThermoFisher, Australia) was added to the sections for 10 min, then slides were rinsed 3 times in PBS and dipped in hematoxylin counterstain for 3 sec. Slides were washed in distilled water for 30 sec, incubated in 100% ethanol for 2 min and the sections were mounted in DPX solution (Sigma-Aldrich, Australia) and covered with a cover slip. Stained sections were examined under an Olympus BX43 microscope and data from 40 fields that were representative of the stained tissue regions examined were captured using an Olympus DP22 camera.
Processing of blood for immunodetection of biomarkers: Prior to treatment, buffy coat was obtained from whole blood by Ficoll density gradient centrifugation. Whole blood (10 ml) was collected into EDTA Vacutainer tubes (Hurst Scientific, Australia) and processed within 24 hours of phlebotomy. Whole blood was mixed 1:1 with PBS, layered over 15 ml of Ficoll solution (Hurst Scientific, Australia) and centrifuged at 400 g for 40 min at 4°C. The plasma was then removed and buffy coat collected, mixed with 50 ml of PBS and centrifuged at 2000 g for 10 min at 4°C. The pellet was resuspended in 50 ml PBS then washed again and resuspended in 1 ml of patient’s plasma and frozen in -80°C until required. Twenty microliters of buffy coat were smeared onto slides, which were air-dried, dipped in ethanol for 2 min and rinsed briefly in tap water. Twelve drops of Leishman stain (Sigma-Aldrich, Australia) was added onto slides. Slides were incubated for 1.5 min on a rocker, followed by the addition of 18 drops of distilled water and 8 min incubation. Slides were washed in tap water for 2 min, mounted in DPX solution and covered with a cover slip. Stained cells were examined under the Olympus BX43 microscope and images captured with an Olympus DP22 camera. For immunofluorescence, cells were fixed in 4% PFA for 10 min, rinsed 3 times with PBS and permeabilized in 0.1% TX-100 for 10 min. After 3 PBS rinses, cells were blocked in 1% BSA in PBS for 30 min and the primary antibodies diluted to required concentration were added and incubated overnight. Slides were washed 4 times for 10 min in PBS and appropriate Alexa 488 conjugated secondary antibodies (ThermoFisher, Australia), diluted 1:2000, were added to slides. After the incubation, cells were washed 4 times in PBS for 10 min. For nuclear staining, TO-PRO-3 iodide (ThermoFisher, Australia) diluted in PBS 1:1000 was added and slides were incubated for 15’ at RT, protected from light, washed 3x in PBS and mounted with Prolong Gold anti-fade agent (ThermoFisher, Australia). Immunofluorescent microscopy was conducted using a Leica TCS SP2 AOBS laser confocal microscope and images were captured using Leica Microsystems TCS SP2 software.
Results
Comparison of matched non-tumor and tumor tissue
H&E staining showed normal colon tissue architecture (Figure 1a) and areas with tumor morphology (Figure 1b). Nuclei of tumor cells were large and irregular, while the area of cytoplasm was small.
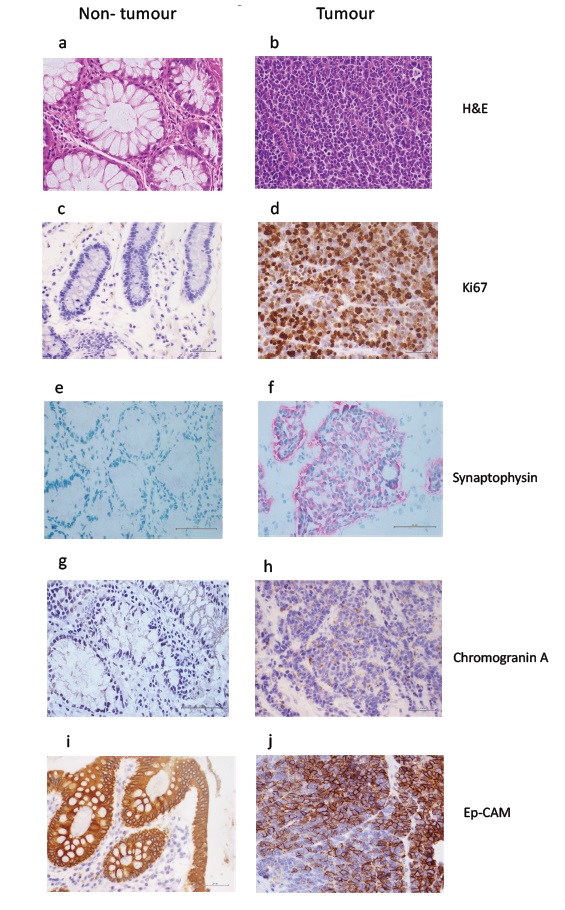
Figure 1: H&E staining of non-tumor tissue (a) and tumor tissue (b) Scale bar 20μm. Immunohistochemical staining for Ki57 showing very weak brown labelling in non-tumor tissue (c) and strong labelling in tumor tissue (d); synaptophysin showing no labelling in non-tumor tissue (e), and strong pink labelling in tumor tissue (f); CgA showing no labelling in non-tumor tissue (g) and weak brown labelling in tumor tissue (h); Ep-CAM showing strong brown labelling in non-tumor tissue (i) and variable labelling in tumor tissue (j). Scale bars 20μm.
Table 1 summarizes differences in marker staining between non-tumor and tumor tissue. Immunohistochemistry showed Ki67 was generally absent from non-tumor tissue, although under high magnification some of the fibroblast (spindle) nuclei showed Ki-67 expression that could indicate fibroblast to myofibroblast transition as the normal tissue comes from area adjacent to the cancer site (Figure 1c). Ki67 nuclear staining was present in 50% to 90% of tumor cells (Figure 1d). Non-tumor tissue stained for synaptophysin in a few in mucosal cells scattered in crypts (Figure 1e). Stronger staining was present in all tumor cells (Figure 1f). CgA was detected some mucosal cells in non-tumor tissue (Figure 1g) but strong cytoplasmic staining was present in over 30% of tumor cells (Figure 1h). Ep-CAM labelling in non-tumor tissue was strong and present in all epithelial cells (Figure 1i) while tumor tissue stained strongly in some regions, with patches of non-stained cells (Figure 1j).
|
Marker |
Marker Category |
Non-tumour tissue |
Tumour tissue |
Presence of marker in CTCs |
|
Ki67 |
Proliferation/ Cell Cycle |
- |
++++ |
Yes |
|
CgA |
Neuroendocrine |
+/- |
+ |
Yes |
|
Synaptophysin |
Neuroendocrine |
+/- |
+++ |
Yes |
|
Ep-CAM |
Epithelial |
++++ |
+++ |
Yes |
|
*Pan-cytokeratin |
Epithelial |
++++ |
++ |
Yes |
|
*CDX-2 |
Tumor Suppressor |
++++ |
++ |
No |
|
*E-cadherin |
Cell Adhesion |
++++ |
+/- |
N/A |
|
*β-catenin |
Cell Adhesion |
++ |
+ |
No |
|
CK7 |
Epithelial |
++ |
+ |
Yes |
|
CK20 |
Epithelial |
++++ |
- |
Yes |
|
CD56 |
Neuroendocrine |
+/- |
++++ |
Yes |
|
*CD44 |
Stem Cell |
+ |
++ |
Yes |
|
*P-cadherin |
Cell Adhesion |
- |
- |
No |
|
CD31 |
Blood/angiogenesis |
N/A |
N/A |
Yes |
|
(-) absence of marker in tissue; (+/-) presence of marker in tissue but only in few cells; (+) less than 10% labelled; (++) 10-25% labelled; (+++) 25-50% labelled; (++++) greater than 50% labelled; *Markers associated with epithelial to mesenchymal transition |
||||
Strong pan-cytokeratin staining was detected in all epithelial cells in non-tumor tissue (Figure 2a). In tumor tissue, pan-cytokeratin staining was heterogeneous (Figure 2b). CDX-2 staining was strong in non-tumor tissue (Figure 2c), while in tumor tissue it was present in approximately 20% of tumor cell nuclei, with variable intensity (Figure 2d). Non-tumor tissue showed strong membrane staining for E-cadherin (Figure 2e) while tumor tissue showed barely discernible staining in few cells (Figure 2f). β-catenin staining was found in junctional regions cells of non-tumor tissue at (Figure 2g). Weak β-catenin staining was visible in some nuclei of tumor cells within the tissue (Figure 2h).
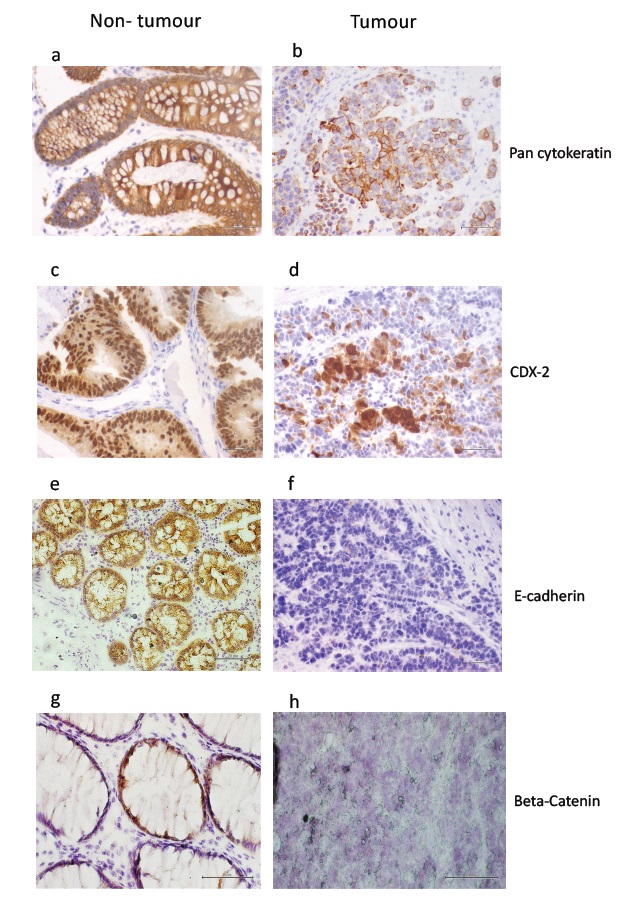
Figure 2: Immunohistochemical staining for pan-cytokeratin showing strong brown labelling in non-tumor tissue (a) and patchy, variable labelling in tumor tissue (b); CDX-2 showing strong brown labelling in non-tumor tissue (c) and weak labelling in tumor tissue (d); E-cadherin showing strong brown labelling in non-tumor tissue (e) and no labelling in tumor tissue (f); ?-catenin showing strong localised brown labelling in non-tumor tissue (g) and no labelling in tumor tissue (h). Scale bars 20μm.
In non-tumor tissue CK7 staining showed both unstained and strongly stained regions (Figure 3a), while in tumor tissue very weak CK7 staining was detected in cells that could be either epithelial, vascular or monocytes (Figure 3b). Very strong CK20 labelling was detected in non-tumor tissue (Figure 3c), while CK20 was absent from tumor tissue (Figure 3d). CD56 staining was observed in non-tumor tissue in a few cells (Figure 3e), while tumor tissue was strongly stained, particularly at cell junctions (Figure 3f). Non-tumor tissue showed weak CD44 staining in epithelial cells and connective tissue (Figure 3g) and strong staining was found in a few cells within the tumor tissue (Figure 3h). P-cadherin labelling was absent in non-tumor and tumor tissue (data not shown).
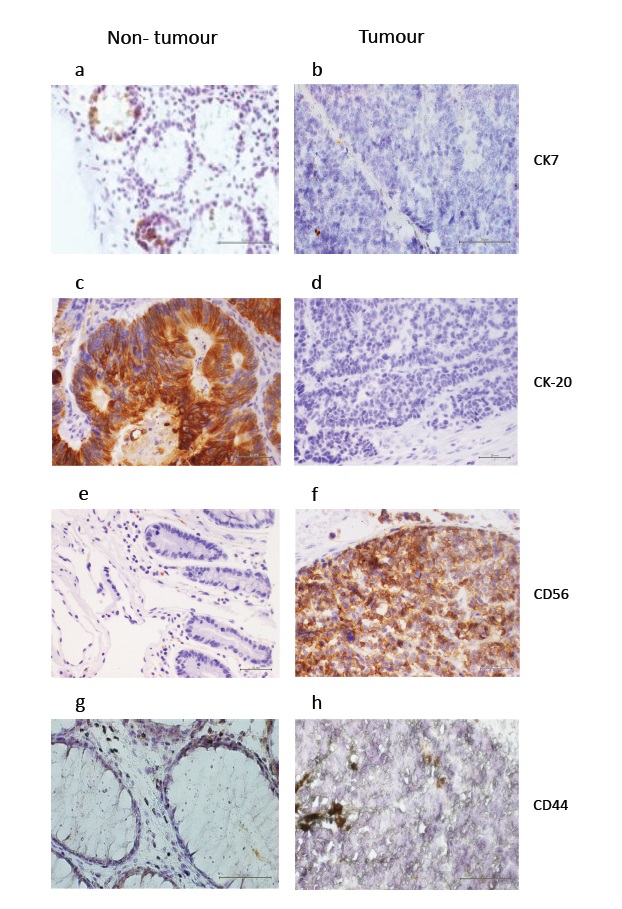
Figure 3: Immunohistochemical staining for CK7 showing patchy but strong brown labelling in non-tumor tissue (a) and very weak labelling in some regions of tumor tissue (b); CK20 showing strong brown labelling in non-tumor tissue (c) and no labelling in tumor tissue (d); CD56/NCAM showing brown labelling in very few non-tumor tissue cells (e) and strong labelling in tumor tissue (f); CD44 showing weak brown labelling in non-tumor tissue (g) and slightly stronger labelling in tumor tissue (h). Scale bars 20μm.
Immunohistochemical staining of circulating tumor cells
Buffy coat preparations showed the presence of WBC, mainly lymphocytes monocytes and platelets (Figure 4a). Additionally, cells much larger than WBCs with large nuclei and a relatively greater amount of cytoplasm relative to WBC were detected as single cells or in clusters (Figure 4b). Based on morphology, the large cells could represent CTCs, hematopoietic stem and progenitor cells, megakaryocytes or endothelial cells.
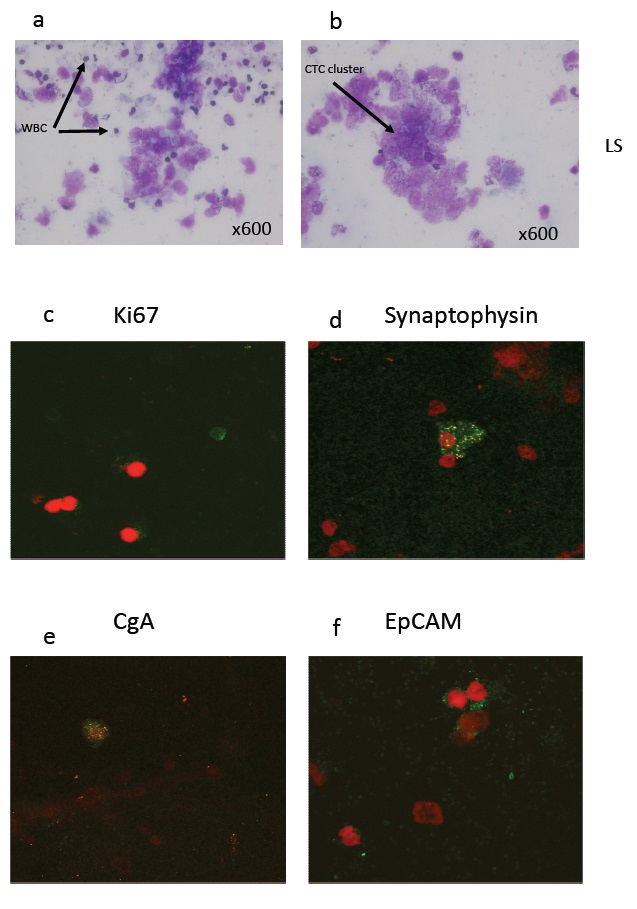
Figure 4: Leishman staining of buffy coat cells (a, b) showing white blood cells, platelets and clusters of circulating tumor cells. Immunofluorescent staining of buffy coat cells using antibodies to Ki67 in green (c), synaptophysin in green (d), CgA in green (e), Ep-CAM in green (f) all with red nuclei (propidium iodide).
Immunofluorescent marker staining of circulating tumor cells
Weak Ki67 staining was detected within buffy coat cells (Figure 4c). Synaptophysin, CgA and Ep-CAM (Figures 4d, e, f), CD56, pan-cytokeratin, CK7 and CK20 staining was found in buffy coat cells (Figures 5a, b, c, d). CD44, a marker for stem cells was detected (Figure 5e) and CD31, a marker for endothelial cells was found in clusters of buffy coat cells (Figure 5f). The presence or absence of buffy coat cells stained for each specific marker is indicated in Table 1.
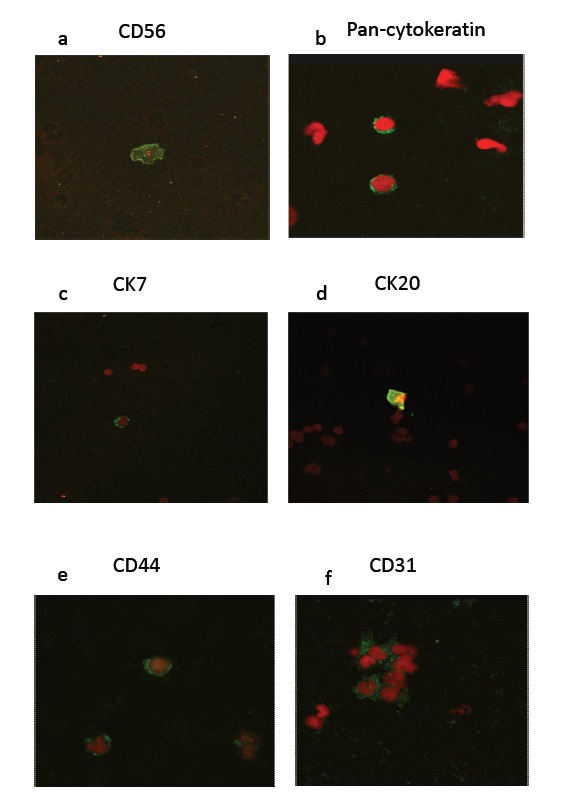
Figure 5: Immunofluorescent staining of buffy coat cells using antibodies to CD56 in green (a), Pan-cytokeratin in green (b), CK7 in green (c), CK20 in green (d), CD44 in green (e) and CD31 in green (f), all with red nuclei (propidium iodide).
Discussion
This study investigated expression of a panel of markers in a single NEC case to determine which ones were different compared to matched non-tumor tissue. Also, to determine whether there was a correlation of markers found in tissue with those present in circulating tumor cells. This approach has not been previously reported but has the potential to better define or stratify neuroendocrine carcinoma phenotypes based on immunohistochemistry, if the results can be validated in more patients.
NENs are a heterogeneous group of neoplasms that require better classification in order to improve patient management [14,20]. The markers typically used include CgA, synaptophysin, Ki67 and CD56, but tumors demonstrate variable expression these markers. NECs in particular have not been well defined in terms of other markers, and little is known about circulating tumor cell markers in this disease.
We profiled tumor and adjacent matched non-tumor tissue and circulating tumor cells from a colonic G3 NEC case to establish which markers best defined the tumor. The inclusion of matched controls enabled a comparative analysis in contrast to many previous studies reporting tumor data only. Five of the 15 markers (Ki67, synaptophysin, CgA, CD56 and CD44) were increased in tumor tissue, while seven (Ep-CAM, CDX-2, E-cadherin, β-catenin, pan-cytokeratin, CK7 and CK20) were decreased or had undetectable levels of expression in tumor tissue relative to non-tumor tissue. These data indicate a benefit of additional markers including Ep-CAM, CDX-2, β-catenin, pan-cytokeratin, CK7 and CK20 to define the NEC phenotype better than just the standard neuroendocrine markers alone (CgA, synaptophysin, Ki67 and CD56).
The limitations of traditional NEN markers
The proliferation marker Ki67 >20% is the WHO standard marker for NEC but it does not always correlate with differentiation [10]. Variations in Ki67 labelling occur between laboratories where factors such as tissue fixing and processing account for differences [21]. There is no consensus on the cut off for low-intensity Ki67 staining [22]. Synaptophysin is more broadly expressed than CgA, being present in neurons and pancreatic cells [23], and thus is less specific. Synaptophysin has been regarded as the most sensitive marker in the diagnosis of well differentiated NETS [24]. In our study tumor tissue was only weakly labelled with CgA, consistent with previous work showing a decrease in CgA immunoreactivity in poorly differentiated, metastatic neuroendocrine carcinomas [24,25].
Ep-CAM is transmembrane epithelial glycoprotein, expressed in the epithelia of the small and large intestine. Our results showed that Ep-CAM expression was high in both tumor tissue and non-tumor tissue but higher in non-tumor tissue relative to tumor tissue. High expression of EpCAM has been reported in a range of tumors including colon, gastric, esophageal and in poorly differentiated NETs, weak expression in pancreatic and absence in hepatocellular and variable in breast [26]. As these studies did not report on non-tumor tissue, they do not indicate whether Ep-CAM expression is increased in cancer tissue. Data from knockout studies of EpCAM in cells and animals indicate its roles are complex and context-dependent [27].
Cytokeratins are very specific to different types of epithelial cells [28] and their reduced expression is linked to loss of normal epithelial phenotype and an invasive phenotype [29]. The broad-spectrum keratin antibody AE1/AE3 is commonly used to distinguish poorly differentiated epithelial cells [30]. The loss of broad-spectrum keratin expression seen in tumor tissue relative to the strong label in the non-tumor tissue in our study is similar to that observed in a range of other, but not all epithelial tumors [30]. Differential expression of CK7 and CK20 varies with the tissue of origin and high-grade tumors may lose typical expression patterns. A study in colonic adenocarcinoma showed low levels of CK7 and high levels of CK20 [31] while CK7 and CK20 were absent from high-grade neuroendocrine carcinomas of the gastrointestinal tract [32]. We found cytokeratin CK20 was markedly reduced in tumor relative to the matched control tissue while CK7 was slightly reduced. Further analysis of CK7 and CK20 expression in other G3 and in G2 and G1 is required to establish its usefulness in stratification of tumors.
We found CD56 was highly expressed in tumor tissue as well as being present in stromal tissue while not detected in matching non-tumor epithelial tissue. CD56 is a cell-cell adhesion and signaling molecule present in neuroendocrine [33] and other malignant cancers [34]. Its expression is associated with a mesenchymal phenotype [35]. Although there are correlations between high CD56 expression and NET progression, there is a lack of information of the expression of CD56 within different origins of NETs [34]. High expression of CD56 is a potential indicator for NECs.
Markers of epithelial to mesenchymal transition are altered in G3 tumor tissue
The major hallmark of EMT is the loss of the E-cadherin–catenin–complex from the cell membrane and the subsequent activation of β-catenin as an oncogenic transcription factor [36]. Consistent with this we found reduced E-cadherin and evidence of relocalization of β-catenin to the nuclei of some cells in tumor tissue relative to non-tumor. This was similar to another study that showed reduced E-cadherin and β-catenin in poorly differentiated NECs relative to well-differentiated NETs [37]. CDX2, an EMT marker, is a homeobox gene related to gut folding and expressed in most gut epithelial cells and derived tumors. Its expression in NENs may relate to the site of origin of the tumor. In our study, CDX2 was lower in tumor tissue relative to non-tumor. Other studies report CDX2 as highly expressed in colorectal adenocarcinomas [38], intestinal NECs [39] and low in well-differentiated colon NETs [40]. These studies are limited as CDX-2 in non-tumor tissue was not reported. The absence of P-cadherin, a tumor suppressor is consistent with previous data in aggressive tumors [41].
The higher levels of CD44 seen in tumor tissue relative to non-tumor tissue are consistent with an EMT, as the acquisition of a mesenchymal phenotype is associated with an increase in stem cell properties as observed in cultured breast cancer cells [42]. Alternatively, the CD44 positive cell could represent macrophages that have invaded the tumor sites. Distinguishing between these different cell types would require a colocalization study with a macrophage-specific marker for example CD14. CD44 has different splice variants in cancers [43] and future studies using RT-PCR could investigate this.
Heterogeneity of marker expression is a feature of both tumor and non-tumor tissue
Immunohistochemistry showed considerable heterogeneity in both non-tumor and tumor tissue. Markers including Ep-CAM, pan-cytokeratin, CDX-2 and CD44 were heterogeneously expressed in tumor tissue and CgA was detected in less than half the tumor cells. Furthermore, markers that are associated with a normal epithelial phenotype such as EpCAM and pan-cytokeratin were detected in tumor tissue. The heterogeneity of expression of key epithelial markers in tissue suggests cells within a tumor are at different stages of loss of epithelial phenotype and gain of mesenchymal function. This may be due to the recruitment or transformation of normal epithelial cells to cancer cells. Evidence for the latter was found in our previous studies in cultured breast cancer cells where epidermal growth factor acted as a switch to convert cells from an epithelial to a mesenchymal phenotype [44]. The heterogenous nature of tumor marker expression confirms that no single marker provides a representative indicator of the state of the cancer.
The limitations of immunohistochemistry
The limitations of immunohistochemistry for tumor diagnosis include lack of inclusion of matching non-tumor tissue reported in many studies, variations between laboratories [21,45] including differences in reagents, variations in specificity of antibodies, and absence of positive and negative controls to ensure specificity of antibody staining [46]. mRNA analysis would provide a more quantitative method for detection of gene expression products.
Circulating tumor cells showed the same marker profile as the corresponding tumor tissue
The presence of CTCs in blood has been suggested to have prognostic value and has been associated with metastatic disease in NETs [47], tumor grade [48], patient survival in metastatic colorectal cancer [49] and radiologic response of patients with a range of NENs [50]. Little however has previously been reported on how markers present in CTCs relate to those found in the corresponding tumor tissue. We identified putative tumor cells present in the buffy coat by their expression of tumor markers and their large size relative to WBC. The profile of the CTCs matched that of the tumor tissue in the expression of 11 protein markers. Thus, the marker profile of the CTCs may provide a window on the molecular status of the tissue. Further studies are required to test this. If CTC profiles match that of the tumor tissue, then a blood test for CTCs might be an alternative to a more invasive tissue biopsy.
The limitations of cell selection methods for CTC analysis
In a consensus study on biomarkers for neuroendocrine disease it was agreed that there was insufficient evidence to support use of circulating tumor cells as useful prognostic markers for NETs [19]. A main reason being that low numbers of CTCs have been recovered for analysis. Most studies on CTCs involve the use of selection markers to isolate CTCs from blood, including the CellSearch platform that uses Ep-CAM to enrich for CTCs [48]. The disadvantage of EpCAM-dependent assays are that they assume all EpCAM-positive cells are tumor cells, and exclude the possibility of Ep-CAM negative tumor cells [51,52]. Other selection assays include microfluidic western blotting based on selection of large cells [53], ScreenCell(R) based on cell size selection [51] and RosettSep using negative selection though removal of RBC and WBC from blood [54]. Such selection methods are hampered by the fact that CTCs can be heterogeneous in size and can occur as clusters.
We used Ficoll gradient centrifugation to obtain the buffy coat for analysis of CTCs. The advantage of this method was that it enabled CTCs and white blood cells to be separated from red blood cells and plasma. By this process CTSs were not selected on the basis of a single marker or a single trait attributed to CTCs as in other methods. Histological staining of the buffy coat identified single or clustered large cells with bigger nuclei than a WBC, as putative tumor cells. Multiple marker analysis then enabled identification of CTCs using immunofluorescence, a more sensitive technique than immunohistochemistry. Ki67, CgA, synaptophysin, Ep-CAM, pan-cytokeratin, CK7 and CK20, CD56, CD44 and CD31 labelling was detected in CTCs. Thus, despite enrichment for CTCs being considered as a preliminary step to obtain sufficient CTCs for analysis, this step is not essential.
Caution is needed in interpreting blood analyses as cells other than tumor cells may label with tumor markers. The presence of CD31 in our study confirms the presence endothelial cells in the patient blood. Circulating endothelial cells were reported in normal blood [55] and in pancreatic lesions [56]. Both CD56 and synaptophysin were found in normal blood by PCR [52] and CD44 is found in endothelial progenitor cells in normal blood [57]. Ki67 is present in T and B lymphocytes in normal peripheral blood cells [58].
Based on the presence of cells expressing markers CgA, Ep-CAM, pan-cytokeratin, CK7 and CK20 and an expression profile that corresponds to the tumor tissue, we conclude that the cells in the buffy coat represent CTCs. The presence of CTCs expressing mesenchymal markers supports the concept that CTCs are derived from gastrointestinal epithelial cells that have acquired a migratory phenotype that facilitates their metastasis, as concluded in a previous study on breast cancer CTCs [59].
The limitations of this study are that it was a pilot to comprehensively screen a single patient for an array of markers, in cancer and non-cancer tissue components. The utility of the multiple marker approach for tumor stratification has to be confirmed in a larger study.
Conclusion
NEC tumor tissue was defined using a profile of 11 markers associated with cell proliferation, cell adhesion, epithelial differentiation and stem cell phenotype. This provided evidence that cells within the NEC tissue had transitioned to a mesenchymal phenotype. The tumor tissue profile matched that of the corresponding patient CTCs. Thus, CTC analysis may have potential to replace tissue analysis to indicate tumor status. Three approaches for improving tumor classification include (i) the use of multiple markers selected for their role in metastasis, (ii) the use of matched non-tumor tissue and (iii) the avoidance selective markers for isolating CTCs. The utility of detailed patient marker profiling of tumor and blood for prognostic disease stratification should be further investigated for multiple cases. Subsequently, we are studying the utility of these 11 proteins as prognostic and predictive biomarkers in an ongoing randomized NABNEC clinical trial [60].
Competing Interests
The authors declare they have no competing interests
Disclosure Statement
MK reports consultant or advisory roles for Ipsen, Pfizer Roche; and Jackson Laboratory for Genomic Medicine; research funding from AbbVie, Bristol-Myers Squibb and Specialized Therapeutics. The authors declare that there is no conflict of interest that could be perceived as prejudicing the impartiality of the research reports.
Authors’ Contribution
AM and AV carried out the experiments and interpretation of results, SY contributed intellectual content, SFW provided clinical data and contributed to the pathology findings, MK designed the clinical trial and provided intellectual input, MLA provided intellectual input into the study, interpretation of results and prepared the manuscript. All authors reviewed and approved the manuscript.
Availability of Data
Raw data is available from the corresponding author
Acknowledgement
We thank Dr Richard Standish for valuable feedback on the manuscript
Funding
The project was partially funded by a Project grant from the National Health and Medical Research Council ID APP1102018. The authors are grateful for philanthropic funding from the Bourne Foundation Pty Ltd.
Statement of Ethics
The research presented in this manuscript was conducted ethically in accordance with guidelines and institutional approval as indicated in the Materials and Methods.
References
2. Rindi G, Kloppel G, Couvelard A, Komminoth P, Korner M, Lopes JM, et al. TNM staging of midgut and hindgut (neuro) endocrine tumors: a consensus proposal including a grading system. Virchows Arch. 2007 Oct;451(4):757-62.
3. Amin MB, Greene FL, Edge SB, Compton CC, Gershenwald JE, Brookland RK, et al. The Eighth Edition AJCC Cancer Staging Manual: Continuing to build a bridge from a population-based to a more "personalized" approach to cancer staging. CA Cancer J Clin. 2017 Mar;67(2):93-99.
4. Ferolla P, Faggiano A, Mansueto G, Avenia N, Cantelmi MG, Giovenali P, et al. The biological characterization of neuroendocrine tumors: The role of neuroendocrine markers J Endocrinol Invest. 2008;31:277-86.
5. Khan MS, Caplin ME. The use of biomarkers in neuroendocrine tumors. Frontline Gastroenterol. 2013 Jul;4(3):175-81.
6. Modlin IM, Bodei L, Kidd M. Neuroendocrine tumor biomarkers: From monoanalytes to transcripts and algorithms. Best Practice and Research: Clinical Endocrinology and Metabolism. 2016;30(1):59-77.
7. Sorbye H, Strosberg J, Baudin E, Klimstra DS, Yao JC. Gastroenteropancreatic high-grade neuroendocrine carcinoma. Cancer. 2014 Sep 15;120(18):2814-23.
8. Alese OB, Jiang R, Shaib W, Wu C, Akce M, Behera M, et al. High-Grade Gastrointestinal Neuroendocrine Carcinoma Management and Outcomes: A National Cancer Database Study. Oncologist. 2019 Jul;24(7):911-20.
9. Sorbye H, Welin S, Langer SW, Vestermark LW, Holt N, Osterlund P, et al. Predictive and prognostic factors for treatment and survival in 305 patients with advanced gastrointestinal neuroendocrine carcinoma (WHO G3): the NORDIC NEC study. Ann Oncol. 2013 Jan;24(1):152-60.
10. Milione M, Maisonneuve P, Spada F, Pellegrinelli A, Spaggiari P, Albarello L, et al. The Clinicopathologic Heterogeneity of Grade 3 Gastroenteropancreatic Neuroendocrine Neoplasms: Morphological Differentiation and Proliferation Identify Different Prognostic Categories. Neuroendocrinology. 2017;104(1):85-93.
11. Ali AS, Gronberg M, Federspiel B, Scoazec JY, Hjortland GO, Gronbaek H, et al. Expression of p53 protein in high-grade gastroenteropancreatic neuroendocrine carcinoma. PLoS One. 2017;12(11):e0187667.
12. Zhang Y, Shang L, Zhang PP, Chen LH, Wang W, Fang C, et al. Clinicopathological features and prognostic validity of the European Neuroendocrine Tumor Society (ENETS) and American Joint Committee on Cancer (AJCC) 8th staging systems in colonic neuroendocrine neoplasms. Cancer Med. 2019 Sep;8(11):5000-11.
13. de Herder WW, Capdevila J. Unmet Needs in the Field of Neuroendocrine Neoplasms of the Gastrointestinal Tract, Pancreas, and Respiratory System: Reports by the ENETS Group. Neuroendocrinology. 2019;108(1):5-6.
14. Sorbye H, Baudin E, Borbath I, Caplin M, Chen J, Cwikla JB, et al. Unmet Needs in High-Grade Gastroenteropancreatic Neuroendocrine Neoplasms (WHO G3). Neuroendocrinology. 2019;108(1):54-62.
15. Lamouille S, Xu J, Derynck R. Molecular mechanisms of epithelial-mesenchymal transition. Nat Rev Mol Cell Biol. 2014 Mar;15(3):178-96.
16. Hugo H, Ackland ML, Blick T, Lawrence MG, Clements JA, Williams ED, et al. Epithelial--mesenchymal and mesenchymal--epithelial transitions in carcinoma progression. J Cell Physiol. 2007 Nov;213(2):374-83.
17. Hugo HJ, Kokkinos MI, Blick T, Ackland ML, Thompson EW, Newgreen DF. Defining the E-cadherin repressor interactome in epithelial-mesenchymal transition: the PMC42 model as a case study. Cells Tissues Organs. 2011;193(1-2):23-40.
18. Galvan JA, Astudillo A, Vallina A, Fonseca PJ, Gomez-Izquierdo L, Garcia-Carbonero R, et al. Epithelial-mesenchymal transition markers in the differential diagnosis of gastroenteropancreatic neuroendocrine tumors. Am J Clin Pathol. 2013 Jul;140(1):61-72.
19. Oberg K, Modlin IM, De Herder W, Pavel M, Klimstra D, Frilling A, et al. Consensus on biomarkers for neuroendocrine tumor disease. The Lancet Oncology. 2015;16(9):e435-e46.
20. Klimstra DS, Modlin IR, Coppola D, Lloyd RV, Suster S. The pathologic classification of neuroendocrine tumors: a review of nomenclature, grading, and staging systems. Pancreas. 2010 Aug;39(6):707-12.
21. Mengel M, von Wasielewski R, Wiese B, Rudiger T, Muller-Hermelink HK, Kreipe H. Inter-laboratory and inter-observer reproducibility of immunohistochemical assessment of the Ki-67 labelling index in a large multi-centre trial. J Pathol. 2002;198:292-99.
22. Chai SM, Brown IS, Kumarasinghe MP. Gastroenteropancreatic neuroendocrine neoplasms: selected pathology review and molecular updates. Histopathology. 2018 Jan;72(1):153-67.
23. Gould V, Wiedenmann B, Lee I, Schwechheimer K, Dockhorn-Dworniczak B, Radosevich JA, et al. Synaptophysin expression in neuroendocrine neoplasms as determined by immunocytochemistry. Am J Pathol. 1987;126(2):243-57.
24. Zatelli MC, Torta M, Leon A, Ambrosio MR, Gion M, Tomassetti P, et al. Chromogranin A as a marker of neuroendocrine neoplasia: an Italian Multicenter Study. Endocr Relat Cancer. 2007 Jun;14(2):473-82.
25. Duan K, Mete O. Algorithmic approach to neuroendocrine tumors in targeted biopsies: Practical applications of immunohistochemical markers. Cancer Cytopathol. 2016 Dec;124(12):871-84.
26. Spizzo G, Fong D, Wurm M, Ensinger C, Obrist P, Hofer C, et al. EpCAM expression in primary tumor tissues and metastases: an immunohistochemical analysis. J Clin Pathol. 2011 May;64(5):415-20.
27. Huang L, Yang Y, Yang F, Liu S, Zhu Z, Lei Z, et al. Functions of EpCAM in physiological processes and diseases (Review). Int J Mol Med. 2018 Oct;42(4):1771-85.
28. Moll R, Divo M, Langbein L. The human keratins: biology and pathology. Histochem Cell Biol. 2008 Jun;129(6):705-33.
29. Karantza V. Keratins in health and cancer: more than mere epithelial cell markers. Oncogene. 2011 Jan 13;30(2):127-38.
30. Ordonez NG. Broad-spectrum immunohistochemical epithelial markers: a review. Hum Pathol. 2013 Jul;44(7):1195-215.
31. Chu P, Wu E, Weiss LM. Cytokeratin 7 and cytokeratin 20 expression in epithelial neoplasms: a survey of 435 cases. Mod Pathol. 2000 Sep;13(9):962-72.
32. Kende AI, Carr NJ, Sobin LH. Expression of cytokeratins 7 and 20 in carcinomas of the gastrointestinal tract. Histopathology. 2003 Feb;42(2):137-40.
33. Farinola MA, Weir EG, Ali SZ. CD56 expression of neuroendocrine neoplasms on immunophenotyping by flow cytometry: a novel diagnostic approach to fine-needle aspiration biopsy. Cancer Cytopathology: Interdisciplinary International Journal of the American Cancer Society. 2003 Aug 25;99(4):240-6.
34. Gattenlohner S, Stuhmer T, Leich E, Reinhard M, Etschmann B, Volker HU, et al. Specific detection of CD56 (NCAM) isoforms for the identification of aggressive malignant neoplasms with progressive development. The American Journal of Pathology. 2009;174(4):1160-71.
35. Evseenko D, Zhu Y, Schenke-Layland K, Kuo J, Latour B, Ge S, et al. Mapping the first stages of mesoderm commitment during differentiation of human embryonic stem cells. Proc Natl Acad Sci U S A. 2010 Aug 3;107(31):13742-7.
36. Brembeck FH, Rosario M, Birchmeier W. Balancing cell adhesion and Wnt signaling, the key role of beta-catenin. Curr Opin Genet Dev. 2006 Feb;16(1):51-9.
37. Li CC, Xu B, Hirokawa M, Qian Z, Yoshimoto K, Horiguchi H, et al. Alterations of E-cadherin, alpha-catenin and beta-catenin expression in neuroendocrine tumors of the gastrointestinal tract. Virchows Arch. 2002 Feb;440(2):145-54.
38. Werling RW, Yaziji H, Bacchi CE, Gown AM. CDX2, a highly sensitive and specific marker of adenocarcinomas of intestinal origin: an immunohistochemical survey of 476 primary and metastatic carcinomas. Am J Surg Pathol. 2003 Mar;27(3):303-10.
39. Barbareschi M, Roldo C, Zamboni G, Capelli P, Cavazza A, Macri E, et al. CDX-2 homeobox gene product expression in neuroendocrine tumors: its role as a marker of intestinal neuroendocrine tumors. Am J Surg Pathol. 2004 Sep;28(9):1169-76.
40. Yang MX, Coates RF, Ambaye A, Cortright V, Mitchell JM, Buskey AM, et al. NKX2.2, PDX-1 and CDX-2 as potential biomarkers to differentiate well-differentiated neuroendocrine tumors. Biomark Res. 2018;6:15.
41. Vieira AF, Paredes J. P-cadherin and the journey to cancer metastasis. Mol Cancer. 2015 Oct 6;14:178.
42. Mani SA, Guo W, Liao MJ, Eaton EN, Ayyanan A, Zhou AY, et al. The epithelial-mesenchymal transition generates cells with properties of stem cells. Cell. 2008 May 16;133(4):704-15.
43. Zhang H, Brown RL, Wei Y, Zhao P, Liu S, Liu X, et al. CD44 splice isoform switching determines breast cancer stem cell state. Genes Dev. 2019 Feb 1;33(3-4):166-79.
44. Ackland ML, Newgreen DF, Fridman M, Waltham MC, Arvanitis A, Minichiello J, et al. Epidermal growth factor-induced epithelio-mesenchymal transition in human breast carcinoma cells. Lab Invest. 2003 Mar;83(3):435-48.
45. O'Leary TJ. Standardization in immunhistochemistry. Applied Immunohistochemsitry & Molecular Morphology. 2001;9(1):3-8.
46. Ruiter DJ, Ferrier CM, can Muijen GNP, Henzen-Logmans SC, Kennedy S, Kramer MD, et al. Quality control of immunohistochemical evaluation oftumour-associated plasminogen activators and related components. Eur J Cancer. 1998;9(1334-1340).
47. Khan MS, Tsigani T, Rashid M, Rabouhans JS, Yu D, Luong TV, et al. Circulating tumor cells and EpCAM expression in neuroendocrine tumors. Clin Cancer Res. 2011;17(2):337-45.
48. Khan MS, Kirkwood A, Tsigani T, Garcia-Hernandez J, Hartley JA, Caplin ME, et al. Circulating tumor cells as prognostic markers in neuroendocrine tumors. J Clin Oncol. 2013;31(3):365-72.
49. Cohen SJ, Punt JA, Iannotti N, Saidman BH, Sabbath KD, Gabrail NY, et al. Relationship of circulating tumor cells to tumor response, progression-free survival, and overall survival in patients with metastatic colerectal cancer. J Clin Oncol. 2008;26(19):3213-21.
50. Khan MS, Kirkwood AA, Tsigani T, Lowe H, Goldstein R, Hartley JA, et al. Early Changes in Circulating Tumor Cells Are Associated with Response and Survival Following Treatment of Metastatic Neuroendocrine Neoplasms. Clin Cancer Res. 2016 Jan 1;22(1):79-85.
51. Desitter I, Guerrouahen BS, Benali-Furet N, Wechsler J, Janne PA, Kuang Y, et al. A new device for rapid isolation by size and characterization of rare circulating tumor cells. Anticancer Res. 2011 Feb;31(2):427-41.
52. Obermayr E, Agreiter C, Schuster E, Fabikan H, Weinlinger C, Baluchova K, et al. Molecular Characterization of Circulating Tumor Cells Enriched by A Microfluidic Platform in Patients with Small-Cell Lung Cancer. Cells. 2019 Aug 13;8(8).
53. Sinkala E, Sollier-Christen E, Renier C, Rosas-Canyelles E, Che J, Heirich K, et al. Profiling protein expression in circulating tumor cells using microfluidic western blotting. Nat Commun. 2017 Mar 23;8:14622.
54. Esmaeilsabzali H, Beischlag TV, Cox ME, Parameswaran AM, Park EJ. Detection and isolation of circulating tumor cells: principles and methods. Biotechnol Adv. 2013 Nov 15;31(7):1063-84.
55. Kim SW, Kim H, Cho HJ, Lee JU, Levit R, Yoon YS. Human peripheral blood-derived CD31+ cells have robust angiogenic and vasculogenic properties and are effective for treating ischemic vascular disease. J Am Coll Cardiol. 2010 Aug 10;56(7):593-607.
56. Cauley CE, Pitman MB, Zhou J, Perkins J, Kuleman B, Liss AS, et al. Circulating Epithelial Cells in Patients with Pancreatic Lesions: Clinical and Pathologic Findings. J Am Coll Surg. 2015 Sep;221(3):699-707.
57. Goncharov NV, Nadeev AD, Jenkins RO, Avdonin PV. Markers and Biomarkers of Endothelium: When Something Is Rotten in the State. Oxid Med Cell Longev. 2017;2017:9759735.
58. Cordone I, Matutes E, Catovsky D. Characterisation of normal peripheral blood cells in cycle identified by monoclonal antibody Ki-67. J Clin Pathol. 1992 Mar;45(3):201-5.
59. Yu M, Bardia A, Wittner BS, Stott SL, Smas ME, Ting DT, et al. Circulating breast tumor cells exhibit dynamic changes in epithelial and mesenchymal composition. Science. 2013 Feb 1;339(6119):580-4.
60. Chantrill LA, Lipton LR, Hofman M, Gebski V, Gill A, Markman B, et al. AGITG nabnec: A randomised phase II study of nab-paclitaxel in combination with carboplatin as first line treatment of gastrointestinal neuroendocrine carcinomas. J Clin Oncol. 2018;36(4_suppl):TPS548-TPS48.