Abstract
Today, both type 1 and type 2 diabetes mellitus affect 33.3 million people in the United States and nearly 500 million adults worldwide, and there is concern that this number may increase steadily in the future. Previous studies have linked the development of type 2 diabetes to multiple lifestyle factors, including physical activity level and diet, and biological characteristics, such as body composition, age, and race; however, current research suggests that gender may also have an impact on one’s risk of developing type 2 diabetes. Variations in type 2 diabetes diagnosis, prevalence, and progression have been found between males and females. These variations stem from distinctions in testosterone, estrogen, and leptin hormone levels, incongruity in health practices, differences in physical size and shape, and factors that only affect those who are biologically female, such as age of menstruation or menopause and the presence of gestational diabetes or polycystic ovary syndrome. This literature review aims to summarize the current literature discussing these factors. Using the search engine PubMed, and applicable search terms such as “type 2 diabetes,” “gender,” “sex hormones,” and “diabetes and age of menarche/menopause,” we found information about diabetes risk specific to females and general risk factors that vary for both males and females. Through our investigation, we have reasons to believe that the probability of developing type 2 diabetes has some association with one’s biological sex and specifically the hormones involved. It is our hope that this work will provide useful information to researchers of basic and public health sciences, physicians, nutritional practitioners, people with diabetes, and students in biomedical fields.
Keywords
Type 2 diabetes, Gender, Disease stages, Risk factors, Race, Lifestyle
Abbreviations
FPG: Fasting Plasma Glucose; GLUT: Glucose Transporter; IDF: International Diabetes Federation; OGTT: Oral Glucose Tolerance Test; BMI: Body Mass Index; PCOS: Polycystic Ovary Syndrome; SHBG: Sex-hormone Binding Globulin; T2D: Type 2 Diabetes
Background
The International Diabetes Federation (IDF) estimates that as of 2019, 463 million adults had diabetes worldwide [1] This is significantly higher than the 415 million reported by IDF in 2015 [2]. More recently, the Center for Disease Control and Prevention (CDC) reported 33.3 million people had diabetes in the U.S. These numbers show that diabetes is prevalent worldwide, and is increasing each year at a substantial rate [3]. By 2035 the number of diabetics worldwide is expected to be 592 million, and by 2045 the number may reach 693 million [2,4]. In the U.S. alone, the prevalence of diabetes is expected to be 34 million by 2030 and 36 million by 2045 [1]. These rates are concerning because diabetes leads to morbidity and mortality. In 2017, 5 million estimated deaths worldwide were attributable to diabetes [5].Furthermore, financial burden of diabetes management affects the societal medical expenditure. The American Diabetes Association (ADA) estimates the total cost of diagnosed diabetes in the United States was about $327 billion in 2017, an increase from $245 billion in 2012. The majority of this $327 billion was allocated towards direct medical care and a smaller percentage was due to loss of productivity [6]. Given the current state of diabetes prevalence in the U.S. and worldwide, and the detrimental effects associated with diabetes, a thorough understanding of the factors contributing to the risk of diabetes is necessary.
Diabetes Mellitus
Diabetes mellitus refers to conditions of elevated levels of blood glucose. Based on the pathophysiology of the disease and whom the disease may affect, diabetes mellitus is classified as type 1 diabetes, type 2 diabetes (T2D), or gestational diabetes [7]. Type 1 diabetes involves an autoimmune attack of pancreatic beta cells, which produce and secrete insulin. Destruction of these beta cells eventually leads to loss of insulin production [8]. To diagnose, the patient is screened for type 1 related autoimmune markers [9]. T2D involves impaired insulin action and, eventually, loss of insulin secretion in later stages due to insulin resistance. Insulin resistance occurs when a given amount of insulin produces less than normal physiological responses [10]. It contributes to reduced glucose uptake and utilization in organs and tissues such as muscle, the liver, and adipose tissue [7,11,12]. T2D is more common among adults; however, the prevalence rate in children is rising, especially for those of minority groups [13]. Gestational diabetes is diagnosed in women without preexisting diabetes during their 2nd or 3rd trimesters of pregnancy [14]. If diagnosed during the 1st trimester, it is considered preexisting T1D or T2D [14]. Following childbirth, women diagnosed as gestational diabetics are at an increased risk of developing T2D [15].
Diagnosis of T2D using Fasting Plasma Glucose (FPG), Oral Glucose Tolerance Tests (OGTT), and Glycated Hemoglobin A1C (HbA1c)
T2D can be diagnosed by measuring a patient’s fasting plasma glucose (FPG) and by using an oral glucose tolerance test (OGTT) [7,16]. FPG shows the plasma’s glucose level after fasting for eight hours or more. The ADA defines a FPG of ≥126mg/dL as a means for a diabetes diagnosis [7]. An OGTT measures blood glucose before and 2 hours after ingestion of 75 grams of glucose dissolved in water. The ADA states an OGTT ≥ 200mg/dL is related to diabetes [7]. An HbA1c test assesses the percent of hemoglobin glycosylation [16]. High glycosylation signifies prolonged elevation of blood glucose. The measurement of HbA1c reflects how well blood glucose is managed over the past two to three months (the lifespan of red blood cells). An HbA1c of >6.5% is associated with diabetes [16]. Table 1 shows the values of HbA1c, FPG, and OGTT in normal, prediabetic and type 2 diabetic subjects [7,16-18]. The values of FPG, OGTT and HbA1c show different aspects of T2D, and are helpful for people with diabetes to manage and control the disease progression. The use of one or more of them should be under the discretion of one’s primary care provider [7].
|
|
HbA1c |
FPG |
OGTT |
|
Normal |
<5.7% |
<100mg/dL |
< 140mg/dL |
|
Prediabetes |
5.7% to 6.4% |
100mg/dL to 125mg/dL |
140mg/dL to 199mg/dL |
|
Diabetes |
> 6.5% |
≥ 126mg/dL |
≥ 200mg/dL |
Stages of T2D
Two methods of categorizing stages of T2D have been proposed. One method of tracing the progression of T2D is by assessing the changes in pancreatic beta-cell mass and functionality. At the onset of insulin resistance, the pancreatic beta-cells grow and overproduce insulin to overcome barriers to glucose uptake. As the condition progresses, the beta-cells decrease in size and the pancreas can no longer sufficiently produce insulin. T2D is diagnosed once blood glucose concentrations are elevated and the insulin produced by the pancreas can no longer lower these levels.
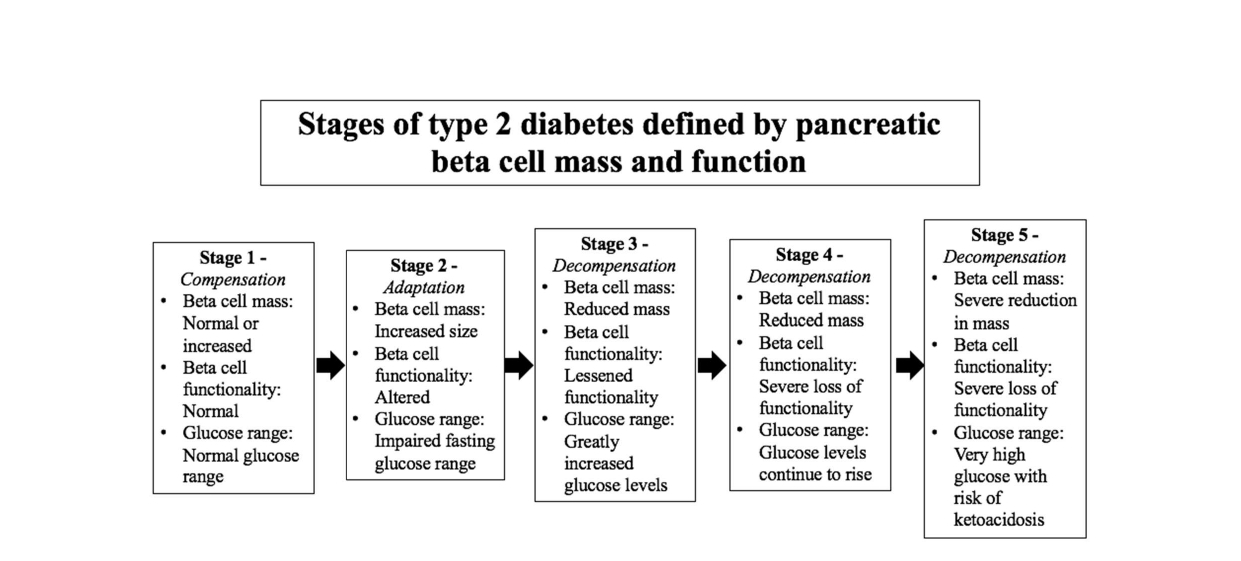
Figure 1 depicts five stages of T2D, as defined by the alteration of pancreatic beta-cell size, function, and appearance [19].
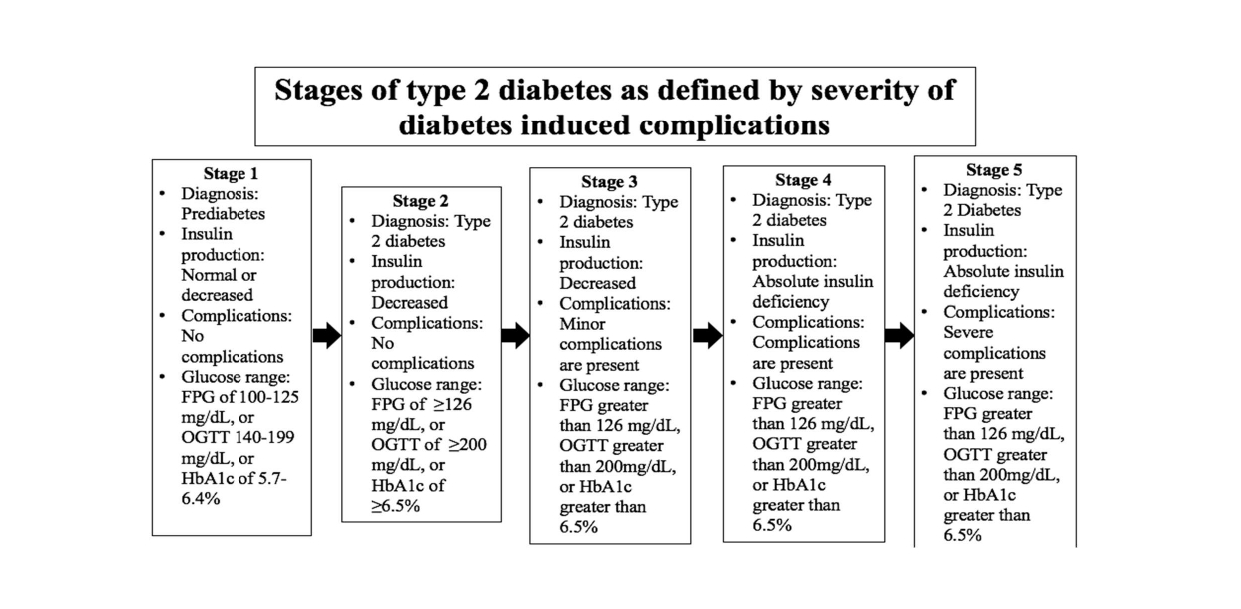
Figure 2. Proposed stages of T2D estimated by the increasing health complications resulting from the progression of the disease. T2D progression begins with prediabetes. As insulin resistance continues T2D is diagnosed, but no harmful complications are present. Stages 3 through 4 highlight increasing complications of T2D from less dangerous, to the inability to produce insulin, to severe and deadly complications of T2D [20].
Another proposed set of stages focuses on the increasing severity of diabetes-induced complications (Figure 2) [20]. At the onset of prediabetes, blood glucose levels are elevated but not to the degree that T2D may be diagnosed. As the disease develops, blood glucose levels increase and insulin secretion decreases. By stages 3 through 5, the person with diabetes will experience complications of increasing severity.
Results and Discussion
Age, body composition, and lifestyle behaviors including an unhealthy diet and low physical activity can be risk factors for T2D, especially when considered through the lens of gender differences (Figure 3) [21-30].
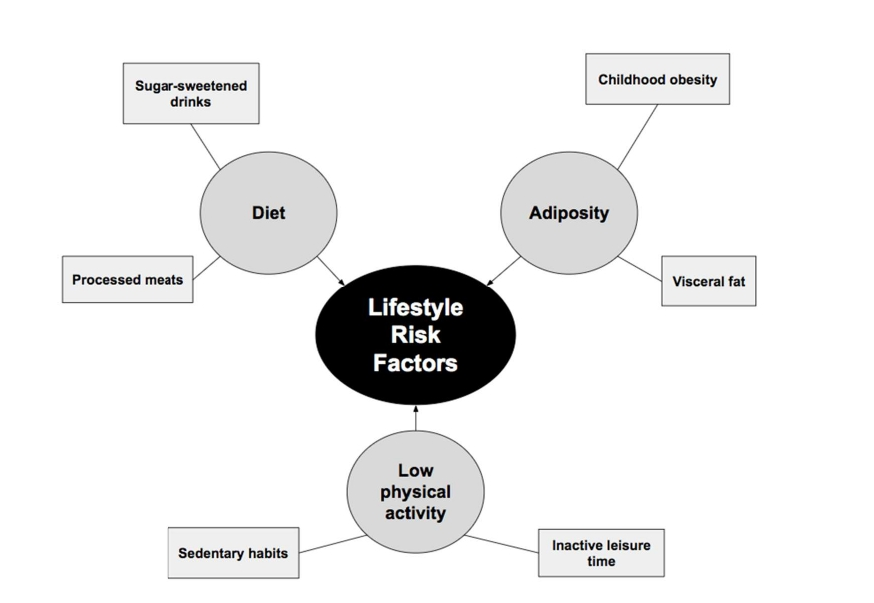
Figure 3. Lifestyle contributors to the development of T2D can be diet, adiposity, and a low physical activity level.
In 2012, 8.9% of U.S. males were reported to have diabetes, whereas 8.3% of U.S. females were reported to have diabetes [31]. Although these percentages are similar, research suggests that diabetes prevalence and risk may be influenced by gender-specific factors, such as the effects of hormones, differences in lifestyle, and physical variations between males and females.
Risk factors related to the development of T2D
Risk factors related to T2D development have been studied extensively.
Age: Age is not a gender specific factor for T2D development. T2D can occur in youths and in the elderly, although it is more common in adults compared to children. There are multiple contributing factors to adolescent diabetes including exposure to maternal diabetes and/or obesity in utero, being a member of a racial or ethnic minority group, and not being breastfeed as a newborn [32]. T2D rarely occurs in pre-pubertal children, as such, T2D is more commonly diagnosed during, or following, puberty. This is thought to be related to the decline in insulin sensitivity that occurs during puberty, around the same time that early-onset T2D is often diagnosed [33]. T2D has been known to be prevalent among the elderly. According to the ADA, 22-33% of U.S. adults aged 65 or older are diagnosed with diabetes [34]. Additional findings claim insulin secretion decreases by about 0.7% per year of life [35]. This decrease in secretion may contribute to insulin resistance which leads to T2D. It is important to know that the elderly have an increased risk of having diabetes, since they are also prone to have worse complications than younger people living with diabetes do. As such, it is recommended that adults 45 years of age and older are regularly screened for T2D using FPG, OGTT, or HbA1c [34].
According to a study analyzing data from the National Health Interview Survey (NHIS) conducted in 2016 and 2017, about 9.7% of U.S. adults have diabetes; an estimated 0.8% of this total is the prevalence for type 1 diabetes and other subtypes of diabetes, and 8.5% of the total represents type 2 diabetes prevalence [36]. Although T2D was prevalent at all ages in the study (20 to greater than 65 years of age), the majority of the studied adults with T2D were older than 65 years of age [36]. Essentially, any age can develop T2D, though the majority of those with the disease are older in age.
Dietary intake: Research suggests that diet is associated with T2D, specifically diets that are lacking in a variety of healthful foods yet are high in calories. Diets consisting of processed meats are associated with an increased risk of developing T2D [21]. Additionally, drinking sugar-sweetened drinks, especially those with real sugar, increases incidence of T2D [22]. The adoption of a Mediterranean diet and an increase in intake of fruit, whole grains, and dairy products, however, may be associated with a decreased risk of T2D [23,24]. Diets may vary significantly between men and women, which can increase or decrease one’s risk of developing T2D. In a study of younger adults from 23 different countries, less men reported attempting to eat according to healthy eating recommendations than women [37]. As addressed previously, healthier diets may serve as a protective factor against T2D. If it is possible that men are not making comparable food choices to women, and T2D risk is linked to diet, then the less-healthy food choices men may make could increase the risk of T2D among males. Furthermore, the study found that women consumed less fats and more fiber than men did, and most of the women studied ate more fruit – only a portion of this disparity was attributed to dieting in women [37]. Since it is possible that men and women may sustain different diets, it may be important to conduct further research on how this may impact each genders risk of developing T2D.
Body composition and physical differences: Obesity is a leading contributor to T2D risk. Adiposity, specifically in the abdomen, and the onset age of weight gain are associated with T2D development. Visceral fat located in the abdominal cavity is more greatly associated with the development of T2D than general adiposity that is less localized in the abdomen [28]. Research suggests that obesity leads to insulin resistance and impaired pancreatic beta-cell functioning [38]. When these complications develop, diabetes risk increases, often leading to an eventual diagnosis [38]. Additionally, childhood obesity may be linked to T2D in adulthood [27].
Results from multiple randomized clinical trials (RCTs) demonstrate that bariatric surgery treatments correct obesity and T2DM in human subjects [39]. These procedures reduce body weight and lower blood glucose more efficiently when compared to other interventions in people with T2DM [40-47]. Surgery treatments have been recommended for people with T2DM and obesity to control blood glucose [48]. Men are diagnosed with diabetes at younger ages and lower BMIs based on the results from a 2011 study [49]. Furthermore, diabetes onset for men appears to begin at a younger age than women [49]. Women have been found to have higher OGTT results than men, despite having lower fasting glucose levels [50]. This may be caused by the physical differences in height and muscle mass between men and women, and because each gender is given the same amount of glucose during the OGTT [50]. Using the same amount of glucose can potentially complicate screening results since men and women uptake glucose at different rates regardless of insulin resistance. More muscle mass equates faster glucose uptake, even if uptake is impaired overall. Physical differences between genders may suggest a need for specialized screening tactics based on gender, in order to produce accurate results.
Physical activity: Low physical activity is associated with an increased risk of T2D. Studies demonstrate that replacing sedentary activities with physical activities can increase insulin sensitivity [30]. T2D risks due to physical activity can be lessened with small changes such as being physically active during leisure time, walking more, and doing cardiorespiratory workouts [25,29].
Research findings reflect that physical activity rates and types of physical activity can vary between men and women. According to a study of the European nations, men reported higher physical activity than women did [51]. This is notable as lower amounts of physical activity are associated with higher risk of T2D risk, which may increase risk of T2D among less-active women.
Race: Race is associated with an increased risk of T2D, but is not a gender specific factor for T2D development. According to the National Health Interview Survey (2012) certain races have higher rates of diabetes prevalence than others [31]. Native Americans and Alaskan Natives have the highest percentage of diabetes among U.S. adults at 17.9% (Table 2) [31]. Furthermore, the percentages of diabetes prevalence appear to be rising, evident from the 1.4% increase in prevalence from 2008 to 2012 [31,52]. Diabetes prevalence of Native Americans may vary based on the location of the tribal group. It is the highest in the Plains, the Southwest, and the Woodlands, with Pacific Coastal tribes maintaining the lowest rates [53].
|
Ethnicity
|
Native American and Alaskan Native
|
Black or African American |
Latino |
Mexican American
|
Asian American
|
Native Hawaiian and other Pacific Islanders
|
White |
|
Diabetes Rate |
17.9% |
13.1% |
12.2% |
13.1% |
8.9% |
7.9% |
7.3% |
The Pima Indians of Arizona and the Sierra Madre Mountains of Mexico serve a notable example of the effects of environmental and dietary habits on diabetes prevalence [54]. The U.S. Pima Indians have the highest recorded rates of diabetes of any group in the U.S. [55]. Although genetically similar, U.S. Pima Indians had lower physical activity and higher obesity than Mexican Pima Indians, which contributed to higher rates of diabetes [54]. Nonetheless, newer research suggests that increased insulin resistance among U.S. Pima Indians is much greater than Mexican Pima Indians, which implies that lifestyle is not the only contributor to the U.S. Pima’s increased prevalence of diabetes [56]. Black or African Americans have the second highest percentage at 13.1% (Table 2) [31]. A meta-analysis reflects that African Americans have HbA1c levels about 0.65% higher than non-Hispanic white individuals [57]. Researchers have tried to explain the higher HbA1c level of African Americans through differences in socioeconomic status and obesity/central adiposity [58-60]. Increased rates of T2D among 40 to 70-year-old African American women may be due to economic disadvantages [60]. However, diabetes rate disparities between African Americans and non-Hispanic white adults differ the most at the lowest economic level, which implies lower economic status is not the greatest contributor to African American T2D prevalence [59]. Regarding adiposity, a study of premenopausal women indicates that African American women have higher prevalence of insulin resistance than white females. The study conjectures that this difference is partially due to a higher skeletal muscle mass among African American women. Regardless, the difference in skeletal muscle mass and adipose tissue amounts are not enough to provide the ultimate cause in insulin resistance disparity [58].
Latino individuals and Mexican or Mexican Americans have diabetes percentages of 12.2%, and 13.1%, respectively (Table 2) [31]. A meta-analysis shows that the HbA1c level among Hispanic persons with diabetes was about 0.5% higher than that of non-Hispanic white subjects, showing the effects of genetics, healthcare access, and adherence to diabetes regimens [61]. Furthermore, Hispanic individuals have an increased risk of developing diabetes throughout their lifetime. Hispanic individuals born in the year 2000 have a 1 in 2 risk of developing diabetes. These are greater odds than the risk that all men born in 2000 have, which is 1 in 3, and the risk that all women born in 2000 have, which is 2 in 5 [62]. Country of origin affects diabetes risk for Latinos as well [63]. Compared to non-Hispanic white adults, Cubans have the second-lowest risk. Risk increases for South Americans, Central Americans, Mexicans, Puerto Ricans, and Dominicans in that order from the lowest to the highest [63]. Asian American adults have the third-highest percentage of T2D equating to 8.9% (Table 2) [31]. Increased rates of diabetes are found for Asian Americans versus Asian individuals living in China, Korea, and Vietnam. These disparities are thought to be linked to increased consumption of high caloric foods and less physical activity among Asian Americans [64]. Nonetheless, genetics contribute significantly to the increased diabetes prevalence of Asian Americans versus non-Hispanic white Americans. When BMI is included in calculating diabetes prevalence, Asian Americans have a much greater chance of developing diabetes than non-Hispanic white Americans [65]. Despite higher education, abstinence from drinking and smoking, and lower BMIs, Asian individuals were found to have a 30% higher risk of developing diabetes compared to non-Hispanic white individuals [66]. As a result, it is recommended that screening for T2D in Asian Americans begins at a BMI of 23 or higher [67]. Genetics, acculturation, and a predisposition to have more visceral fat at any BMI are considered contributors to Asian Americans’ increased risk [66]. Native Hawaiian and other Pacific Islanders have a diabetes prevalence of 7.9% (Table 2) [31]. This group has a higher risk of developing diabetes at the age of 35 and older than non-Hispanic whites who have a prevalence of 7.3% [68]. When recording diabetes prevalence rates, ethnicities are often grouped by their regional association; however, this practice may mask the higher rates of diabetes found in the subgroups. It has been proposed that Pacific Islander, South Asian, and Filipino Americans have the highest incidences of diabetes compared to any other ethnicity group, but this outcome is disguised by the differential rates of subgroups with larger populations [69]. These findings may reflect a necessity for altered methods of obtaining diabetes records in the future. Globally, diabetes rates vary significantly among different countries. Once adjusted for age, the Middle East and North Africa had the highest prevalence of diabetes at a rate of 10.9%. In the Middle East and North Africa, there were 34.6 million adults at 18 years old to 79 years old diagnosed with diabetes in 2013 [4]. North America and the Caribbean had the second-highest prevalence rate of 9.6%, which equates to 36.7 million diagnosed adults. South East Asia had a prevalence of 8.7% and 72.1 million diagnosed diabetics, followed by South and Central American which had a prevalence of 8.2% and 24.1 million diagnosed. The Western Pacific region had a prevalence rate of 8.1% with 138.2 million diagnosed diabetics. Europe had a percentage of 6.8% for diabetes prevalence, which equates to 56.3 million diagnosed diabetics. Africa had the lowest prevalence rate for diabetes, 5.7%, of all the regions studied, and had the least amount of diagnosed diabetes, at 19.8 million. However, it is estimated that Africa will have a large increase in cases by 2035 [4]. Africa’s rapid increase in diabetes prevalence poses significant complications for Africa’s populations. Sub-Saharan Africa’s lack of knowledge and resources for its treatment needs to be addressed [70]. Epidemiology studies of T2D risk factors have identified lifestyle [71172], age [73], and race [74-76] as major determinants. The purpose of this review is to provide a comprehensive analysis of the effect of gender – or one’s biological sex – on T2D risk and development.
Hormones: Current research connects insulin resistance and T2D with abnormal levels of hormones. Hyperandrogenicity, an excess of androgens, is measured by plasma sex-hormone-binding globulin (SHBG) levels and associated with T2D risk [77,78]. Since testosterone has a higher affinity for SHBG than estradiol does, SHBG’s availability greatly affects testosterone amounts [77]. Increased SHBG levels means that more testosterone and estradiol are available. In women, low SHBG levels predict higher T2D risk, regardless of weight, age, or blood glucose [78]. Causality may be attributed to low SHBG levels that may lower insulin sensitivity of muscles in women. Conversely, other researchers claim that hyperandrogenicity is a result of high insulin levels, and not a cause [78].
The increased binding of testosterone associated with elevated SHBG levels can reduce the risk of T2D in women and increase risk in men because of the decrease in available testosterone [77]. Research suggests that low testosterone affects obese males more than nonobese men [79,80]. Low levels of SHBG and excess testosterone can increase T2D risk in women, and decrease risk in men [77,81]. Lower estradiol in men predicts lower risk of T2D [79]. However, free testosterone unbound to SHBG is not an accurate marker for insulin resistance and diabetes independent of obesity [82,83]. Testosterone therapy has successfully lowered HbA1c percentages of men. HbA1c levels of men with over 7.5% HbA1c, decreased by 0.41% within six weeks and decreased by 0.46% after a year of testosterone therapy [84]. Bioavailable estradiol may predict insulin resistance in women [81]. As women experience menopause, their estrogen levels drop, which may increase abdominal weight gain [85]. Postmenopausal women form estradiol through the aromatization of testosterone. Higher estrogen may result from higher androgen levels, which is known to predict diabetes risk [86]. Additionally, hormone replacement therapy in postmenopausal women may lower fasting glucose but it impairs glucose tolerance [87]. Leptin may be used to predict T2D risk among men only. Leptin regulates appetite and energy expenditure [88]. Its level increases with the development of obesity. Increased leptin levels in men seem to be associated with greater insulin resistance. However, this is not true for women, possibly due to higher levels of subcutaneous fat, which produces more leptin in women than in men. As a result, changes in leptin levels because of weight gain may affect men more so than women, since males are not accustomed to elevated levels of leptin [89]. In one clinical trial, androgen therapy increased insulin sensitivity and lessened male leptin levels [90].
T2D screening differences: Women are more likely than men to utilize T2D screening tests, according to a study conducted in the U.S. Potential causes of this disparity may be that women, in their years of fertility, are screened more often than men and that women view diabetes as a greater hindrance in their daily lives than men do. Since women are more attuned to the negative impacts of diabetes, they may seek screenings more often than men [91]. The fact that women are more likely than men to seek T2D screening suggests that screening approaches could potentially be altered to include men that do not seek screening on their own.
Female-specific predictors of T2D
Women have some gendered risk factors of T2D involving the age of menarche, the prevalence of polycystic ovary syndrome (PCOS), and the age of menopause.
Early menarche: Early age of menarche has been linked to increased diabetes risk; however, this is most likely due to a higher BMI throughout the lifespan [92].
Gestational diabetes: Having a history of gestational diabetes has been linked to an increased risk of developing T2D in the future. Of women who had a history of gestational diabetes and were not given metformin or provided lifestyle interventions, 48% developed T2D within 10 years [93].
PCOS: PCOS develops due to sex hormone imbalances. This disease causes waterfilled cysts to form on an ovary, which prevents the egg from releasing to be fertilized and prevents ovulation. PCOS involves many of these cysts forming on the ovary [94]. Women diagnosed with PCOS typically have significant insulin resistance, regardless of body weight [95]. This insulin resistance can progress to T2D. One study shows that a significant number (54%) of women who previously had impaired glucose tolerance progressed to T2D in less than 10 years [96]. Additionally, research suggests that those with PCOS secrete increased amounts of insulin in compensation for increased insulin resistance due to the disease [97].
Early menopause: Diabetes risk increases for women entering menopause before the age of 40. One study claims that among those studied, early onset menopause was associated with a 32% increase in risk of T2D versus women entering menopause from 50 to 54 years old [98].
Conclusion and Perspectives
T2D has sexually dimorphic risk factors ranging from differences in hormone levels, lifestyle, physical appearance, and female menstrual/hormonal factors. The prevalence of testosterone and estrogen can be detrimental or beneficial to diabetes risk depending on the gender of the subject. Lifestyle, which has been known to affect T2D risk, is also influenced by gender differences, with women eating healthier and men participating in higher amounts of physical activity. Height, obesity and adipose depots, and muscle mass all impact T2D risk in men and women, and these factors are often influenced by gender differences. Furthermore, women have unique risks for diabetes, such as gestational diabetes and PCOS. With these findings, the need for increased research on gender influences on diabetes risk and progression is obvious. Further research may assess the effectiveness of hormone therapy on prediabetics and diabetics, so hormone therapy may one day be a treatment for T2D caused due to this dimorphism. Likewise, continued research may find ways to adapt lifestyle adjustments for men and women, based on the knowledge that men are less likely to be nutritionally conscious, while women are less likely to be physically active. With the global obesity epidemic, future research should further analyze why obesity impacts T2D risk differently amongst women and men [99]. Lastly, studies should look further into how menstruation and menopause onset, PCOS, and gestational diabetes manifest. Moreover, researchers must decipher whether these traits are diabetes risk factors in and of themselves, or whether there is another outside factor that makes women more likely to have these traits and develop diabetes.
Acknowledgements
I wish to thank my family for supporting me throughout my academic career, and for always nurturing my desire to learn. Additionally, I would like to thank the University of Tennessee for providing me the resources I needed to achieve my goals. To all involved, thank you for believing in me.
References
2. Ogurtsova K, da Rocha Fernandes JD, Huang Y, Linnenkamp U, Guariguata L, Cho NH, et al. IDF Diabetes Atlas: Global estimates for the prevalence of diabetes for 2015 and 2040. Diabetes Research and Clinical Practice. 2017 Jun 1;128:40-50.
3. (U.S.) CfDCaP. National Diabetes Statistics Report, 2017 2017 [Available from: https://www.cdc.gov/diabetes/pdfs/data/statistics/national-diabetes-statistics-report.pdf.
4. Guariguata L, Whiting DR, Hambleton I, Beagley J, Linnenkamp U, Shaw JE. Global estimates of diabetes prevalence for 2013 and projections for 2035. Diabetes Research and Clinical Practice. 2014 Feb 1;103(2):137-49..
5. Cho N, Shaw JE, Karuranga S, Huang Y, da Rocha Fernandes JD, Ohlrogge AW, et al. IDF Diabetes Atlas: Global estimates of diabetes prevalence for 2017 and projections for 2045. Diabetes Research and Clinical Practice. 2018 Apr 1;138:271-81.
6. American Diabetes Association. Economic costs of diabetes in the US in 2017. Diabetes Care. 2018 May 1;41(5):917-28.
7. American Diabetes Association. 2. Classification and diagnosis of diabetes: standards of medical care in diabetes-2018. Diabetes Care. 2018 Jan 1;41(Supplement 1):S13-27.
8. Burrack AL, Martinov T, Fife BT. T cell-mediated beta cell destruction: autoimmunity and alloimmunity in the context of type 1 diabetes. Frontiers in Endocrinology. 2017 Dec 5;8:343.
9. Knip M, Siljander H, Ilonen J, Simell O, Veijola R. Role of humoral beta‐cell autoimmunity in type 1 diabetes. Pediatric Diabetes. 2016 Jul;17:17-24.
10. McGarry JD. Banting lecture 2001: dysregulation of fatty acid metabolism in the etiology of type 2 diabetes. Diabetes. 2002 Jan 1;51(1):7-18.
11. Carlsson S. Etiology and pathogenesis of latent autoimmune diabetes in adults (LADA) compared to type 2 diabetes. Frontiers in Physiology. 2019 Mar 26;10:320.
12. Scheen AJ. Pathophysiology of type 2 diabetes. Acta Clinica Belgica. 2003 Dec 1;58(6):335-41.
13. Dabelea D, Bell RA, D'Agostino Jr RB, Imperatore G, Johansen JM, Linder B, et al. Incidence of diabetes in youth in the United States. Jama. 2007 Jun 1;297(24):2716-24.
14. Buchanan TA, Xiang AH, Page KA. Gestational diabetes mellitus: risks and management during and after pregnancy. Nature Reviews Endocrinology. 2012 Nov;8(11):639-49.
15. Kim C, Newton KM, Knopp RH. Gestational diabetes and the incidence of type 2 diabetes: a systematic review. Diabetes Care. 2002 Oct 1;25(10):1862-8.
16. Pippitt K, Li M, Gurgle HE. Diabetes mellitus: screening and diagnosis. American Family Physician. 2016 Jan 15;93(2):103-9.
17. American Diabetes Association. Diagnosis and classification of diabetes mellitus. Diabetes Care. 2018; 41(Supplement 1):S81-90.
18. American Diabetes Association. Standards of Medical Care in Diabetes-2017 Abridged for Primary Care Providers. Clinical Diabetes. 2017;35(1):5-26.
19. Weir GC, Bonner-Weir S. Five stages of evolving beta-cell dysfunction during progression to diabetes. Diabetes. 2004 Dec 1;53(suppl 3):S16-21.
20. Wu SL. Staging of type 2 diabetes mellitus. Genetics and Molecular Research. 2015 Mar 20;14(1):2118-21.
21. Rohrmann S, Linseisen J. Processed meat: the real villain?. Proceedings of the Nutrition Society. 2016 Aug;75(3):233-41.
22. Greenwood DC, Threapleton DE, Evans CE, Cleghorn CL, Nykjaer C, Woodhead C, et al. Association between sugar-sweetened and artificially sweetened soft drinks and type 2 diabetes: systematic review and dose–response meta-analysis of prospective studies. British Journal of Nutrition. 2014 Sep;112(5):725-34.
23. Schwingshackl L, Hoffmann G, Lampousi AM, Knüppel S, Iqbal K, Schwedhelm C, Bechthold A, Schlesinger S, Boeing H. Food groups and risk of type 2 diabetes mellitus: a systematic review and meta-analysis of prospective studies. European Journal of Epidemiology. 2017;32(5):363-75.
24. Schwingshackl L, Missbach B, König J, Hoffmann G. Adherence to a Mediterranean diet and risk of diabetes: a systematic review and meta-analysis. Public Health Nutrition. 2015 May;18(7):1292-9.
25. Aune D, Norat T, Leitzmann M, Tonstad S, Vatten LJ. Physical activity and the risk of type 2 diabetes: a systematic review and dose–response meta-analysis. European Journal of Epidemiology. 2015;30(7):529-42.
26. Fenger M, Hansen DL, Worm D, Hvolris L, Kristiansen VB, Carlsson ER, et al. Gastric bypass surgery reveals independency of obesity and diabetes melitus type 2. BMC Endocrine Disorders. 2016 Dec 1;16(1):59.
27. Hou D, Zhao X, Liu J, Chen F, Yan Y, Cheng H, et al. Association of childhood and adolescents obesity with adult diabetes. Zhonghua yu fang yi xue za zhi [Chinese Journal of Preventive Medicine]. 2016 Jan;50(1):23-7.
28. Neeland IJ, Turer AT, Ayers CR, Powell-Wiley TM, Vega GL, Farzaneh-Far R, et al. Dysfunctional adiposity and the risk of prediabetes and type 2 diabetes in obese adults. Jama. 2012 Sep 19;308(11):1150-9.
29. Smith AD, Crippa A, Woodcock J, Brage S. Physical activity and incident type 2 diabetes mellitus: a systematic review and dose–response meta-analysis of prospective cohort studies. Diabetologia. 2016;59(12):2527-45.
30. Yates T, Henson J, Edwardson C, Dunstan D, Bodicoat DH, Khunti K, et al. Objectively measured sedentary time and associations with insulin sensitivity: Importance of reallocating sedentary time to physical activity. Preventive Medicine. 2015 Jul 1;76:79-83.
31. Blackwell DL, Lucas JW, Clarke TC. Summary health statistics for US adults: national health interview survey, 2012. Vital and health statistics. Series 10, Data from the National Health Survey. 2014 Feb(260):1..
32. Jensen ET, Dabelea D. Type 2 diabetes in youth: new lessons from the SEARCH study. Current Diabetes Reports. 2018 Jun 1;18(6):36.
33. Kao KT, Sabin MA. Type 2 diabetes mellitus in children and adolescents. Australian Family Physician. 2016 Jun;45(6):401.
34. Kirkman MS, Briscoe VJ, Clark N, Florez H, Haas LB, Halter JB, et al. Diabetes in older adults. Diabetes care. 2012 Dec 1;35(12):2650-64.
35. Szoke E, Shrayyef MZ, Messing S, Woerle HJ, Van Haeften TW, Meyer C, et al. Effect of aging on glucose homeostasis: accelerated deterioration of β-cell function in individuals with impaired glucose tolerance. Diabetes Care. 2008 Mar 1;31(3):539-43.
36. Xu G, Liu B, Sun Y, Du Y, Snetselaar LG, Hu FB, et al. Prevalence of diagnosed type 1 and type 2 diabetes among US adults in 2016 and 2017: population based study. BMJ. 2018 Sep 4;362:k1497.
37. Wardle J, Haase AM, Steptoe A, Nillapun M, Jonwutiwes K, Bellisie F. Gender differences in food choice: the contribution of health beliefs and dieting. Annals of Behavioral Medicine. 2004 Apr 1;27(2):107-16.
38. Al-Goblan AS, Al-Alfi MA, Khan MZ. Mechanism linking diabetes mellitus and obesity. Diabetes, Metabolic Syndrome and Obesity: Targets and Therapy. 2014;7:587.
39. Gloy VL, Briel M, Bhatt DL, Kashyap SR, Schauer PR, Mingrone G, et al. Bariatric surgery versus non-surgical treatment for obesity: a systematic review and meta-analysis of randomised controlled trials. BMJ. 2013 Oct 22;347:f5934.
40. Mingrone G, Panunzi S, De Gaetano A, Guidone C, Iaconelli A, Leccesi L, et al. Bariatric surgery versus conventional medical therapy for type 2 diabetes. New England Journal of Medicine. 2012 Apr 26;366(17):1577-85.
41. Schauer PR, Kashyap SR, Wolski K, Brethauer SA, Kirwan JP, Pothier CE, et al. Bariatric surgery versus intensive medical therapy in obese patients with diabetes. New England Journal of Medicine. 2012 Apr 26;366(17):1567-76.
42. Mingrone G, Panunzi S, De Gaetano A, Guidone C, Iaconelli A, Nanni G, et al. Bariatric–metabolic surgery versus conventional medical treatment in obese patients with type 2 diabetes: 5 year follow-up of an open-label, single-centre, randomised controlled trial. The Lancet. 2015 Sep 5;386(9997):964-73.
43. Cummings DE, Arterburn DE, Westbrook EO, Kuzma JN, Stewart SD, Chan CP, et al. Gastric bypass surgery vs intensive lifestyle and medical intervention for type 2 diabetes: the CROSSROADS randomised controlled trial. Diabetologia. 2016 May 1;59(5):945-53.
44. Halperin F, Ding SA, Simonson DC, Panosian J, Goebel-Fabbri A, Wewalka M, et al. Roux-en-Y gastric bypass surgery or lifestyle with intensive medical management in patients with type 2 diabetes: feasibility and 1-year results of a randomized clinical trial. JAMA surgery. 2014 Jul 1;149(7):716-26.
45. Ikramuddin S, Korner J, Lee WJ, Connett JE, Inabnet WB, Billington CJ, Thomas AJ, Leslie DB, Chong K, Jeffery RW, Ahmed L. Roux-en-Y gastric bypass vs intensive medical management for the control of type 2 diabetes, hypertension, and hyperlipidemia: the Diabetes Surgery Study randomized clinical trial. Jama. 2013 Jun 5;309(21):2240-9.
46. Courcoulas AP, Goodpaster BH, Eagleton JK, Belle SH, Kalarchian MA, Lang W, et al. Surgical vs medical treatments for type 2 diabetes mellitus: a randomized clinical trial. JAMA Surgery. 2014 Jul 1;149(7):707-15.
47. Courcoulas AP, Belle SH, Neiberg RH, Pierson SK, Eagleton JK, Kalarchian MA, et al. Three-year outcomes of bariatric surgery vs lifestyle intervention for type 2 diabetes mellitus treatment: a randomized clinical trial. JAMA Surgery. 2015 Oct 1;150(10):931-40.
48. Rubino F, Nathan DM, Eckel RH, Schauer PR, Alberti KG, Zimmet PZ, et al. Metabolic surgery in the treatment algorithm for type 2 diabetes: a joint statement by international diabetes organizations. Surgery for Obesity and Related Diseases. 2016 Jul 1;12(6):1144-62.
49. Logue J, Walker JJ, Colhoun HM, Leese GP, Lindsay RS, McKnight JA, et al. Do men develop type 2 diabetes at lower body mass indices than women?. Diabetologia. 2011 Dec 1;54(12):3003-6.
50. Sicree RA, Zimmet PZ, Dunstan DW, Cameron AJ, Welborn TA, Shaw JE. Differences in height explain gender differences in the response to the oral glucose tolerance test—the AusDiab study. Diabetic Medicine. 2008 Mar;25(3):296-302.
51. Gerovasili V, Agaku IT, Vardavas CI, Filippidis FT. Levels of physical activity among adults 18–64 years old in 28 European countries. Preventive Medicine. 2015 Dec 1;81:87-91.
52. Barnes PM, Adams PF, Powell-Griner E. Health characteristics of the American Indian or Alaska native adult population, United States, 2004-2008. National Health Statistics Reports. 2010(20):1-22.
53. Centers for Disease Control and Prevention (CDC. Prevalence of diagnosed diabetes among American Indians/Alaskan Natives--United States, 1996. MMWR. Morbidity and mortality weekly report. 1998 Oct 30;47(42):901.
54. Schulz LO, Bennett PH, Ravussin E, Kidd JR, Kidd KK, Esparza J, et al. Effects of traditional and western environments on prevalence of type 2 diabetes in Pima Indians in Mexico and the US. Diabetes Care. 2006 Aug 1;29(8):1866-71.
55. Bennett P, Burch T, Miller M. Diabetes mellitus in American (Pima) indians. The Lancet. 1971 Jul 17;298(7716):125-8.
56. Esparza-Romero J, Valencia ME, Martinez ME, Ravussin E, Schulz LO, Bennett PH. Differences in insulin resistance in Mexican and US Pima Indians with normal glucose tolerance. The Journal of Clinical Endocrinology & Metabolism. 2010 Nov 1;95(11):E358-62.
57. Kirk JK, D’Agostino RB, Bell RA, Passmore LV, Bonds DE, Karter AJ, et al. Disparities in HbA1c levels between African-American and non-Hispanic white adults with diabetes: a meta-analysis. Diabetes Care. 2006 Sep 1;29(9):2130-6.
58. Albu JB, Kovera AJ, Allen L, Wainwright M, Berk E, Raja-Khan N, et al. Independent association of insulin resistance with larger amounts of intermuscular adipose tissue and a greater acute insulin response to glucose in African American than in white nondiabetic women. The American Journal of Clinical Nutrition. 2005 Dec 1;82(6):1210-7.
59. Brancati FL, Whelton PK, Kuller LH, Klag MJ. Diabetes mellitus, race, and socioeconomic status a population-based study. Annals of Epidemiology. 1996 Jan 1;6(1):67-73.
60. Schauer PR, Kashyap SR, Wolski K, Brethauer SA, Kirwan JP, Pothier CE, et al. Bariatric surgery versus intensive medical therapy in obese patients with diabetes. New England Journal of Medicine. 2012 Apr 26;366(17):1567-76.
61. Kirk JK, Passmore LV, Bell RA, Narayan KV, D'Agostino RB, Arcury TA, et al. Disparities in A1C levels between Hispanic and non-Hispanic white adults with diabetes: a meta-analysis. Diabetes Care. 2008 Feb 1;31(2):240-6.
62. Narayan KV, Boyle JP, Thompson TJ, Sorensen SW, Williamson DF. Lifetime risk for diabetes mellitus in the United States. Jama. 2003 Oct 8;290(14):1884-90.
63. Avilés-Santa ML, Hsu LL, Arredondo M, Menke A, Werner E, Thyagarajan B, et al. Differences in hemoglobin a1c between hispanics/latinos and non-hispanic whites: an analysis of the hispanic community health study/study of latinos and the 2007–2012 national health and nutrition examination survey. Diabetes Care. 2016 Jun 1;39(6):1010-7.
64. Stewart SL, Dang J, Chen MS. Diabetes prevalence and risk factors in four Asian American communities. Journal of Community Health. 2016 Dec 1;41(6):1264-73.
65. McNeely MJ, Boyko EJ. Type 2 diabetes prevalence in Asian Americans: results of a national health survey. Diabetes Care. 2004 Jan 1;27(1):66-9.
66. Lee JW, Brancati FL, Yeh HC. Trends in the prevalence of type 2 diabetes in Asians versus whites: results from the United States National Health Interview Survey, 1997–2008. Diabetes Care. 2011 Feb 1;34(2):353-7.
67. American Diabetes Association. Standards of medical care in diabetes—2015: summary of revisions.;38 Suppl:S4.
68. Uchima O, Wu YY, Browne C, Braun KL. Peer Reviewed: Disparities in Diabetes Prevalence Among Native Hawaiians/Other Pacific Islanders and Asians in Hawai ‘i. Preventing Chronic Disease. 2019;16.
69. Karter AJ, Schillinger D, Adams AS, Moffet HH, Liu J, Adler NE, et al. Elevated rates of diabetes in Pacific Islanders and Asian subgroups: the Diabetes Study of Northern California (DISTANCE). Diabetes Care. 2013 Mar 1;36(3):574-9.
70. Zimmermann M, Bunn C, Namadingo H, Gray CM, Lwanda J. Experiences of type 2 diabetes in sub-Saharan Africa: a scoping review. Global Health Research and Policy. 2018 Dec 1;3(1):25.
71. Zheng Y, Ley SH, Hu FB. Global aetiology and epidemiology of type 2 diabetes mellitus and its complications. Nature Reviews Endocrinology. 2018 Feb;14(2):88.
72. Kolb H, Martin S. Environmental/lifestyle factors in the pathogenesis and prevention of type 2 diabetes. BMC Medicine. 2017 Dec;15(1):131.
73. Fletcher B, Gulanick M, Lamendola C. Risk factors for type 2 diabetes mellitus. Journal of Cardiovascular Nursing. 2002 Jan 1;16(2):17-23.
74. Aambo A, Klemsdal TO. Cardiovascular disease and diabetes in patients with African or Asian background. Tidsskr Nor Laegeforen. 2017 Nov 28;137(22).
75. Staiano AE, Harrington DM, Johannsen NM, Newton Jr RL, Sarzynski MA, Swift DL, et al. Uncovering physiological mechanisms for health disparities in type 2 diabetes. Ethnicity & Disease. 2015;25(1):31.
76. Chatterjee R, Maruthur NM, Edelman D. Novel risk factors for type 2 diabetes in African-Americans. Current Diabetes Reports. 2015 Dec 1;15(12):103..
77. Ding EL, Song Y, Malik VS, Liu S. Sex differences of endogenous sex hormones and risk of type 2 diabetes: a systematic review and meta-analysis. Jama. 2006 Mar 15;295(11):1288-99.
78. Lindstedt G, Lundberg PA, Lapidus L, Lundgren H, Bengtsson C, Björntorp P. Low sex-hormone-binding globulin concentration as independent risk factor for development of NIDDM: 12-yr follow-up of population study of women in Gothenburg, Sweden. Diabetes. 1991 Jan 1;40(1):123-8.
79. Li J, Lai H, Chen S, Zhu H, Lai S. Interaction of sex steroid hormones and obesity on insulin resistance and type 2 diabetes in men: the Third National Health and Nutrition Examination Survey. Journal of Diabetes and its Complications. 2017 Feb 1;31(2):318-27.
80. Liu YL, Sennitt MV, Hislop DC, Crombie DL, Heyman RA, Cawthorne MA. Retinoid X receptor agonists have anti-obesity effects and improve insulin sensitivity in Zucker fa/fa rats. International Journal of Obesity. 2000 Aug;24(8):997-1004.
81. Kalish GM, Barrett-Connor E, Laughlin GA, Gulanski BI. Association of endogenous sex hormones and insulin resistance among postmenopausal women: results from the Postmenopausal Estrogen/Progestin Intervention Trial. The Journal of Clinical Endocrinology & Metabolism. 2003 Apr 1;88(4):1646-52.
82. Abate N, Haffner SM, Garg A, Peshock RM, Grundy SM. Sex steroid hormones, upper body obesity, and insulin resistance. The Journal of Clinical Endocrinology & Metabolism. 2002 Oct 1;87(10):4522-7.
83. Tsai EC, Matsumoto AM, Fujimoto WY, Boyko EJ. Association of bioavailable, free, and total testosterone with insulin resistance: influence of sex hormone-binding globulin and body fat. Diabetes Care. 2004 Apr 1;27(4):861-8.
84. Hackett G, Cole N, Bhartia M, Kennedy D, Raju J, Wilkinson P, et al. Testosterone replacement therapy improves metabolic parameters in hypogonadal men with type 2 diabetes but not in men with coexisting depression: the BLAST study. The Journal of Sexual Medicine. 2014 Mar 1;11(3):840-56.
85. Tchernof A, Després JP. Sex steroid hormones, sex hormone-binding globulin, and obesity in men and women. Hormone and Metabolic Research. 2000 Jan;32(11/12):526-36.
86. Oh JY, Barrett-Connor E, Wedick NM, Wingard DL. Endogenous sex hormones and the development of type 2 diabetes in older men and women: the Rancho Bernardo study. Diabetes Care. 2002 Jan 1;25(1):55-60.
87. van Genugten RE, Utzschneider KM, Tong J, Gerchman F, Zraika S, Udayasankar J, et al. Effects of sex and hormone replacement therapy use on the prevalence of isolated impaired fasting glucose and isolated impaired glucose tolerance in subjects with a family history of type 2 diabetes. Diabetes. 2006 Dec 1;55(12):3529-35.
88. Anubhuti, Arora S. Leptin and its metabolic interactions–an update. Diabetes, Obesity and Metabolism. 2008 Nov;10(11):973-93.
89. Chen GC, Qin LQ, Ye JK. Leptin levels and risk of type 2 diabetes: gender‐specific meta‐analysis. Obesity Reviews. 2014 Feb;15(2):134-42.
90. Simon D, Charles MA, Lahlou N, Nahoul K, Oppert JM, Gouault-Heilmann M, et al. Androgen therapy improves insulin sensitivity and decreases leptin level in healthy adult men with low plasma total testosterone: a 3-month randomized placebo-controlled trial. Diabetes care. 2001 Dec 1;24(12):2149-51.
91. Xie X, Wang N, Liu Y. Gender disparities in the associations of behavioral factors, serious psychological distress and chronic diseases with type 2 diabetes screening among US adults. Global Health Research and Policy. 2018 Dec 1;3(1):9.
92. Lakshman R, Forouhi N, Luben R, Bingham S, Khaw K, Wareham N, et al. Association between age at menarche and risk of diabetes in adults: results from the EPIC-Norfolk cohort study. Diabetologia. 2008 May 1;51(5):781-6.
93. Aroda VR, Christophi CA, Edelstein SL, Zhang P, Herman WH, Barrett-Connor E, et al. The effect of lifestyle intervention and metformin on preventing or delaying diabetes among women with and without gestational diabetes: the Diabetes Prevention Program outcomes study 10-year follow-up. The Journal of Clinical Endocrinology & Metabolism. 2015 Apr 1;100(4):1646-53.
94. Patel S. Polycystic ovary syndrome (PCOS), an inflammatory, systemic, lifestyle endocrinopathy. The Journal of Steroid Biochemistry and Molecular Biology. 2018 Sep 1;182:27-36.
95. Park KH, Kim JY, Ahn CW, Song YD, Lim SK, Lee HC. Polycystic ovarian syndrome (PCOS) and insulin resistance. International Journal of Gynecology & Obstetrics. 2001 Sep 1;74(3):261-7.
96. Norman RJ, Masters L, Milner CR, Wang JX, Davies MJ. Relative risk of conversion from normoglycaemia to impaired glucose tolerance or non-insulin dependent diabetes mellitus in polycystic ovarian syndrome. Human Reproduction. 2001 Sep 1;16(9):1995-8.
97. Goodarzi MO, Erickson S, Port SC, Jennrich RI, Korenman SG. β-cell function: a key pathological determinant in polycystic ovary syndrome. The Journal of Clinical Endocrinology & Metabolism. 2005 Jan 1;90(1):310-5.
98. Brand JS, Van Der Schouw YT, Onland-Moret NC, Sharp SJ, Ong KK, Khaw KT, et al. Age at menopause, reproductive life span, and type 2 diabetes risk: results from the EPIC-InterAct study. Diabetes Care. 2013 Apr 1;36(4):1012-9.
99. Kanter R, Caballero B. Global gender disparities in obesity: a review. Advances in Nutrition. 2012 Jul;3(4):491-8.