Abstract
Aim: The aim of the current study is to determine the allelic, phenotypic, and genotypic frequencies of the ABO and Rh (D) blood type distributions among Injibara University students.
Method and Materials: Blood samples from 800 volunteer students were taken on 1st January 2024. A cross-sectional study design was performed. ABO and Rh (D) typing was done by antigen-antibody agglutination test using commercially available and standard anti-sera. Descriptive statistical measures on phenotypic frequency of ABO and Rh (D) blood types were described in simple percentages using SPSS version 26. The allelic and genotypic frequencies of the ABO and Rh blood groups were estimated using the assumption of Hardy-Weinberg equilibrium.
Results: The ABO and Rh (D) blood phenotypes, respectively, were found to be O (37.5%) > A (32.5%) > B (23.8%) > AB (6.3%) and Rh+ (96.6%) > Rh- (3.4%) and the combined ABO and Rh(D) blood groups were in the order O+ (36.4%) > A+ (31.5%) > B+ (22.9%) > AB+ (5.8%) and O- (1.1%) >A- (1.0%) > B- (0.9%) > AB- (0.5%). The allelic frequencies of the ABO blood group of r (IO), p (IA), and q (IB) were 0.612, 0.22, and 0.16, respectively (IO > IA > IB). The allelic frequencies for ID = 0.816 and for Id = 0.184 were found. The genotypic frequency of IOIO was the most frequent (0.38) while that of IBIB was the least frequent (0.07). Whereas, IDID was most frequent (0.67) and dd was the least frequent (0.034). The observed and expected frequencies of individuals having ABO blood group showed no significant difference (x2 = 1.566, df = 3; P < 0.05), and Rh (D) blood phenotypes of individuals were not significantly different (x2 = 0.0225, df = 1; P < 0.05), which fits Hardy-Weinberg assumptions.
Conclusion: The results of the survey showed that the O blood group was the most common, followed by A and B. The blood groups with the largest percentages in this study are O Rh+ (36.4%) and A Rh+ (31.5%), whereas the groups with the lowest ratios are AB Rh- (0.5%) and B Rh- (0.9%). The result and data obtained in the present study might be used as input for other scholars on safe blood transfusion practices in different regions of Ethiopia in the future.
Keywords
ABO blood, Expected frequency, Observed frequency, Rh factor
Introduction
Blood is the body's main fluid, transporting nutrition, oxygen, and hormones throughout the entire structure [1]. Rh antigen and blood types are inherited. The first chromosome contains the Rh antigen gene, while the ninth chromosome has the ABO antigen gene [2]. Landsteiner's 1901 discovery of the ABO blood group led to the identification of the Rh blood group in 1941. Although there are currently more than 30 blood groups listed by the International Society of Blood Transfusion, only the ABO and Rh blood groups are still thought to be the most clinically significant [3]. The ABO blood group system is determined by a single gene on chromosome 9 that has three alleles (IA, IB, and IO). Under diploid intra-allelic interaction, the co-dominant IA and IB alleles outweigh the recessive allele IO [4]. The ABO blood group is more significant in the biology of blood transfusions than the Rh blood type (Rhesus). The presence or lack of the Rh (D) antigen on the red blood cell is the most clinically relevant polymorphism, despite the fact that it is highly polymorphic due to its presence of over 44 distinct antigens [5]. Blood group typing is based on the antigenic properties of red blood cells (RBCs). The surface of red blood cells contains around thirty different types of blood group antigens. There is global variance in the distribution of ABO and Rh blood groups among different racial groups [6]. The A and B antigens are important complex oligosaccharide antigens. Antibodies against these A and B antigens are produced in the blood plasma throughout an individual's lifespan [7]. In transfusion and transplant medicine, the ABO blood group system is the most pertinent therapeutically [8]. ABO and RhD blood types are the most significant in transfusion medicine. Understanding how different blood groups are distributed among blood donors and how frequently they occur is crucial for the safe and effective provision of transfusion services. Mismatched blood can result in serious adverse reactions, such as hemolytic reactions, which can kill red blood cells and even cause death [9]. The ABO blood group is the most significant blood component in clinical settings involving blood transfusions. Because of recent developments in gene sequencing technology, the ABO blood type is significant for reasons beyond medicine; it can be used to determine the patterns and origins of human migration [10]. The distribution of blood types among various racial and ethnic groupings varies throughout the world. It may vary among populations and regions even within a single country. The world's population is split up into many different ethnic groups. It is notable how different these groups are from one another based solely on inherited feature [11].
The distribution of blood types that are ABO varies. The distribution of Caucasians in the United States is as follows: Type O accounts for 47%, type A for 41%, type B for 9%, and type AB for 3%. Among African Americans, 46% are type O, 27% are type A, 20% are type B, and 7% are type AB. Of the people in Western Europe, 42% are in group A, 9% are in group B, 3% are in group AB, and 46% are in group O. 7,653 individuals with blood groups O, A, B, and AB were also discovered in Ogbomoso, Oyo State, Nigeria; 50% with O, 22.9% with A, 21.3% with B, and 5.9% of the population with AB, respectively [12]. A Research by Tadesse found that the distribution of ABO blood groups in northwest Ethiopia was O (46%), A (27.1%), B (23.1%), and AB (3.8%). Comparable research was found out in West Gojam, Ethiopia, and showed that the frequency distributions of blood groups O, A, and B were, respectively, 60%, 26%, and 14%. Previous data shows that Rh+ blood group distribution is substantially higher in Africa than Rh negative blood group distribution [13].
Materials and Methods
Description of the study area
The study was conducted at Injibara University, which is located in Awi Zone, Injibara Town, and west-northern Amara Regional State, Ethiopia. The Awi Zone's administrative is Injibara Town, which is located in Ethiopia's Amara Region. It is situated at 2,560 meters above sea level, at 10°57′N, 36°56′E.
Research design
On January 1, 2024, a cross-sectional descriptive survey was conducted at Injibara University.
Study population and sampling techniques
Twenty percent of willing participants were chosen at random from the campus's overall students to participate in the study with various ethnic groups. Eight hundred (800) students, ages 18 to 25, were randomly chosen to be the research populations (402 males and 398 females). 800 willing students were recruited to donate blood, and they were split up into two administrative cities (Addis Ababa (AA) and Dire Dawa) and nine regional states (Afar, Amhara, Benishangul Gumuz, Gambela, Oromia, Sidama, Somalia, South Western Ethiopia, and South Central Ethiopia). Four colleges and two institutes from Injibara University were included in the study: the College of Agriculture, the College of Natural and Computational Sciences, the College of Technology, the College of Medicine and Health Sciences, the Institute of Agew Language, and the Institute of Law. Ethiopian students who are at least eighteen years old and who are willing to engage in this study and the blood bank's protocols met the inclusion requirements.
Collection of blood samples
The goals and protocols of blood donation were explained to the students who took part. Blood was drawn in accordance with the blood bank's ABO and Rh-D guidelines. The standards and procedures followed in blood donation procedures were the basis for choosing the students. Selection of candidate donors was based on evaluations such as body weight (above 45 kg), hemoglobin levels (13.5 to 17.0 g/dl for men and 12.5 to 16 g/dl for women), and blood pressure (up to 160/90 mmHg). Additionally, consideration was given to each person's physical and mental well-being as well as their level of health and medical fitness. Donors who met these requirements were therefore added to the list and approved. Subsequently, the students were requested to complete registration forms that include socio-demographic information (race, sex, etc). All blood donations were made voluntarily at Injibara University camps [14].
Blood group determination
Following blood donation, laboratory technician and a researcher (a genetics teacher) performed antigen-antibody agglutination tests of the Rh and ABO blood types using commercially available, standard anti-sera (anti-A, anti-B, and anti-D). Blood groups were performed using distinct glass slides with blood droplets labeled A, B, and D that was combined using various sanitized applicator sticks. Agglutination during blood type detection was noted as a favorable response. Blood group A is associated with aggregates found in antisera drop A; blood group B is associated with aggregates found in antisera drop B; blood group AB is associated with aggregates found in both A and B antisera drops; and blood group O is associated with no aggregates found in either A or B antisera drop. Similarly, blood drop D's aggregates were represented as Rh+ and its absence of aggregates as Rh- [15].
Statistical analysis
The allelic, genotypic, and phenotypic frequencies of the blood ABO and Rh blood groups were determined using descriptive statistics. Using SPSS version 26, the findings were presented as frequencies and percentages. Based on the observed phenotypes of ABO and Rh and assuming Hardy-Weinberg equilibrium, the genotypic and allelic frequencies of the ABO and Rh blood groups were computed. The three alleles of ABO blood groups, i.e., IA, IB, and IO, and their frequencies were represented by p, q, and r, respectively. The frequencies were calculated as follows:
r = √O = Allele IO
p = 1 - √B + O = Allele IA
q = 1 - √A + O = Allele IB
Therefore, the genotypic frequencies are represented as:
(p + q + r) 2 = p2 + 2pq + q2 + 2pr + 2qr + r2 = 1 and p + q + r = 1
Where p2 is the genotypic frequency of IAIA, q2 is the genotypic frequency of IBIB, 2pq is the genotypic frequency of IAIB, 2pr is the genotypic frequency of IAIO, 2qr is the genotypic frequency of IBIO, and r2 is the genotypic frequency of IOIO [4]. χ2 was used in tests to compare proportions of A, B, AB, and O blood groups. The proportion of Rh+ (D) and Rh-(d) was calculated at 95% CI. According to the ABO phenotypes (A, B, AB, and O) and Rh+(D) phenotypes and Rh-(d), the participants blood groups were divided into eight, namely: A+, A-, B+, B-, AB+, AB-, O+, and O- [16].
The frequencies of the Rh blood group alleles D (dominant allele) and d (recessive allele) were determined as:
q = √Rh- = Allele d and P = 1 – q = Allele D
The Rh blood (D) group genotypic frequency was calculated from the allelic frequency under the assumption of Hardy-Weinberg equilibrium as follows:
DD + 2Dd + dd = 1 Genotype DD = p2 Genotype Dd = 2pq [1].
The X2 (O-E)2E where, E = Expected frequency; O = Observed frequency.
Expected phenotypic frequencies for each blood group were calculated following [14]. Blood group A = f (AA + AO) × 429, (2) blood group B = f (BB + BO) × 429, (3) blood group AB = f (AB) × 429, (4) blood group O = f (OO) × 429, (5) blood group Rh+ = f (DD + Dd) × 429 and (6) blood group Rh- = f (dd) × 429. Where, “f” is frequency
Result
Phenotypic frequency distribution of ABO blood groups
The distribution pattern of A, B, AB, and O blood group frequencies among the 800 students under study was shown in Figure 1 as follows: 260 (32.5%), 190 (23.8%), 50 (6.3%), and 300 (37.5%), respectively. According to the results, blood group O was the most frequently occurring blood group among the students under study, followed by A and then B. Blood group AB was the least commonly occurring blood group. The students ABO blood group distribution pattern was O > A > B > AB.
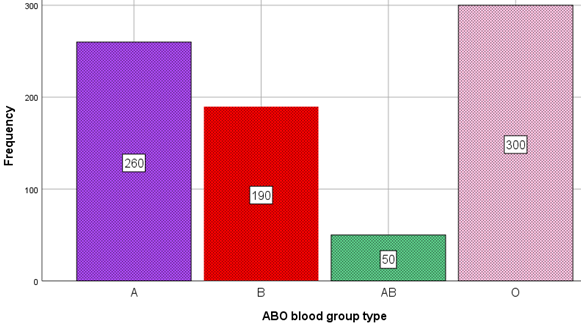
Figure 1. Distribution of ABO blood groups among Injibara University students (n = 800).
Distribution of Rh (D) blood groups
Figure 2 shows that 96.6% of students were Rh positive and 3.4% of students were Rh negative, were Rh negative for both sexes. Among the examined participants of both sexes, the percentage of Rh+ persons were greater than that of Rh- individuals.

Figure 2. Distribution of Rh blood group system among Injibara University students (n = 800).
Allelic, genotypic and phenotypic frequencies of ABO and Rh (D) blood groups
The Rh blood group of D and d had allelic frequencies of 0.816 and 0.184, respectively, whereas the ABO blood groups of r (IO), p (IA), and q (IB) had allelic frequencies of 0.612, 0.22, and 0.16, respectively (IO > IA > IB). According to Table 1, IOIO had the highest genotypic frequency (0.38) and IBIB had the lowest (0.07).
|
Ethnic groups |
Frequency |
Percent |
Valid Percent |
Cumulative Percent |
|
Oromo |
120 |
15.0 |
15.0 |
15.0 |
|
Amara |
135 |
16.9 |
16.9 |
31.9 |
|
Agew |
80 |
10.0 |
10.0 |
41.9 |
|
Afar |
55 |
6.9 |
6.9 |
48.8 |
|
Gamo |
74 |
9.3 |
9.3 |
58.0 |
|
Kafa |
57 |
7.1 |
7.1 |
65.1 |
|
Harari |
59 |
7.4 |
7.4 |
72.5 |
|
Sidama |
71 |
8.9 |
8.9 |
81.4 |
|
Shinasha |
48 |
6.0 |
6.0 |
87.4 |
|
Somali |
45 |
5.6 |
5.6 |
93.0 |
|
Wolaita |
56 |
7.0 |
7.0 |
100.0 |
|
Total |
800 |
100.0 |
100.0 |
|
|
Phenotype |
O |
A |
A |
AB |
B |
B |
Rh+ |
Rh+ |
Rh- |
|
Frequency |
0.375 |
0.325 |
0.325 |
0.063 |
0.238 |
0.238 |
0.966 |
0.966 |
0.034 |
|
Allele |
O(r) |
A(p) |
A(p) |
- |
B(q) |
B(q) |
D |
D |
d |
|
Frequency |
0.612 |
0.22 |
0.22 |
- |
0.16 |
0.16 |
0.816 |
0.816 |
0.184 |
|
Genotype |
iOiO |
IAIA |
IAiO |
IAIB |
IBIB |
IBiO |
DD |
Dd |
dd |
|
Frequency |
0.38 |
0.0484 |
0.27 |
0.07 |
0.026 |
0.196 |
0.67 |
0.3003 |
0.034 |
Observed and expected frequencies of ABO blood group
The comparison of the actual and predicted frequencies of the ABO blood group is shown in Table 3. There was no significant difference found between the observed and expected frequencies of students with Rh and ABO blood in both blood systems (goodness-of-fit x2 for ABO = 1.566, df = 3; P<0.05). Table 3 shows that there was no significant difference between the expected and observed frequencies in ABO blood groups. For the three degrees of freedom, the critical chi-square (0.05) is 7.815. Hence, the null hypothesis is agreed upon. The population's proportions were Hardy-Weinberg, with a χ2 for ABO of 1.566, below the crucial value of df = 3; P < 0.05).
|
ABO blood group |
Observed Number(o) |
Expected number(e) |
Difference(d) |
d2/e |
|
A |
260 |
256 |
4 |
0.063 |
|
AB |
50 |
56 |
-6 |
0.64 |
|
B |
190 |
178 |
12 |
0.81 |
|
O |
300 |
304 |
-4 |
0.053 |
|
X2 1.566 |
||||
Observed and expected frequencies of Rh factor
ABO blood group comparisons between observed and expected frequencies are shown in Table 4. In both blood systems, there was not a significant difference between the observed and expected frequencies of students with Rh blood (goodness-of-fit x2 for Rh = 0.0225, df = 1; P < 0.05). Similarly, Table 3 shows that there was no significant difference between the expected and observed rates of students with Rh (D) blood phenotypes. The critical chi-square (0.05, one degree of freedom) is equal to 3.841 in this case. As a result, the null hypothesis, which claims that the population fits the Hardy-Weinberg assumptions since its χ2 for Rh (D) = 0.0225 is less than the critical value (df = 1; P<0.05), was not rejected. This research aligns with the findings of [4] between those with both ABO and Rh blood classes, there is no discernible difference between the observed and predicted rates (χ2 test for ABO = 0.4729, df = 3, and χ2 test for Rh = 0.0145, df = 1; P<0.05).
|
Rh groups |
Observed number(o) |
Expected number(e) |
Difference(d) |
d2/e |
|
Rh+ |
773 |
777 |
4 |
0.021 |
|
Rh- |
27 |
27.2 |
0.2 |
0.0015 |
|
X2 0.0225 |
||||
Discussion
The findings of this study on the frequency distribution of the ABO blood group phenotype were consistent with the trend observed in earlier research conducted in 2021 at the Gambella Regional State Health and Education College in Ethiopia. Regarding the ABO blood phenotypic, blood group O was the most common (47.8%) in the study's sampled population distribution, followed by type A (25.5%) and B (20.9%). The least common blood type in the subjects of the study was AB (5.8%) [1]. O > A > B > AB represents the population distribution according to ABO blood phenotype. The current pattern is comparable to that of the Caucasians in Uyo and the United States; in Nigeria, type A accounts for 41% of the distribution, type B for 9%, type O for 46%, and type AB for 4% [2]. Additionally, records from Uyo, Nigeria revealed that blood group O was the most prevalent there, accounting for 56.10%; blood group A, 25.07%; blood group B, 16.4%; and blood type AB, 2.45%. Black Americans, on the other hand, were distributed as follows: type O, 46%; type A, 27%; type B, 2%; and AB, 7%. This outcome of the research that had been carried out by Kooffreh et al. [17], Blood group O was found to have the highest frequency (55.2%) in Calabar, Nigeria, followed by B (21.6%), A (18.8%), and AB (4.4%). Boskabady et al. [18] revealed that the population of Mashhad was made up of 23.1%, 23.3%, 8.9%, and 34.7% people with blood types A, B, AB, and O, respectively. O was the most prevalent blood type and AB was the least common, according to all research studies based on Ethiopian groupings. The frequencies for ABO blood group genes were found to be in the following order in this study: i > IA > IB and IAB. Previous research has established this as a frequent trait of the Ethiopian population. Our results are consistent with a research from Butajira, south Ethiopia, which revealed a high allelic frequency of the O blood group. Blood group analysis also revealed similarities with our results in a cohort of Ethiopian students from a variety of ethnic backgrounds. According to a number of studies, the O blood type is most prevalent in Africa and is widespread around the world in areas where malaria is endemic [19].
Research conducted by several researchers across various nations and ethnic groups revealed that Rh-blood is less common or uncommon in Asian and African nations, nonetheless, in Gambela, southwest Ethiopia, a comparatively greater prevalence of Rh-(19.37%) was recorded. The current study's total Rh+ frequency is similar to that of Egypt [20] whereas lower compared to Cameroon [21], and Nigeria [5]. The proportion of Rh+ in Addis Ababa is similar to white non-Hispanic in USA [22] but large relative to Gambela [23]. The proportion of Rh- ranged from 7-14%, which is wider relative to studies done in Ethiopia [4,24]. Such a large range in the proportion of Rh- in this study could reflect wider regional coverage. The participants were almost from all the regions of the country. In Rhesus system, the study showed the frequency of Rh positive was 96.6%, while only 3.4% was Rh negative. These figures were similar to the other studies carried out in different part of India [25]. Rh-positive groups were predominant group and the frequency is more or less the same.
The results of the study show that the distribution of Rh differs within every given student group. Based on the results of this study, the blood group O that tested positive for hepatitis C has the largest percentage frequency (291, or 36.4%), followed by blood group A (252, or 31.5%), blood group B (183, or 22.9%), and blood group AB (AB 46, or 5.8%). Overall, 96.6% of the population tested positive with Rh, whereas 3.4% tested negative for the virus. In total, 3.4% of people tested negative for the Rh, whereas 96.6% of people tested positive for Rh. Since Rh blood incompatibility can lead to clinical issues, students have been taught the Rh blood group systems over time in an effort to keep the frequency of Rh negative very low. A comparable distribution trend has also been noted in another research. Rh negative blood group is documented as 5.5% in South India, 5% in Nairobi, 4.5% in Nigeria, 7.3% in Lahore, 7.7% in Ralwalpindi studies [12].
A similar study done by Akwanjoh et al. [26] for the Rh blood group system, allelic frequencies were (D = 0.795) and (d = 0.205). The genotypic frequencies were DD= 0.632, Dd = 0.3259 and dd = 0.0418 while the phenotypic frequencies were Rh + (D) = 0.9579 and Rh- = 0.0418. The current study is in line with the study done by Saleh et al. [10] for the Rh blood group, the genotypic frequencies were DD = 0.4356, Dd = 0.4488 and dd = 0.1156 while the phenotype frequencies were Rh (D)+ = (88.56% and Rh-(d) = 11.44%. There were a higher proportion of Rh+ (D) individuals than the Rh- in the studied population.
Our results are in line with earlier discoveries made in other regions of the world when compared to data from investigations conducted elsewhere. There are notable differences in the frequency of the Rh-negative trait throughout populations. The Rh-negative phenotype is less prevalent in Asia and Africa. According to studies, only 1% of people in Madagascar and 6% of people in Nigeria are Rh-negative. 0.6–8.4% of people in different parts of India were found to be Rh negative. In South East Asia and Far East the D-negative phenotype is even rarer. In China, Indonesia, and Japan it is less than 1% [23]. With a frequency of 91.6, the Rh (D) positive was more common than the Rh (D) negative, which was 8.4%. The frequency was comparable to the Rh (D) positive and Rh (D) negative reports of Jaff (2010) in Pakistan and Rajshree and Raj (2013) in Western Rajasthan, India, which were 91.73 and 8.27%, respectively [17].
The current study's findings demonstrated that, in comparison to expected frequencies, there is no discernible difference between the observed and expected phenotypic frequencies for the ABO blood type system. In the current study, the ABO blood group system's observed phenotypic frequencies were 0.325 for the A phenotype, 0.063 for the AB phenotype, 0.238 for the B phenotype, and 0.375 for the O phenotype. The results are consistent with earlier research carried out in several regions of Ethiopia [27]. The O blood group, which is thought to be the most common blood group globally, is congruent with the higher frequency of the O phenotype.
Conclusion
Because it is useful to create a Blood Donor Database, knowing the Red Cell ABO & Rh (D) Antigen phenotypic frequencies in a specific population in terms of their ethnic distribution. The current study has provided extremely relevant information. Understanding of the Rh (D) and ABO blood type distribution patterns among Ethiopian volunteer blood donors is improved by this study. The results of the study showed that the O blood group was the most common, followed by A and B. The blood groups with the largest percentages in this study are O Rh+ (36.4%) and A Rh+ (31.5%), whereas the groups with the lowest ratios are AB Rh- (0.5%) and B Rh- (0.9%). The observed allele frequencies in the ABO blood type system did not considerably deviate from the expected rates, and there was no significant difference between the actual and expected allele frequencies in the Rh (D) system. O Rh+ and A Rh+ blood groups are the most widely distributed, making them the most convenient to get for blood transfusions during blood donation and reception. Given that blood transfusion programs are essential to understanding the genetic profile of the Ethiopian population, geneticists and physicians would find this information particularly helpful when organizing such programs. The results of this study will also contribute to a better understanding of Ethiopia's ABO and Rh (D) blood type distribution and phenotypic frequency. This study has the potential to yield priceless insights into this important area of medicine. The results of this study may also help blood center administrators prepare for the proper stocking and supply of blood.
Data Availability
The corresponding author has access to the study's data, if needed by the editor it might be shared.
Ethics Approval and Consent to Participate
Since this university in Ethiopia is very newly established, the researcher just needs a formal communication for all proposed titles from the University management to begin work, unless there was no ethical reviewing boards present on campus.
Since no names, photos, or videos pertaining to specific participants were included in this study, neither ethical approval nor agreement to participate is relevant.
Funding Declaration
The study was financially supported by Injibara University to conduct a research for material purchase (antisera’s and blood kits).
Consent
The research participants provided their informed consent.
Conflict of Interests
According to the author, no one else's interests are in conflict with hers. The author is the only one who does the research, even while some people provide acknowledgeable support.
Authors’ Contributions
Alemu Tsega carried out the experiment, planned the project, executed it, evaluated the results, and authored the entire paper.
Acknowledgments
The author expresses gratitude to Injibara University that for providing the laboratory room, blood slides, and antisera (A, D, and B). Similarly, the author thanks the laboratory technician for his assistance by arranging the setup of laboratory and all needed for blood collection. The vice president of Injibara University's research and community service providing Amharic letter of authorization to conduct research is appreciated. The study participants are also appreciated by the author for their consent to engage in the research.
References
2. Giri PA, Yadav S, Parhar GS, Phalke DB. Frequency of ABO and rhesus blood groups: a study from a rural tertiary care teaching hospital in India. Int J Biol Med Res. 2011;2(4):988-90.
3. Alemu G, Mama M. Assessing ABO/Rh Blood Group Frequency and Association with Asymptomatic Malaria among Blood Donors Attending Arba Minch Blood Bank, South Ethiopia. Malar Res Treat. 2016;2016:8043768.
4. Fufa AW, Debelo DG. Distribution of ABO and Rh (D) blood groups among students attending secondary and preparatory schools in Bote town, Oromia national regional state, Ethiopia. International Journal of Science and Technology Education Research. 2019 Mar 31;10(1):1-8.
5. Anifowoshe AT, Owolodun OA, Akinseye KM, Iyiola OA, Oyeyemi BF. Gene frequencies of ABO and Rh blood groups in Nigeria: A review. Egyptian Journal of Medical Human Genetics. 2017;18(3):205-10.
6. Sabir A, Iftikhar A, Ijaz MU, Hussain G, Rasul A, Iqbal RK, et al. Retrospective study of frequency of ABO and Rhesus blood group among population of Safdarabad and Faisalabad cities of Pakistan. BMC Res Notes. 2021 Jan 7;14(1):12.
7. Sarhan MA, Saleh KA, Bin-Dajem SM. Distribution of ABO blood groups and rhesus factor in Southwest Saudi Arabia. Saudi Med J. 2009 Jan;30(1):116-9.
8. Lang K, Wagner I, Schöne B, Schöfl G, Birkner K, Hofmann JA, et al. ABO allele-level frequency estimation based on population-scale genotyping by next generation sequencing. BMC Genomics. 2016 May 20;17:374.
9. Lendabo F, Srinivasan V, Rather RA. Prevalence of ABO and Rhesus (D) Blood Group and Allelic Frequency at Blood Bank of Nigist Eleni Mohammed Hospital, Ethiopia. Biomed Res Int. 2024 Apr 8;2024:5353528.
10. Saleh SM, Abood AS. ABO and Rh (D) blood groups’ distribution and gene frequencies in North Baghdad population–Iraq. Int J Sci Eng Res. 2016 Aug;7:2-4.
11. Rehman GU, Shi H. ABO and Rh (D) blood groups distribution in Pakistan: a systematic review. Forensic Res Criminol Int J. 2020;8(6):237-44.
12. Adeyemo OA, Soboyejo OB. Frequency distribution 0f ABO, RH blood groups and blood genotypes among the cell biology and genetics students of University of Lagos, Nigeria. African Journal of Biotechnology. 2006;5(22).
13. Alemu G, Mama M. Assessing ABO/Rh Blood Group Frequency and Association with Asymptomatic Malaria among Blood Donors Attending Arba Minch Blood Bank, South Ethiopia. Malar Res Treat. 2016;2016:8043768.
14. Abegaz SB. ABO and Rh (D) blood group distribution among blood donors: a study of natural and computational science faculty graduating class students at Woldia University, Ethiopia. International Journal of Genetics and Molecular Biology. 2021 Jan 31;13(1):21-30.
15. Negash W. ABO and RH blood group type frequencies among students from different ethnic groups at Enchini Secondary School, West Shewa, Oromia Region, Ethiopia. Ethiopian Journal of Natural and Computational Sciences. 2021 Feb 1;1(1):1-2.
16. Liu J, Zhang S, Wang Q, Shen H, Zhang Y, Liu M. Frequencies and ethnic distribution of ABO and RhD blood groups in China: a population-based cross-sectional study. BMJ Open. 2017 Dec 3;7(12):e018476.
17. Kooffreh ME, Ikpeme EV, Ekerette EE, Eyo NO. Evaluating the Prevalence of Five Genetic Traits of Simple Inheritance in Association with the Distribution Pattern of ABO and Rhesus Phenotypes among Families in Calabar, Nigeria. Journal of Medical Sciences. 2015 May 20;15(4):185.
18. Boskabady MH, Shademan A, Ghamami G, Mazloom R. Distribution of blood groups among population in the city of Machhad [North East of Iran]. Pakistan Journal of Medical Sciences. 2005:194-8.
19. Mandafro A, Kelel M. Distribution of ABO and Rh (D) allele frequency among the populations of Yilmana Denssa and Mecha, Ethiopia. International Journal. 2016 Apr;2(4):81.
20. Abdelmonem M, Fyala A, Boraik A, Shedid M, Mohamed AH, Abdel-Rhman M. Distribution of blood types and ABO gene frequencies in Egypt. American Journal of Clinical Pathology. 2019 Sep 11;152(Supplement_1):S153.
21. Ndoula ST, Noubiap JJ, Nansseu JR, Wonkam A. Phenotypic and allelic distribution of the ABO and Rhesus (D) blood groups in the Cameroonian population. Int J Immunogenet. 2014 Jun;41(3):206-10.
22. Garratty G, Glynn SA, McEntire R; Retrovirus Epidemiology Donor Study. ABO and Rh(D) phenotype frequencies of different racial/ethnic groups in the United States. Transfusion. 2004 May;44(5):703-6.
23. Golassa L, Tsegaye A, Erko B, Mamo H. High rhesus (Rh(D)) negative frequency and ethnic-group based ABO blood group distribution in Ethiopia. BMC Res Notes. 2017 Jul 26;10(1):330.
24. Tesfaye K, Petros Y, Andargie M. Frequency distribution of ABO and Rh (D) blood group alleles in Silte Zone, Ethiopia. Egyptian Journal of Medical Human Genetics. 2015 Feb 3;16(1):71-6.
25. WARGHAT N, SHARMA N, BAIG M, Yadav A, Sharma S, Pachalore G. ABO and Rh blood group distribution among Kunbis (Maratha) population of Amravati District, Maharashtra. Nature Precedings. 2010 Sep 9:1-5.
26. Akwanjoh SR. Allelic frequency of ABO and Rh-D blood groups among the mbororo ethnic group of momo division in the north west region of Cameroon. International Journal of Biosciences. 2014;5(8):188-93.
27. Woldu B, Melku M, Shiferaw E, Biadgo B, Abebe M, Gelaw Y. Phenotype, Allele and Genotype Frequency of ABO and Rhesus D Blood Groups of Blood Donors at the North Gondar District Blood Bank, Northwest Ethiopia. J Blood Med. 2022 Jan 6;13:11-19.