Abstract
Salt (sodium chloride) and A2A adenosine receptors (A2AR) have both been implicated in blood pressure regulation. While high salt consumption raises blood pressure, A2AR is a key mediator of coronary vasodilation. Although a sodium ion binding pocket has been identified in A2AR, the physiological link between salt and A2AR remains poorly investigated. Hereby, we explored how salt modulates its expression and function in vitro.
Using Adonis, an IgM mouse monoclonal antibody against A2AR with agonist properties, or CGS21680, an organic agonist, we evaluated the effects of distinct sodium chloride concentrations (low = 120 mM and high = 194 mM, compared to control = 133 mM) on A2AR protein expression, ligand binding affinity (KD) and function (cAMP production and EC50). We used peripheral blood mononuclear cells, a cellular model mimicking the behavior of A2AR expressed in the cardiovascular system.
After 24h salt supplementation in culture medium, high salt concentration is associated with A2AR increased expression (mean ± SD: +131% ± 25.63 compared with control, p<0.05). Upon Adonis activation, KD and EC50 values inversely correlated to salt concentration: the higher salt concentration, the lower KD and EC50 are. High salt concentration is also associated with higher cAMP production upon CGS21680 activation (mean +42%). None of these changes was observed when salt and Adonis were simultaneously added (competition condition).
These results demonstrate that salt promotes A2AR increased expression, binding to Adonis as well as activation. We hypothesize that Adonis binding, potentially due to its large size or to induced conformational changes, allosterically prevents sodium ion from accessing or modulating its binding pocket. This is supported by our competition experiments where simultaneous addition abrogates the salt effect. Our results imply the presence of a novel beneficial compensatory mechanism, via A2AR, that responds to elevated blood salt levels and influences blood pressure regulation.
Keywords
Adenosine A2A receptors, Salt, Sodium ion, Blood pressure
Abbreviations
A2AR: A2A Adenosine Receptors; GPCRs: G Protein-Coupled Receptors; NaCl: Sodium Chloride; PBMCs: Peripheral Blood Mononuclear Cells; cAMP: Cyclic Adenosine Monophosphate; KD: Dissociation Constant; EC50: Half Maximal Effective Concentration; A.U.: Arbitrary Units; SD: Standard Deviation
Introduction
A2A adenosine receptors (A2AR) belong to the superfamily of G protein-coupled receptors (GPCRs), whose activation strongly impacts immune [1], nervous [2] and cardiovascular system [3]. In the cardiovascular area, A2AR stimulation leads to cardiac inotropic effects and vasodilation via cAMP production in target cells, mostly myocytes and endothelial cells in the vascular walls [3], cAMP production and vasodilation being correlated [4]. A2AR are strongly implicated in blood pressure modulation: high A2AR expression is associated with a drop-in blood pressure [5,6]; conversely, A2AR knockout mice exhibit high systolic blood pressure [7].
Adenosine, a ubiquitous nucleoside mostly derived from ATP dephosphorylation, is the natural ligand of A2AR. While high and low adenosine affinities for A2AR have been described [8], it is also established that ligands affinity for A2AR could be regulated in an allosteric manner through small molecules like amiloride or salt (sodium chloride, NaCl) [9–11]. Sodium ions rather than chloride ions are responsible for this allosteric modulation [9,11]. A sodium ion binding pocket has been described in A2AR, which is important for regulation of radioligand affinity [10,11]. Interestingly A2AR activation leads to vasodilation and a decrease in blood pressure, while conversely salt excess in blood leads to an increase in blood pressure notably by increasing vascular volume through osmosis mechanism [12–14]. While these effects of salt on one hand and the effects of A2AR activation on the other can be independent, it could be that sodium, apart from its effects on vascular volume, directly impacts A2AR expression and function by binding to an allosteric site.
We have developed an IgM monoclonal antibody (named Adonis) against a linear epitope in the human A2AR second extracellular loop, which also exhibits agonist properties and allows simultaneously measuring affinity (KD) and function (cAMP production and EC50) [15]. Adonis binds to the orthosteric site with a high affinity (KD around 0.1-0.2 µM) leading to cAMP production in a dose dependent manner. A2AR protein expression is high in peripheral blood mononuclear cells (PBMCs) and A2AR behavior in these cells reflects the behavior of A2AR expressed in the cardiovascular system [16–20]. Thus, PBMCs represent a good and less invasive model for studying adenosinergic implication in cardiovascular physiopathology.
In order to understand whether salt, and therefore sodium, acts directly on A2AR, in this study, by using Adonis and/or an organic agonist, we evaluated the influence of salt on A2AR expression and function in PBMCs.
Material and Methods
Cells culture and NaCl supplementation
PBMCs (Tebubio®, le Perray en Yvelines, France) were cultured in an incubator at 37°C (5% CO2) in a complete culture medium (RPMI 1640 with 10% heat inactivated Fetal Calf Serum, 100 IU /ml each penicillin/streptomycin and 4 mM glutamine) for 24h. Culture medium was supplemented either with 120 mM (low) or 194 mM (high) NaCl concentrations. 133 mM NaCl concentration, which is similar to human plasma sodium concentration, was defined as control concentration. Any significative difference in viable cells number or size (in μm) or in cell culture medium volume after 24h incubation was observed among the three conditions (data not shown).
For protein expression analysis, after 24h culture cells were centrifuged, and pellets were lysed and used for SDS-PAGE and western blotting analysis, as described below.
To calculate Adonis affinity (KD), cAMP production and EC50, we used an unconventional technique previously developed in our laboratory [21]. Briefly, after 24h culture, for each sodium chloride concentration, 5 x 10⁵ cells were incubated with Adonis, a homemade IgM κ mouse monoclonal antibody directed against a linear epitope on A2AR [15], for 90 min, at increasing concentrations: 0; 0.25; 0.05; 0.1; 0.2; 0.4 or 0.8 µM or with 0.1 µM CGS21680 10 min at 37°C.
For the competition experiments, after 24 h culture in a control (133 mM NaCl) medium, Adonis agonist was incubated alone (no competition) or simultaneously to 194 mM NaCl (competition) to PBMCs for 90 min.
After incubation with the agonists, cells were centrifuged and cells pellets were used to calculate KD or to measure cAMP production and calculate EC50, as described below.
SDS-PAGE and Western Blotting analysis
Cell pellets (2 × 10⁵ cells) were lysed with Laemmli sample buffer and submitted to a standard 12% polyacrylamide gel electrophoresis under reducing conditions followed by transfer onto a PVDF membrane. Membrane was then incubated with Adonis (1 μg/mL), used here as primary antibody, and staining was performed using alkaline phosphatase-labeled anti-mouse antibodies and BCIP /NBT purple liquid substrate (SIGMA® USA). The upper membrane part was incubated with an amido black solution (10% methanol, 10% acetic acid, 0.05% amido black powder) to visualize total protein amounts loaded in each gel lane. For protein expression analysis, the 45-kDa bands corresponding to A2AR were submitted to densitometry analysis using the ImageJ 1.42q software (National Institutes of Health), and values are expressed in arbitrary units (A.U.) as the ratio between pixels generated by A2AR band and pixels generated by the corresponding total proteins bands visualized after amido black staining [19,20]. Values are the mean ± standard deviation (SD) of 5 experiments, and results were expressed as percentage of the control values.
KD determination
KD (dissociation constant, which indicates how tightly a ligand binds to a receptor) was defined as ligand (Adonis) concentration (mM) at which 50% of A2AR binding sites were occupied [21–23]. The smaller the KD, the more tightly bound the ligand is and therefore the higher the affinity between the ligand and the receptor. Western blotting analysis was used to establish the binding curve of Adonis to A2AR on PBMCs and to determine KD value as previously described [19,24]. Briefly, samples were submitted to a standard 12% electrophoresis under reducing conditions prior to transfer onto a PVDF membrane. These conditions led to the dissociation of Adonis associated with A2AR at the PBMCs surface into its heavy and light chains with only the kappa light chain (25 kDa) being stained here using specific labeled antibodies and substrate. The staining intensity of the light chain was measured using densitometry analysis using the ImageJ 1.42q software (National Institutes of Health) and expressed in A.U. as the ratio between pixels generated by the light chain band and pixels generated by the background signal. KD values for Adonis binding were estimated using nonlinear regression analysis (Prism software; GraphPad Software), as Adonis concentration at which 50% of the Adonis light chain is released after dissociation. Values are the mean ± SD of 3 experiments.
Measurement of cAMP production and EC50
After PBMCs incubation with the agonists, as described above, cAMP production was measured using cAMP ELISA kit (Cell Biolabs). For EC50 (half maximal effective concentration) calculation, analysis was performed in duplicates and results were expressed as the percentage of the maximal cAMP production. EC50 was defined as the concentration of agonist (Adonis) that leads to half maximal stimulation of cAMP production [19,25].
For measurement of cAMP production by CGS21680 data are the means of three experiments and expressed as a percentage of cAMP production variation compared to control condition (133 mM NaCl, C).
Statistical analysis
One-way ANOVA analysis with Tukey's post-hoc test was used for multiple comparison of A2AR expression as well as cAMP production among different conditions. For the competition experiment, an unpaired t-test was used for comparison between "No competition" and "Competition" conditions. A p value <0.05*, <0.001** or <0.0001*** was considered as statistically significant.
Results
Increased A2AR expression in PBMCs cultured with high salt concentration
To understand whether and how salt concentrations modulate A2AR expression, we selected a physiological blood salt concentration, 133 mM NaCl (control condition), a low salt concentration (120 mM NaCl), which is a frequent severe hyponatremia, and an extreme hypernatremia (194 mM NaCl) [26]. PBMCs were cultured in 120 mM or 194 mM NaCl media for 24 h and A2AR protein expression was analyzed by SDS-PAGE and western blotting (Figure 1). Variations were expressed as a percentage of the values obtained in control condition. While low NaCl concentration (120 mM) in culture medium did not influence A2AR expression (mean ± SD: 110% ± 11.15 of the control values, p>0.05), high concentration (194 mM) was significantly associated with higher protein expression levels (mean ± SD: +131% ± 25.63 of control values, p<0.05*), which indicates a 31% augmentation.

Figure 1. Increased A2AR expression in PBMCs cultured with high salt concentration. PBMCs were cultured for 24h in 194 mM, 133 mM or 120 mM sodium chloride concentrations. A2AR protein (45kDa band) expression was analyzed by SDS-PAGE and western blotting (A), then quantified by Image J in arbitrary units (normalized on total proteins amount visualized by Amido black staining), and then expressed as percentage (%) of the A2AR expression values obtained in the control condition (133 mM). (B) Data are presented as mean ± SD (N = 5). One-way ANOVA analysis with Tukey's post-hoc test. A p value <0.05*, <0.001** or <0.0001*** was considered as statistically significant. n.s.: not significant, p>0.05 compared to control.
Ligand affinity for A2AR correlates to salt concentration
To understand whether salt concentration impacts A2AR proprieties, we measured the affinity (KD) of a homemade antibody Adonis in PBMCs exposed to 120 mM, 133 mM or 194 mM NaCl for 24 h [14,18] (Materials and methods) (Figure 2 and Table 1). KD is defined as Adonis concentration at which 50% of the A2AR binding sites were occupied and is hereby estimated as Adonis concentration at which 50% of Adonis light chains are released after dissociation. The lower the KD, the higher ligand affinity with A2AR is.

Figure 2. Effects of salt concentration on Adonis affinity (KD). PBMCs were exposed to three sodium concentrations (120 mM, 133 mM and 194 mM) for 24 h and KD was measured and quantified as described in Material and methods. (A) Data are expressed as a percentage of the total amount of Adonis light chain binding and presented as mean of triplicated experiments (see also Table 1). (B) Adonis light chain bound to PBMCs visualized by Western blot analysis. (C) KD values are presented as mean ± SD. One-way ANOVA analysis with Tukey's post-hoc test. A p value <0.05*, <0.001** or <0.0001*** was considered as statistically significant.
High concentration in salt (194 mM) is associated with low Adonis KD value (0.011±0.003 mM, mean -14.5 folds), compared with control conditions (0.16±0.04 mM), while low salt concentration (120 mM) was associated with a higher KD value (0.3±0.03 mM, mean + 1.9 folds) compared with control conditions. More generally, KD value inversely correlated to salt concentration, which means that the higher salt concentration, the higher ligand affinity with A2AR is (Figure 2 and Table 1).
|
|
Salt (194 mM) |
Salt (133 mM) |
Salt (120 mM) |
Salt (194 mM) Competition conditions |
|
KD (µM) |
0.011 ± 0.003 |
0.16 ± 0.04 |
0.3 ± 0.03 |
0.16 ± 0.02 |
|
EC50 (µM) |
0.08 ± 0.01 |
0.20 ± 0.01 |
0.38 ± 0.04 |
0.26 ± 0.11 |
|
Data are presented as mean of triplicated (KD) or duplicated (EC50) experiments ± SD. |
||||
Because Adonis is a large IgM [14] and might cover the allosteric sodium binding site, we decided to perform competition experiments between NaCl and Adonis. When Adonis and NaCl (194 mM) are simultaneously added to PBMCs, KD (0.16 ± 0.02 mM) was 14.5 higher than in no competition conditions (0.011 ± 0.003 mM, remaining approximatively like control condition value (Figure 3 and Table 1). Finally, regardless of salt concentration, no change was observed during competitive experiments between Adonis and CGS21680 compared to no competition conditions (results not shown).

Figure 3. Effects of competition between Adonis and high salt concentration on affinity (KD). PBMCs were incubated with Adonis in the absence (no competition, dark round) or presence (competition, white round) of 194 mM sodium chloride concentration. KD was measured and quantified as described in Material and methods. (A) Data are expressed as a percentage of the total amount of Adonis light chain binding and presented as mean of duplicated experiments (see also Table 1). (B) Adonis light chain bound to PBMCs visualized by Western blot analysis. (C) KD values are presented as mean ± SD. An unpaired t-test was used for comparison. A p value <0.05*, <0.001** or <0.0001*** was considered as statistically significant.
High salt concentration decreases Adonis EC50
To understand whether salt concentration impacts A2AR function, we measured Adonis cAMP production and EC50 in PBMCs exposed to 120 mM, 133 mM or 194 mM NaCl for 24h (Material and methods) (Figure 4 and Table 1). EC50 was defined as the concentration of agonist (Adonis) that leads to half maximal stimulation of cAMP production. The lower the EC50, the higher ligand capacity to activate A2AR is.
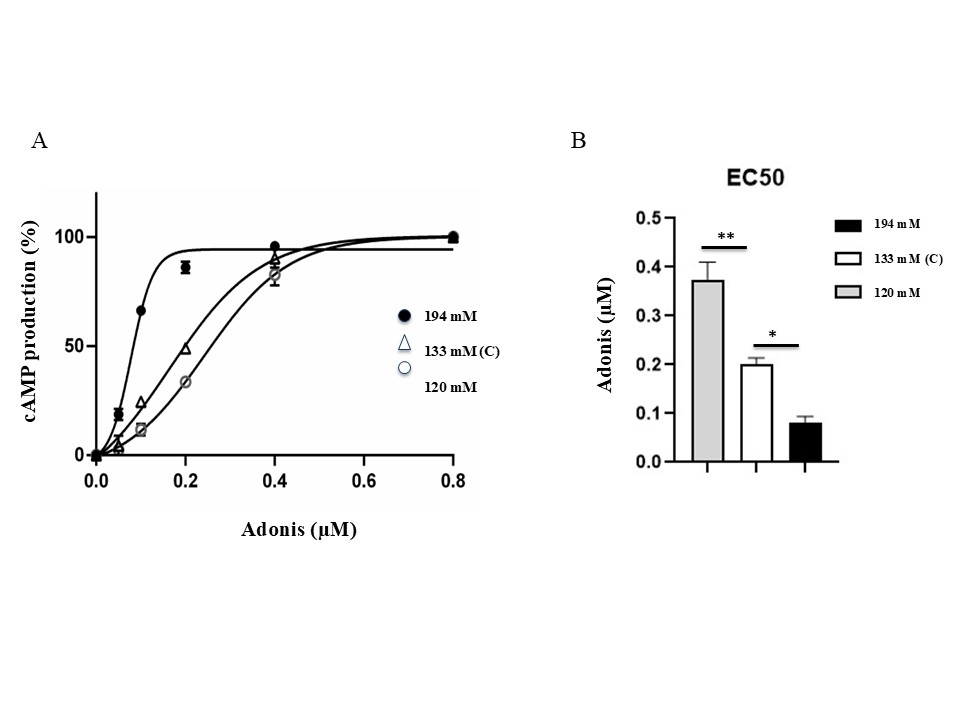
Figure 4. Effects of salt concentration on Adonis cAMP production and EC50. PBMCs were exposed to three concentrations (120 mM, 133 mM and 194 mM) for 24h and then incubated with Adonis. cAMP production was measured and quantified as described in Material and methods. (A) Data are presented as mean of duplicated experiments and expressed as a percentage of the total cAMP production (see also Table 1). (B) EC50 values are presented as mean ± SD. One-way ANOVA analysis with Tukey's post-hoc test. A p value <0.05*, <0.001** or <0.0001*** was considered as statistically significant.
High salt concentration (194 mM) is associated with low EC50 value (0.08±0.01 mM, mean -2.5 folds lower), compared with control conditions (0.20±0.01 mM), while low concentration (120 mM) was associated with a highest EC50 value (0.38±0.04 mM, mean + 1.8 folds higher) compared with control conditions. More generally, EC50 value inversely correlates to salt concentration, which means that the higher salt concentration, the higher ligand capacity to activate A2AR is. In competition conditions, EC50 was higher (0.26±0.11 mM, mean 3.25 folds higher) compared to conditions without competition and similar to the control values (133 mM) (Table 1).
In summary, in non-competitive conditions, salt concentration is associated with a decrease in KD and EC50 values in a dose-depending manner. When salt and Adonis were added simultaneously in culture medium (competitive condition), the presence of Adonis eliminates all the effects observed upon salt preincubation.
High salt concentration increases CGS21680 dependent cAMP production
Additionally, we measured cAMP production by CG21680 agonist in PBMCs exposed to 120 mM, 133 mM or 194 mM NaCl for 24 h by ELISA (Material and methods). While low salt (120 mM) concentration was not associated with significant change in cAMP production after CGS21680 incubation (83.7% ±13.9), compared with control conditions, high sodium concentration (194 mM) was associated with a higher cAMP production by CGS21680 (142.0% ± 15.6, mean + 42%) compared with 133 mM (Figure 5).

Figure 5. High sodium concentration (194 mM) was associated with a higher cAMP production by CGS21680. Effects of sodium chloride concentration on cAMP production in PBMCs incubated with CGS21680 (Material and methods). Data are the means of three experiments and expressed as a percentage of cAMP production variation compared to control condition (133 mM NaCl, C). One-way ANOVA analysis with Tukey's post-hoc test. A p value <0.05*, <0.001** or <0.0001*** was considered as statistically significant.
Discussion
main results of this study are that: 1) high salt concentration is associated with a higher protein expression of A2AR compared with control salt concentration and 2) salt decreases KD and EC50 values (evaluated with Adonis a monoclonal antibody with agonist properties) in a dose dependent manner. High salt concentration also increased cAMP production by the organic agonist CGS21680. These results indicate that salt promotes A2AR agonist binding and cAMP production.
It is now established that orthosteric binding pocket of a ligand represents just one among several sites for possible signal modulation in GPCRs and that allosteric binding pocket not only impacts ligand affinity but also plays a major role in receptor signaling [27–29]. Thus, molecules different from ligand can modulate binding of natural ligand to the orthosteric site. It was shown that small molecules like amiloride, ions or lipids can function as allosteric modulators of GPCR [9–11,27,29,30]. While chloride ion did not show any modulatory function [9], the allosteric effect of sodium ion has been previously described in A1R [31] and A2AR structural models [9–11,32]. Modeling of sodium binding to A2AR suggests that sodium ion stabilizes A2AR in its inactive conformation and destabilizes activation-related movements and agonist binding [32]. It is admitted that sodium ion induces an increase in radioligand antagonist binding but abrogates agonist binding in a dose dependent manner [9–11]. Nonetheless, these results were mainly obtained in structural and computational studies, where molecular simulations were combined with biophysical and biochemical experiments performed mainly by using membranes from HEK293T cells transfected with wild type or mutated A2AR. Additionally, salt concentrations used in these assays were rather much higher or lower than physiological levels [9–11,32]. Hereby, we have used a physiological cell culture model (not transfected PBMCs, expressing A2AR protein), incubated with salt concentrations reflecting physiological or pathological natremia. In contrast to those previous studies, we found that cells supplementation with high salt concentration is associated with an increased affinity (KD decrease) and a decrease in EC50 by agonists in a dose-dependent manner, which suggests that sodium ions promote A2AR activation. While we cannot completely exclude that the observed effects of NaCl concentration on A2AR might depend on osmotic variations, any significative difference in viable cells number or size (in µm) or in cell culture medium volume after 24h incubation was observed among the three salt conditions (data not shown). Therefore, currently, we are more confident on the direct allosteric effect of sodium on A2AR modulation.
In competition conditions, when Adonis and sodium ion are added simultaneously in culture medium, any change on KD and EC50 was observed compared to control (no competition) condition. We hypothesize that Adonis (a large IgM) binding to the receptor prevents sodium integration in its pocket, because it either induces A2AR conformational changes, as described for other GPCRs [33,34] or for its size it extends beyond the orthostatic site covering the allosteric sodium pocket on the second trans-membrane helix [15,35]. Adonis, for the same reasons, also prevents CGS21680 from being properly fixed on its site, which could explain the absence of additive effects on cAMP production when CGS and Adonis are both added to the culture medium (data not shown). Whether it is Adonis large size or its effect on A2AR conformation to perturb sodium binding needs further investigation. Moreover, although our antibody seems to behave like an organic agonist, particularly in terms of orthostatic binding site and cAMP production, the interactions between Adonis and A2AR receptor may be much more complex than with small organic molecules, such the natural ligand adenosine.
Pathophysiologic perspectives
The relationship between salt, blood pressure, and adenosinergic system has been studied in the context of renal physiology. It was shown that adenosine impacts glomerular filtration and, in this context, may act on blood pressure through diuresis modulation [36]. Infusion of adenosine into the renal artery also produces diuresis in rats [37] and promotes salt excretion [36].
In a more general perspective, it is well-established that excess salt increases blood pressure by a whole series of mechanisms. The first of these is the drawing of water into the vessels, resulting in hypervolemia. But salt also stimulates the sympathetic system, resulting in vasoconstriction [38]. Salt elevation in the cerebrospinal fluid also leads to activation of angiotensin II and ouabain-dependent sodium pump, leading to the increase in blood pressure [38,39]. Although excess salt has long been known to increase arterial tension [40], the relationship between salt and cardiovascular complications is not clear [41]. It is likely that there are also compensatory mechanisms for the rise in arterial pressure induced by excess salt. Increase of A2AR expression and function (via increase of affinity for adenosine) could be one of such beneficial compensatory mechanisms.
Conclusions
Our findings point to the potential role of A2AR/sodium ion direct interaction in blood pressure regulation and suggest the presence of a compensatory mechanism for the increase in arterial pressure induced by excess salt.
Conflicts of Interest
The authors declare that they have no conflicts of Interest.
Funding
This research was funded by Assistance Publique - Hôpitaux de Marseille (AP-HM) and Aix-Marseille Université (AMU), Institut national de la santé et de la recherche médicale (INSERM) and Institut national de recherche pour l’agriculture, l’alimentation et l’environnement (INRAE).
Acknowledgements
Not applicable.
Authors' Contributions
EOF and SA: Data acquisition, analysis, interpretation; GC, MM, BAP, KN, CC, CMC, LS: Data acquisition, interpretation; DJ, FJ and RJ: revision work; GR and MG: Conception, design, data analysis and interpretation, manuscript editing. All authors read and approved the final manuscript.
References
2. Dunwiddie TV, Masino SA. The role and regulation of adenosine in the central nervous system. Annu Rev Neurosci. 2001;24:31–55.
3. Burnstock G. Purinergic Signaling in the Cardiovascular System. Circ Res. 2017 Jan 6;120(1):207–28.
4. Cushing DJ, Brown GL, Sabouni MH, Mustafa SJ. Adenosine receptor-mediated coronary artery relaxation and cyclic nucleotide production. Am J Physiol. 1991 Aug;261(2 Pt 2):H343–8.
5. Gaubert M, Marlinge M, Kerbaul F, Resseguier N, Laine M, Cautella J, et al. Adenosine Plasma Level and A2A Receptor Expression in Patients With Cardiogenic Shock. Crit Care Med. 2018 Sep;46(9):e874–80.
6. Guieu R, Deharo JC, Ruf J, Mottola G, Kipson N, Bruzzese L, et al. Adenosine and Clinical Forms of Neurally-Mediated Syncope. J Am Coll Cardiol. 2015 Jul 14;66(2):204–5.
7. Ledent C, Vaugeois JM, Schiffmann SN, Pedrazzini T, El Yacoubi M, Vanderhaeghen JJ, et al. Aggressiveness, hypoalgesia and high blood pressure in mice lacking the adenosine A2a receptor. Nature. 1997 Aug 14;388(6643):674–8.
8. Shryock JC, Snowdy S, Baraldi PG, Cacciari B, Spalluto G, Monopoli A, et al. A2A-adenosine receptor reserve for coronary vasodilation. Circulation. 1998 Aug 18;98(7):711–8.
9. Gao ZG, Ijzerman AP. Allosteric modulation of A(2A) adenosine receptors by amiloride analogues and sodium ions. Biochem Pharmacol. 2000 Sep 1;60(5):669–76.
10. Gao ZG, Jiang Q, Jacobson KA, Ijzerman AP. Site-directed mutagenesis studies of human A(2A) adenosine receptors: involvement of glu(13) and his(278) in ligand binding and sodium modulation. Biochem Pharmacol. 2000 Sep 1;60(5):661–8.
11. Liu W, Chun E, Thompson AA, Chubukov P, Xu F, Katritch V, et al. Structural basis for allosteric regulation of GPCRs by sodium ions. Science. 2012 Jul 13;337(6091):232–6.
12. He FJ, Tan M, Ma Y, MacGregor GA. Salt Reduction to Prevent Hypertension and Cardiovascular Disease: JACC State-of-the-Art Review. J Am Coll Cardiol. 2020 Feb 18;75(6):632–47.
13. Rust P, Ekmekcioglu C. Impact of Salt Intake on the Pathogenesis and Treatment of Hypertension. Adv Exp Med Biol. 2017;956:61-84.
14. Sarahian S, Pouria MM, Ing TS, Sam R. Hypervolemic hypernatremia is the most common type of hypernatremia in the intensive care unit. Int Urol Nephrol. 2015 Nov;47(11):1817–21.
15. By Y, Durand-Gorde JM, Condo J, Lejeune PJ, Mallet B, Carayon P, et al. Production of an agonist-like monoclonal antibody to the human A2A receptor of adenosine for clinical use. Mol Immunol. 2009 Jan;46(3):400–5.
16. Gariboldi V, Vairo D, Guieu R, Marlingue M, Ravis E, Lagier D, et al. Expressions of adenosine A2A receptors in coronary arteries and peripheral blood mononuclear cells are correlated in coronary artery disease patients. Int J Cardiol. 2017 Mar 1;230:427–31.
17. Gaudry M, Marlinge M, Deharo P, Vairo D, Bottone S, Mottola G, et al. Pharmacological profile of adenosine A2A receptors in patients with lower extremity peripheral artery disease and associated coronary artery disease: A pilot study. Int J Cardiol. 2019 Jun 15;285:121–7.
18. Varani K, Laghi-Pasini F, Camurri A, Capecchi PL, Maccherini M, Diciolla F, et al. Changes of peripheral A2A adenosine receptors in chronic heart failure and cardiac transplantation. FASEB J. 2003 Feb;17(2):280–2.
19. Ruf J, Paganelli F, Bonello L, Kipson N, Mottola G, Fromonot J, et al. Spare Adenosine A2a Receptors Are Associated With Positive Exercise Stress Test In Coronary Artery Disease. Mol Med. 2016 Oct;22:530–36.
20. Chaptal MC, Maraninchi M, Musto G, Mancini J, Chtioui H, Dupont-Roussel J, et al. Low Density Lipoprotein Cholesterol Decreases the Expression of Adenosine A2A Receptor and Lipid Rafts-Protein Flotillin-1: Insights on Cardiovascular Risk of Hypercholesterolemia. Cells. 2024 Mar 11;13(6):488.
21. Ruf J, Paganelli F, Bonello L, Kipson N, Mottola G, Fromonot J, et al. Spare Adenosine A2a Receptors Are Associated With Positive Exercise Stress Test In Coronary Artery Disease. Mol Med. 2016 Oct;22:530–36.
22. Hulme EC. Receptor-Ligand interactions: A practical Approach. New York: Oxford University Press; 1992.
23. Lauffenburger DA, Linderman JJ. Receptors For Binding, Trafficking and Signaling. New York: Oxford University Press; 1998. pp. 365.
24. Ruf J, Vairo D, Paganelli F, Guieu R. Extracellular vesicles with ubiquitinated adenosine A2A receptor in plasma of patients with coronary artery disease. J Cell Mol Med. 2019 Oct;23(10):6805–11.
25. Paganelli F, Resseguier N, Marlinge M, Laine M, Malergue F, Kipson N, et al. Specific Pharmacological Profile of A2A Adenosine Receptor Predicts Reduced Fractional Flow Reserve in Patients With Suspected Coronary Artery Disease. J Am Heart Assoc. 2018 Apr 13;7(8):e008290.
26. Kamatam S, Waqar A, Chatterjee T. Extreme Hypernatremia due to Dehydration. J Med Cases. 2023 Jul;14(7):232–6.
27. Christopoulos A. Allosteric binding sites on cell-surface receptors: novel targets for drug discovery. Nat Rev Drug Discov. 2002 Mar;1(3):198–210.
28. Christopoulos A, Kenakin T. G protein-coupled receptor allosterism and complexing. Pharmacol Rev. 2002 Jun;54(2):323–74.
29. Massink A, Gutiérrez-de-Terán H, Lenselink EB, Ortiz Zacarías NV, Xia L, Heitman LH, Katritch V, Stevens RC, IJzerman AP. Sodium ion binding pocket mutations and adenosine A2A receptor function. Mol Pharmacol. 2015 Feb;87(2):305–13.
30. Neve KA, Cumbay MG, Thompson KR, Yang R, Buck DC, Watts VJ, DuRand CJ, Teeter MM. Modeling and mutational analysis of a putative sodium-binding pocket on the dopamine D2 receptor. Mol Pharmacol. 2001 Aug;60(2):373–81.
31. Barbhaiya H, McClain R, Ijzerman A, Rivkees SA. Site-directed mutagenesis of the human A1 adenosine receptor: influences of acidic and hydroxy residues in the first four transmembrane domains on ligand binding. Mol Pharmacol. 1996 Dec;50(6):1635–42.
32. Gutiérrez-de-Terán H, Bello X, Rodríguez D. Characterization of the dynamic events of GPCRs by automated computational simulations. Biochem Soc Trans. 2013 Feb 1;41(1):205–12.
33. Bock A, Bermudez M. Allosteric coupling and biased agonism in G protein-coupled receptors. FEBS J. 2021 Apr;288(8):2513–28.
34. Weis WI, Kobilka BK. The Molecular Basis of G Protein-Coupled Receptor Activation. Annu Rev Biochem. 2018 Jun 20;87:897–919.
35. Parker MS, Wong YY, Parker SL. An ion-responsive motif in the second transmembrane segment of rhodopsin-like receptors. Amino Acids. 2008 Jun;35(1):1–15.
36. Zou AP, Wu F, Li PL, Cowley AW Jr. Effect of chronic salt loading on adenosine metabolism and receptor expression in renal cortex and medulla in rats. Hypertension. 1999 Jan;33(1 Pt 2):511–6.
37. Yagil Y. The effects of adenosine on water and sodium excretion. J Pharmacol Exp Ther. 1994 Feb;268(2):826–35.
38. Blaustein MP, Leenen FH, Chen L, Golovina VA, Hamlyn JM, Pallone TL, Van Huysse JW, Zhang J, Wier WG. How NaCl raises blood pressure: a new paradigm for the pathogenesis of salt-dependent hypertension. Am J Physiol Heart Circ Physiol. 2012 Mar 1;302(5):H1031–49.
39. Linde CI, Karashima E, Raina H, Zulian A, Wier WG, Hamlyn JM, Ferrari P, Blaustein MP, Golovina VA. Increased arterial smooth muscle Ca2+ signaling, vasoconstriction, and myogenic reactivity in Milan hypertensive rats. Am J Physiol Heart Circ Physiol. 2012 Feb 1;302(3):H611–20.
40. DAHL LK, LOVE RA. Evidence for relationship between sodium (chloride) intake and human essential hypertension. AMA Arch Intern Med. 1954 Oct;94(4):525–31.
41. Bailey MA, Dhaun N. Salt Sensitivity: Causes, Consequences, and Recent Advances. Hypertension. 2024 Mar;81(3):476–89.