Abstract
Background: Peak Velocity Interval Training (PVIT) is a task-specific, velocity-based gait training method designed to deliver high-intensity treadmill walking safely in individuals with chronic stroke. Previous work has demonstrated its feasibility, but the associated physiological responses remain less characterized.
Objective: To describe heart rate (HR) behavior during PVIT, examine its relationship to treadmill speed across training sessions, and assess feasibility and safety from a clinical cardiovascular perspective.
Methods: Data were analyzed from a randomized controlled trial involving 77 participants with chronic stroke who completed 12 PVIT sessions. Each session included progressive treadmill intervals designed to target peak walking speed. HR was continuously monitored, and HRpeak was defined as the maximum HR reached during the highest treadmill speed interval. Linear mixed-effects models were used to assess the relationship between HRpeak and peak treadmill speed across sessions.
Results: HR increased during peak intervals and returned toward baseline during recovery, demonstrating consistent within- and across-session patterns. A significant positive association was found between peak treadmill speed and HRpeak (β=0.54, p<0.001), corresponding to an approximate increase of 23.9 bpm per 1.0 m/s increase in speed. While this group-level pattern was evident, inter-individual variability in HR responses was also apparent. No adverse events occurred, and HR recovery remained within protocol-defined safety thresholds.
Conclusion: PVIT elicited predictable cardiovascular engagement and was well tolerated by individuals post-stroke. Despite inter-individual variability, group-level heart responses tracked with treadmill speed, supporting PVIT as a safe, individualized approach to high-intensity, task-specific gait training after stroke.
Keywords
Stroke, Treadmill training, High intensity, Walking, Speed, Heart Rate
Abbreviations
HIIT: High-Intensity Interval Training; HR: Heart Rate; HRmax: Maximal Heart Rate; HRpeak: Peak Heart Rate; HRR: Heart Rate Reserve; PVIT: Peak Velocity Interval Training; REML: Restricted Maximum Likelihood
Introduction
Stroke remains a leading cause of long-term disability worldwide, with up to 70% of survivors experiencing persistent lower limb impairments such as reduced walking speed, decreased endurance, and asymmetrical gait patterns [1–3]. These gait deficits restrict community ambulation, diminish quality of life, and increase the risk of recurrent stroke [4,5]. In neurorehabilitation, high-intensity training has emerged as a critical strategy to stimulate neuroplasticity, promote functional recovery, and improve walking outcomes [6,7].
Conventional treadmill and overground gait training approaches, while beneficial, often produce only modest and short-lived gains [8]. High-intensity interval training (HIIT) offers superior improvements in walking speed, endurance, and cardiovascular capacity compared to moderate-intensity continuous training [9]. However, traditional HIIT protocols frequently prescribe intensity based on predetermined heart rate zones. This approach can be challenging to apply in stroke survivors due to blunted cardiovascular responses, comorbid conditions, and medication effects such as β-blockers that alter HR dynamics [10–12].
Peak Velocity Interval Training (PVIT) is a task-specific, velocity-based treadmill training protocol designed to address these limitations by emphasizing each participant’s highest tolerable walking speed, achieved through structured ramp-up, peak, and recovery phases [13]. PVIT was developed as an alternative to conventional heart rate–zone–based prescriptions, shifting the focus from cardiovascular targets to each individual’s maximal walking velocity. In PVIT, ‘intensity’ is operationalized by task demand (peak treadmill speed relative to the individual’s capacity) rather than by cardiovascular zones, acknowledging post-stroke chronotropic impairment and β-blocker effects. This approach makes high-intensity training more feasible and functionally relevant for people with stroke. Prior work has established the feasibility, safety, and potential of PVIT for improving both treadmill and overground walking performance [14,15].
Although our prior work has established the feasibility and functional benefits of PVIT, the physiological responses that occur during this speed-based protocol, particularly heart rate dynamics, have not been systematically described. Understanding HR patterns during PVIT is important for clinicians who routinely monitor cardiovascular responses and rely on them to judge physiological load during gait rehabilitation. For individuals post-stroke, whose cardiovascular responses may be altered by neurological injury or medication, understanding these patterns is essential for ensuring both safety and appropriate dosing. The aim of this secondary analysis was therefore to describe heart rate behavior during PVIT, examine its relationship with treadmill speed, and assess cardiovascular safety and feasibility in individuals with chronic stroke. In PVIT, exercise intensity is anchored to peak walking speed (task demand) rather than predefined HR zones, which are frequently unreliable post-stroke and with β-blocker use. Accordingly, we examined how HR behaves relative to speed within the PVIT framework rather than on whether participants reach HR-defined ‘high-intensity’ zones.
Methods
Data for this analysis were obtained from a previously completed randomized controlled trial (ClinicalTrials.gov: NCT03492229) that evaluated PVIT in individuals with chronic stroke. Eligibility criteria included a single monohemispheric stroke >6 months prior, age 40–80 years at stroke, residual gait deficits, and ≥5° active dorsiflexion at the paretic ankle. Exclusion criteria were brainstem or cerebellar lesions, major cardiovascular or metabolic disease, contraindications to exercise testing, or Modified Ashworth Scale ≥2. All participants provided written informed consent in accordance with the Declaration of Helsinki, and the study was approved by the University of Illinois Chicago Institutional Review Board. For this analysis, we included the subset of participants who completed all 12 PVIT sessions (n=77). The parent trial enrolled 81 participants; the present analysis focuses on those with complete PVIT training and heart-rate data.
PVIT protocol
Training was delivered on a motorized treadmill with participants secured in an overhead safety harness without body-weight support. Each session began with a 5-minute warm-up at approximately 50% of the participant’s weekly peak treadmill speed, which was estimated by the 10-Meter Walk Test. Intervals followed a standardized sequence:
- Ramp-Up Phase (2 minutes) – gradual increase to peak tolerable speed.
- Peak Phase (10–60 seconds) – walking at peak speed as tolerated.
- Ramp-Down Phase (~ 5 seconds) – decrease to recovery speed.
- Active Recovery (≥2 minutes) – walking at warm-up speed, or until HR was within 5 beats per minute (bpm) of the warm-up value.
Session duration ranged from 20 to 40 minutes, depending on participant tolerance. Speed was adjusted between intervals to maintain a challenging but safe effort level, increasing or decreasing by ~5–10% based on performance and safety observations.
Outcome measures
Peak speed (m/s) was determined as the highest treadmill belt speed achieved by each participant during each PVIT session. The treadmill belt speeds were recorded for every interval performed within each session. Consequently, each participant had 12 peak speed values, corresponding to specific PVIT sessions.
HRpeak (bpm) was defined as the highest recorded heart rate attained by each participant during the interval in which the peak speed was achieved during the PVIT sessions. Each participant had 12 HRpeak values, each associated with the interval in which the peak speed was attained in the respective session. It is essential to note that HRpeak does not represent the maximal heart rate (HRmax) achieved through maximal exertion testing.
Data and statistical analysis
All the data were analyzed using R (version 3.6.3; R Core Team; Vienna, Austria) and R Studio (version 4.0.2) using the lme4 [16], lmerTest [17], tidyverse [18], ggplot2 [19], sjPlot [20], and afex [21] packages. A predetermined alpha level of p≤0.05 was set to determine statistical significance.
Peak speed values were normalized by converting each participant's peak speed to a relative measure, which was expressed as a multiple of the mean peak speed across all participants. This approach ensured that the variations in peak speed reflected true differences related to the PVIT intervention, rather than individual variations in walking speed. To control individual variation and report a more generalizable effect that is less dependent on specific participants, we fitted linear mixed-effects models incorporating a random intercept for each participant to account for within-subject correlation in HRpeak values.
We assessed the impact of peak speed on HRpeak across the 12 PVIT sessions for each participant using longitudinal linear mixed-effects models fitted via restricted maximum likelihood (REML) estimation with Satterthwaite approximation for p-values. Model 0 contained no fixed effects and was referred to as the null model. Model 1 investigated the relationship between HRpeak and peak speed. The objective of this model was to assess the relationship between peak speed (12 levels) and HRpeak (12 levels) within the context of the PVIT training protocol.
Results
A total of 81 participants were enrolled in the larger clinical trial. A complete dataset, including 77 participants, was used in this study after excluding 4 participants due to missing HR or speed data (see Table 1). The mean age was 61.3±8.7 years, time since stroke was 26.4±17.9 months, and baseline walking speed was 1.24±0.26 m/s. Approximately 52% of participants were taking β-blockers or other medications known to influence HR responses. No participants withdrew from PVIT due to cardiovascular concerns.
|
|
Mean (SD) or Count (percentage) |
|
Age (years) |
59 (10) |
|
Time since stroke (years) |
5 (4) |
|
Affected Hemisphere |
|
|
Right |
41 (53%) |
|
Left |
36 (47 %) |
|
Sex |
|
|
Male |
54 (70%) |
|
Female |
23 (30%) |
|
Ethnicity |
|
|
Hispanic or Latino |
5 (7%) |
|
Not Hispanic or Latino |
72 (93%) |
|
Race |
|
|
Black |
38 (49%) |
|
White |
27 (35%) |
|
Asian |
7 (9%) |
|
Type of stroke (n = 75) * |
|
|
Ischemic |
52 (69%) |
|
Hemorrhagic |
23 (31%) |
|
Lesion location (n = 66) * |
|
|
Cortical |
30 (49%) |
|
Subcortical |
31 (51%) |
|
ß blocker medication (n=36)* |
|
|
User |
17 (47%) |
|
Non-User |
19 (53%) |
|
Values are presented as mean (SD) or count (percentage). Data are shown for the 77 participants included in the analysis. Two participants had missing information for the type of stroke, 11 had missing data for lesion location, and 41 had missing data for β-blocker medication status. |
|
Heart rate behavior
Across all sessions, baseline HR at the start of training averaged 116.4±19.8 bpm (range: 70–165 bpm). HRpeak during the highest treadmill-speed interval averaged 136±18.6 bpm (range: 90–180 bpm) across participants. Within sessions, HR increased by an average of ~20 bpm from the warm-up to the highest-speed interval, consistent with a moderate cardiovascular load. On average, HR returned to within 5 bpm of baseline during the active recovery phase. This rise–recover pattern was consistent across more than 90% of PVIT sessions.
Heart rate demonstrated a consistent and expected physiological response during PVIT. Across participants, HR increased during the peak treadmill interval and decreased during the recovery period. This pattern was evident within individual sessions, with HR increasing during the ramp-up phase, peaking during the maximal-speed interval, and returning toward baseline during recovery. Over the 12 training sessions, a clear session-by-session progression in HRpeak was observed in most participants. As treadmill speeds increased across sessions, corresponding HRpeak values also trended upward, reflecting cardiovascular adaptation to increasing workload. Within sessions, HR rose progressively across intervals with incrementally higher walking speeds. These trends collectively indicate that PVIT successfully elicited a scalable cardiovascular training response over time.
Session-by-session progression
Mean HRpeak increased from 129±16 bpm in Session 1 to 147±17 bpm in Session 12. The session-by-session slope was +1.3 bpm/session, with a 95% CI of 0.9–1.7, indicating progressive cardiovascular engagement across training. A repeated-measures analysis confirmed a significant effect of session on HRpeak, F (11, 836) =5.72, p<0.001. Individual trajectories showed variability, with final-session HRpeak values ranging from 124 bpm to 176 bpm (Figure 1).
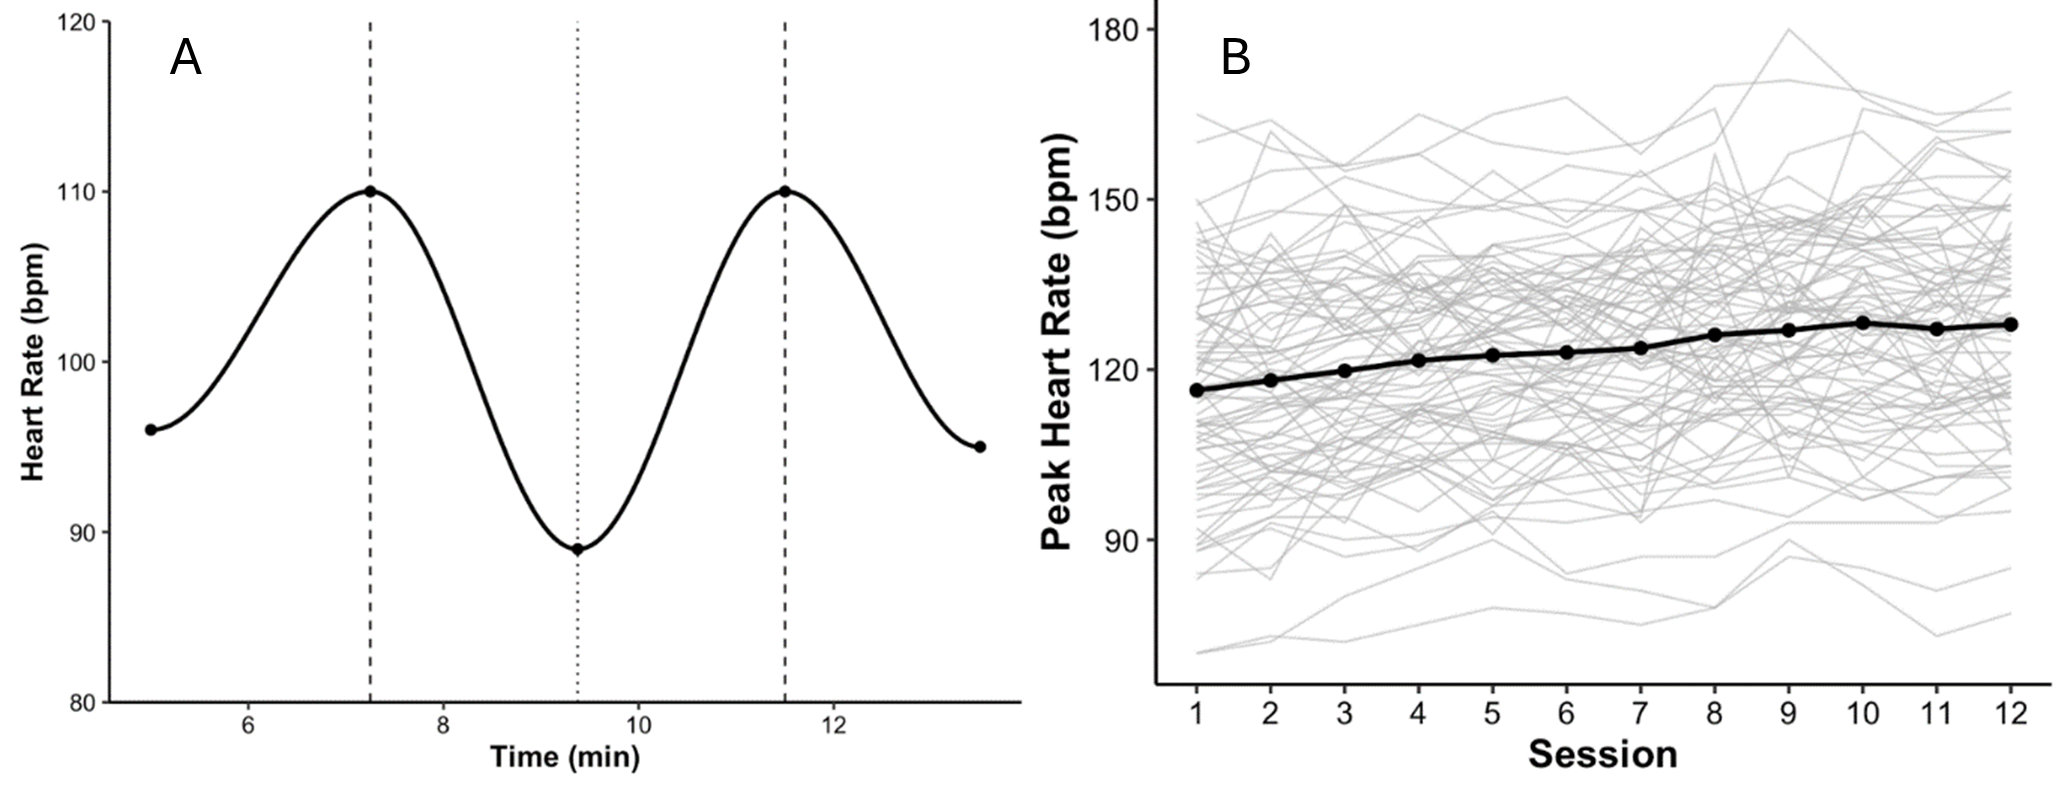
Figure 1. Heart rate responses during PVIT. (A) Example of within-session heart rate (HR) dynamics during a single training session. HR increased during high-speed treadmill intervals and decreased during recovery, illustrating the characteristic rise–recover pattern observed across sessions. (B) Session-by-session progression of peak heart rate (HRpeak). Thin gray lines represent individual participant trajectories, and the solid black line indicates the group mean across 12 PVIT sessions (n=77). Mean HRpeak increased from 129±16 bpm in Session 1 to 147±17 bpm in Session 12, reflecting progressive cardiovascular engagement across training.
HR–speed relationship
There was a strong, statistically significant positive association between peak treadmill speed and HRpeak. Linear mixed-effects modeling revealed that for every 1.0 m/s increase in peak speed, HRpeak increased by approximately 26.36 bpm, β=0.44, 95% CI [23.02, 29.71], p<0.001. This effect accounted for 16.1% of the variance in HRpeak across sessions (R²=0.161 / 0.877). As shown in Figure 2, most participants demonstrated a clear linear relationship between HR and speed, although the slopes varied across individuals.
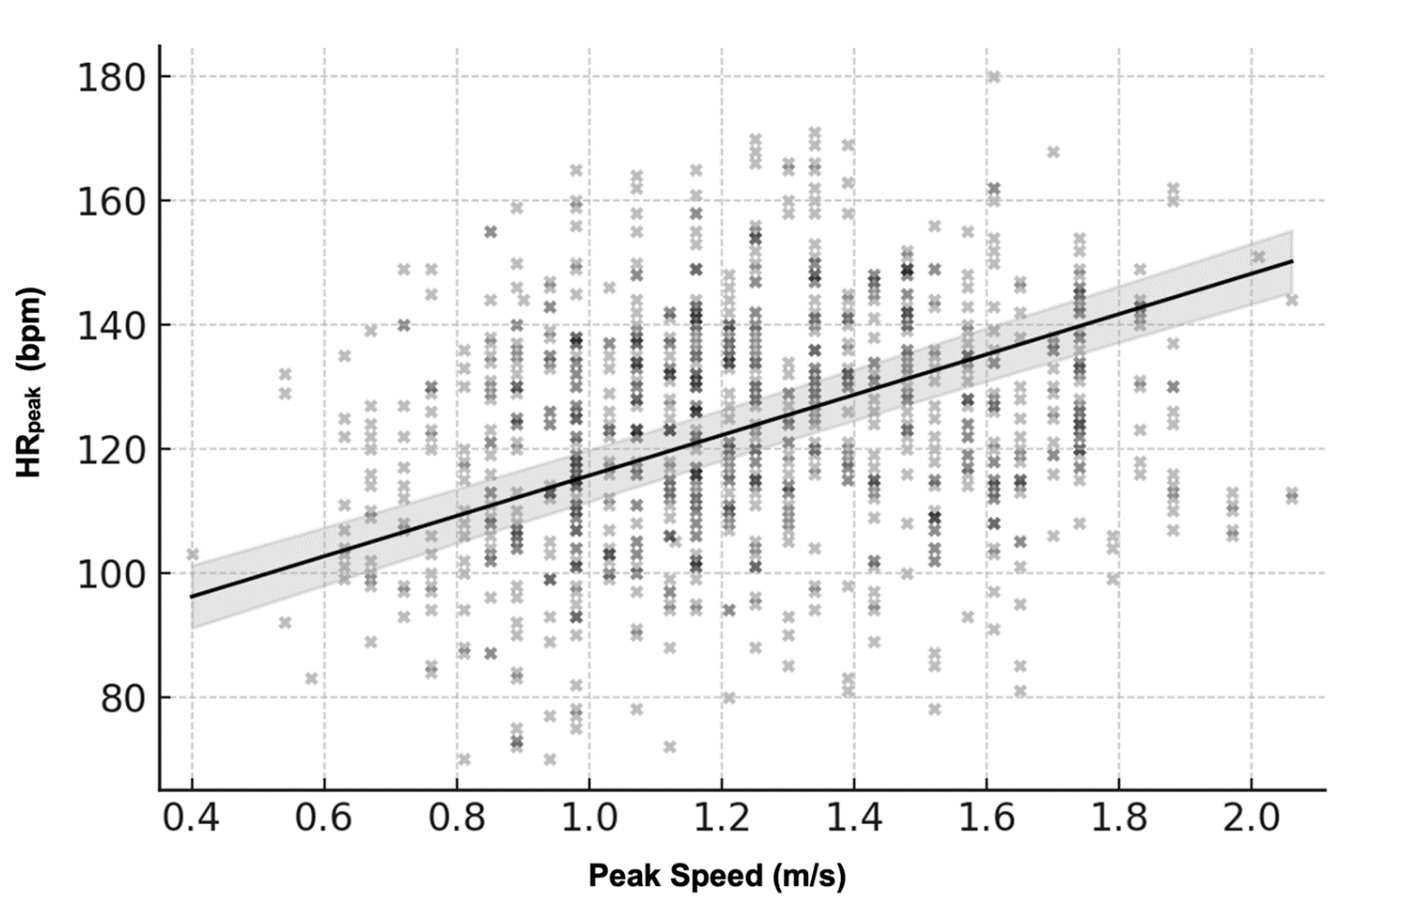
Figure 2. Relationship between peak treadmill speed and peak heart rate (HRpeak). Across all sessions, HRpeak increased proportionally with peak treadmill speed, indicating that cardiovascular response scaled with task intensity. Black points show the raw scatter across participants and sessions. The solid black line represents the linear mixed-effects model fit (β=0.44, p<0.001), and the light gray band denotes the 95% confidence interval, illustrating the group-level HR–speed association despite substantial inter-individual variability.
Across the training period, participants increased their peak treadmill speeds by approximately 0.3–0.4 m/s on average. Applying the model-estimated slope of ≈26 bpm per 1 m/s, this corresponds to an expected HR increase of roughly 8–10 bpm across a typical within-study speed progression. This provides a clinically meaningful interpretation of how changes in walking velocity translate to cardiovascular demand during PVIT.
Model diagnostics demonstrated substantial within-subject correlation. The random-intercept variance was τ²=309.02, and the residual variance was σ²=53.04, yielding an intraclass correlation coefficient (ICC) of approximately 0.854. The marginal R² (variance explained by peak speed alone) was 0.161, whereas the conditional R² (variance explained by both fixed and random effects) was 0.877. These values indicate that the mixed-effects approach effectively captured both group-level patterns and individual variability in HR responses.
While this relationship held at the group level, inter-individual variability was evident. Some participants showed tightly aligned HR–speed trajectories, whereas others exhibited flatter HR responses despite increases in walking speed. This variation likely reflects differences in cardiovascular capacity, medication use, or motor performance, emphasizing the need for individualized interpretation of HR data during intensity-based gait training.
Inter-individual variability
Despite the robust group-level effect, participants demonstrated heterogeneous HR responses. Individual HRpeak–speed slopes ranged from 14 to 33 bpm/m/s, and the variance of random slopes in the mixed-effects model was τ00=309.02. By Session 12, HRpeak values spanned from 124 bpm to 176 bpm. Representative participant trajectories are shown in Figure 1.
Feasibility and safety
All 77 participants completed the 12 PVIT sessions without adverse cardiovascular events. In all cases, HR returned to within 5 bpm of baseline during the active recovery phase, typically within the protocol-specified 4-minute window. No HR excursions beyond safety thresholds were recorded. These findings confirm that the PVIT protocol was safe and well-tolerated, producing reproducible HR responses within a clinically acceptable range.
Discussion
This secondary analysis examined HR responses during PVIT in individuals with chronic stroke. Across sessions, HR consistently rose during peak treadmill intervals and declined during recovery, confirming the feasibility of eliciting higher walking speeds while maintaining cardiovascular safety. A significant positive association between HRpeak and treadmill speed indicated that cardiovascular responses scaled appropriately with task intensity. However, substantial inter-individual variability was observed, suggesting that HR responses are not uniform across all participants.
Interpretation of HR behavior
The observed HR–speed relationship supports the notion that PVIT provides a scalable cardiovascular stimulus aligned with motor intensity. However, variability among participants—potentially influenced by β-blocker use, autonomic dysregulation, or impairment severity—indicates that HR may not always reflect exertion equivalently across individuals. Prior studies have shown that stroke survivors often exhibit blunted HR responses due to medication effects or impaired autonomic regulation [11,22]. Conversely, HR has also been validated as a responsive indicator of exertion during high-intensity training in neurologically impaired populations [9]. The current findings extend this literature by demonstrating both the expected group-level HR–speed scaling (β=26.36 bpm per 1 m/s) and the participant-level variability that complicates individualized interpretation. The magnitude of the HR–speed relationship (26.36 bpm per 1 m/s increase in speed) represents a physiologically meaningful rise in cardiovascular demand with increases in walking velocity. This pattern confirms that participants exerted progressively greater effort as treadmill speed increased, supporting the clinical relevance of monitoring HR during PVIT even when HR is not used to prescribe intensity.
This general pattern of HR elevation is broadly consistent with prior interval-based training studies in chronic stroke, which have reported moderate-to-high cardiovascular engagement (e.g., 53–72% HRR in [9]), despite relying on HR to prescribe intensity. This contextualizes the PVIT findings within the broader high-intensity rehabilitation literature and supports the interpretation that PVIT elicits a meaningful physiological response even though intensity is driven by walking speed rather than HR targets. Medication use, including β-blockers, has likely contributed to the inter-individual variability in HR responses. Such agents can blunt chronotropic responsiveness, resulting in flatter HR trajectories despite increases in walking speed [23]. This pharmacological effect underscores the rationale for using a velocity-based rather than HR-prescribed approach in PVIT, while also highlighting the importance of interpreting HR patterns within the context of each participant’s cardiovascular profile.
HR in context with other measures
In practice, HR can be a valuable element of intensity monitoring during PVIT, but it should be interpreted in conjunction with treadmill speed and, where possible, ratings of perceived exertion (RPE). Speed anchors the protocol to a functional, task-specific measure of effort, and the American College of Sports Medicine (2021) highlights the importance of incorporating subjective exertion metrics, particularly when HR responses are muted. Although RPE data were not included in this secondary analysis, previous PVIT studies [14,15] demonstrate that treadmill speed progression provides a reliable and feasible basis for clinical implementation. Integrating HR and RPE with speed may therefore enhance individualized prescription and monitoring. In this context, HR does not prescribe intensity. Instead, it serves as a complementary indicator that clinicians can use to verify physiological engagement, monitor safety, and identify blunted or atypical responses. In this way, HR supports, but does not determine, intensity progression, which remains anchored to walking speed. In clinical practice, HR monitoring within PVIT may be most useful for verifying adequate recovery between intervals, identifying blunted or atypical responses, and supporting safety decision-making rather than prescribing specific training zones.
Task-specific vs HR-defined intensity
Although PVIT was designed as a high-intensity, velocity-based intervention, participants’ heart rate responses often remained below traditional high-intensity thresholds (≥85% HRmax or ≥70% HRR). This likely reflects the chronic stroke population’s blunted cardiovascular responsiveness, frequent β-blocker use, and the protocol’s emphasis on achieving each participant’s peak tolerable walking speed rather than targeting cardiovascular load per se. Consequently, while PVIT consistently elicited cardiovascular engagement, its “high-intensity” classification should be interpreted primarily in the context of task-specific motor performance and neuromotor demand rather than conventional HR-defined zones. In post-stroke populations, absolute HR may not reliably index exertion, making speed-anchored dosing a more functionally relevant and individualized stimulus. The positive HR–speed association further supports that internal load increased proportionally with task demand, even when HR zones remained sub-threshold. Future work integrating ratings of perceived exertion and direct measures of oxygen uptake or ventilatory responses could better triangulate internal load when HR is pharmacologically or neurologically constrained.
Relevance to stroke rehabilitation
These findings reinforce that individuals with chronic stroke can tolerate high-intensity, task-specific gait training delivered through PVIT. The consistent rise–recovery HR pattern, and strong HR–speed demonstrates that the protocol elicits a meaningful physiological response while maintaining cardiovascular safety. Importantly, PVIT’s speed-based structure allows clinicians to individualize progression according to each participant’s motor performance and tolerance rather than relying solely on HR zones. In doing so, PVIT provides a practical way to bypass unreliable HR targets while still producing measurable cardiovascular engagement, a key advantage in post-stroke exercise prescription. This aligns with previous consensus statements that emphasize the importance of functionally relevant, high-effort training as a driver of neuroplasticity and walking training post stroke [4,7]. The observed inter-individual variability underscores the importance of multimodal intensity monitoring—integrating treadmill speed, HR, and perceived exertion—to ensure adequate challenge and safety in clinical practice.
Limitations
This study has several limitations. It represents a secondary analysis of a moderate-sized subsample, which limits generalizability. HR was collected continuously, but without reporting of additional markers of exertion, such as RPE or direct measures of oxygen uptake. The absence of these complementary measures restricts conclusions about the broader physiological demands of PVIT. Although β-blocker use likely contributed to the inter-individual variability in HR responses, medication status was not included as a covariate due to incomplete data and insufficient power for meaningful subgroup analyses. This represents a limitation of the present secondary analysis, and future studies with complete medication records will be important for determining the specific effects of β-blockers and other HR-altering agents on cardiovascular responses during PVIT. Moreover, other participant-level characteristics, such as age, baseline cardiovascular fitness, or lesion characteristics, may also influence HR responsiveness, but these factors could not be examined in the present dataset due to incomplete clinical information and limited power for exploratory subgroup analyses. In addition, participants were in the chronic phase of stroke recovery, and results may not apply to individuals earlier in recovery or with greater impairment. Future studies should consider integrating walking speed, HR, and ratings of perceived exertion, and potentially direct measures of oxygen uptake, to develop a multidimensional intensity index that more fully captures both external task demand and internal physiological load during gait rehabilitation after stroke.
Clinical significance
PVIT represents a feasible, safe, and adaptable approach for delivering high-intensity, task-specific gait training in individuals with chronic stroke. The protocol reliably elicited cardiovascular engagement while maintaining safety thresholds. While HR can guide training intensity, its most significant utility lies in complementing treadmill speed and subjective exertion ratings rather than serving as a stand-alone indicator. Overall, these findings strengthen the evidence supporting PVIT as a structured, individualized framework for safely advancing gait training intensity in clinical practice.
Conclusions
This secondary analysis demonstrates that Peak Velocity Interval Training (PVIT) elicits consistent cardiovascular engagement in individuals with chronic stroke, with heart rate increasing during peak treadmill intervals and returning toward baseline during recovery. At the group level, HR responses scaled with treadmill speed, confirming the protocol's physiological demands and safety. At the same time, variability across participants suggests that HR should be interpreted in conjunction with treadmill speed and perceived exertion, rather than relied upon in isolation. Taken together, these findings reinforce PVIT as a safe, individualized, and clinically adaptable approach for delivering high-intensity, task-specific gait training in stroke rehabilitation.
Acknowledgments
We thank the members of the Brain Plasticity Lab for their work involving participant recruitment and data collection.
We declare that the results of this study are presented clearly, honestly, and without any fabrication, falsification, or inappropriate data manipulation.
Funding
This study was supported by the NIH (R01HD075777). The funding body had no role in the design of the study, the collection, analysis, and interpretation of data, or in writing the manuscript.
Conflict of Interest
None declared.
References
2. Olney SJ, Richards C. Hemiparetic gait following stroke. Part I: Characteristics. Gait & Posture. 1996 Apr 1;4(2):136–48.
3. Woolley SM. Characteristics of gait in hemiplegia. Top Stroke Rehabil. 2001 Winter;7(4):1–18.
4. Billinger SA, Arena R, Bernhardt J, Eng JJ, Franklin BA, Johnson CM, et al. Physical activity and exercise recommendations for stroke survivors: a statement for healthcare professionals from the American Heart Association/American Stroke Association. Stroke. 2014 Aug;45(8):2532–53.
5. White J, Magin P, Attia J, Sturm J, McElduff P, Carter G. Predictors of health-related quality of life in community-dwelling stroke survivors: a cohort study. Fam Pract. 2016 Aug;33(4):382–7.
6. Boyne P, Dunning K, Carl D, Gerson M, Khoury J, Kissela B. High-intensity interval training in stroke rehabilitation. Top Stroke Rehabil. 2013 Jul-Aug;20(4):317–30.
7. Hornby TG, Reisman DS, Ward IG, Scheets PL, Miller A, Haddad D, et al. Clinical Practice Guideline to Improve Locomotor Function Following Chronic Stroke, Incomplete Spinal Cord Injury, and Brain Injury. J Neurol Phys Ther. 2020 Jan;44(1):49–100.
8. Mehrholz J, Thomas S, Elsner B. Treadmill training and body weight support for walking after stroke. Cochrane Database Syst Rev. 2017 Aug 17;8(8):CD002840.
9. Boyne P, Dunning K, Carl D, Gerson M, Khoury J, Rockwell B, et al. High-Intensity Interval Training and Moderate-Intensity Continuous Training in Ambulatory Chronic Stroke: Feasibility Study. Phys Ther. 2016 Oct;96(10):1533–44.
10. Aftyka J, Staszewski J, Dębiec A, Pogoda-Wesołowska A, Żebrowski J. Heart rate variability as a predictor of stroke course, functional outcome, and medical complications: A systematic review. Front Physiol. 2023 Feb 9;14:1115164.
11. Tang A, Sibley KM, Thomas SG, McIlroy WE, Brooks D. Maximal exercise test results in subacute stroke. Arch Phys Med Rehabil. 2006 Aug;87(8):1100–5.
12. Yang L, Wenping X, Jinfeng Z, Jiangxia P, Jingbo W, Baojun W. Are beta blockers effective in preventing stroke-associated infections? - a systematic review and meta-analysis. Aging (Albany NY). 2022 May 18;14(10):4459–70.
13. Madhavan S, Cleland B, Doshi A, Ozemek C. Tailoring interval training in stroke rehabilitation: The role of peak velocity. J Rehabil Res Pract. 2025;6(1):20–6.
14. Madhavan S, Cleland BT, Sivaramakrishnan A, Freels S, Lim H, Testai FD, et al. Cortical priming strategies for gait training after stroke: a controlled, stratified trial. J Neuroeng Rehabil. 2020 Aug 17;17(1):111.
15. Madhavan S, Lim H, Sivaramakrishnan A, Iyer P. Effects of high intensity speed-based treadmill training on ambulatory function in people with chronic stroke: A preliminary study with long-term follow-up. Sci Rep. 2019 Feb 13;9(1):1985.
16. Bates D, Mächler M, Bolker B, Walker S. Fitting linear mixed-effects models using lme4. Journal of Statistical Software. 2015 Oct 7;67:1–48.
17. Kuznetsova A, Brockhoff PB, Christensen RH. lmerTest package: tests in linear mixed effects models. Journal of Statistical Software. 2017 Dec 6;82:1–26.
18. Wickham H, Averick M, Bryan J, Chang W, McGowan LD, François R, et al. Welcome to the Tidyverse. Journal of Open Source Software. 2019 Nov 21;4(43):1686.
19. Wickham H. Data analysis. Inggplot2: elegant graphics for data analysis 2016 Jun 9 (pp. 189–201). Cham: Springer International Publishing.
20. Lüdecke D. sjPlot-data visualization for statistics in social science. Zenodo. 2021 Nov 26.
21. Singmann H, Bolker B, Westfall J, Aust F, Ben-Shachar MS. afex: Analysis of factorial experiments. (No Title). 2012 Aug 9.
22. Yang YR, Wang RY, Chen YC, Kao MJ. Dual-task exercise improves walking ability in chronic stroke: a randomized controlled trial. Arch Phys Med Rehabil. 2007 Oct;88(10):1236–40.
23. Priel E, Wahab M, Mondal T, Freitag A, O'Byrne PM, Killian KJ, et al. The Impact of beta blockade on the cardio-respiratory system and symptoms during exercise. Curr Res Physiol. 2021 Oct 28;4:235–42.