

Abstract
Background: Breast cancer (BCa) is the most common malignancy in women where incidence, distribution, clinical outcomes, and mortality rates vary widely among women of different racial and/or ethnic backgrounds.
Methods: To explore the metabolome of normal and malignant breast tissues and try to discriminate BCa disease in a cohort of African American women, biospecimens (n=48) were analyzed by untargeted metabolomics using 1H nuclear magnetic resonance (NMR) spectroscopy. Breast specimens were characterized as control or malignant. Control samples were obtained from reduction mammoplasty surgeries, including those with benign fibrocystic changes or non-malignant fibroadenoma, whereas malignant BCa samples encompassed grades I-III and four clinical subtypes. Multivariate and statistical analyses were performed to identify important spectral bins for differentiation of phenotypes and corresponding metabolite annotation by library-matching was done in Chenomx. Pathway analysis was performed using MetaboAnalyst. Metabolite association with demographic, clinical, and pathological risk factors were assessed using rank-based tests across all 212 spectral bins, with p-value adjusted for multiple testing using the Benjamini-Hochberg False Discovery Rate (BH-FDR) method.
Results: Preliminary metabolic differences were observed between reduction mammoplasty biospecimens, based on the presence or absence of fibrocystic changes or fibroadenoma. Control biospecimens were then classified as mammoplasty-normal, mammoplasty-with fibrocystic changes and mammoplasty-with fibroadenoma. Thus, following initial comparisons, subsequent subgroup analyses comparing BCa biospecimens were performed using only mammoplasty-normal tissues as the control reference. Distinct endogenous pathway profiles were also observed across all preliminary comparisons derived by multivariate analysis. Multivariate analysis also distinguished BCa from control tissues and captured exploratory differences across histological BCa groups by stage and grade. However, following Benjamini-Hochberg False Discovery Rate (BH-FDR) correction, only 12 bin regions remained significant. No bins survived FDR analysis in correlation analyses with risk factors, while several subgroup models showed weak predictive validity.
Conclusions: This exploratory pilot study identified several metabolites that differed among breast tissue types from African American women using NMR. These metabolites represent promising candidates for further investigation through larger cohorts and independent validation studies to determine their contributions to BCa etiology, disease progression and potential metabolic contributions to health disparities.
Keywords
Metabolomics, Biomarkers, Breast cancer (BCa), Reduction mammoplasty, Fibrocystic breast disease, Fibroadenoma, African American (AA), Health disparity
Introduction
Breast cancer (BCa) is the most common malignancy in women, and the incidence and subtype distribution vary widely among women of different racial/ethnic backgrounds [1–3]. Historically, the prevalence of BCa was higher in Caucasian (CA) women compared to African American (AA) women, while mortality rates were significantly higher in AA women [2,4–8]. Updated statistics show that BCa incidence rates among AA women converged with those of CA women in 2015 [9,10], and these numbers have remained dismal over the past 10 years [11–14]. In addition, clinical outcomes for AA women with BCa remain less favorable than those observed in CA and Asian women in the United States, and the incidence rates among younger women (under 50 years of age) are also increasing. For greater than 50 years, it has been well documented by researchers, clinicians, epidemiologists, and funding agencies, etc., that cancer disparities exist, particularly in Black people including AAs, who have some of the lowest survival rates compared to any other racial or ethnic group for most types of cancer [15,16]. Additionally, to a greater degree, AAs experience the outcomes of socially constructed health inequities rooted in structural racism [14]. Although it is well known, biospecimens from AA women have traditionally been difficult to obtain for biomarker studies, leaving a significant knowledge gap. Thus, there remains a need for a more comprehensive understanding of these disparities, increased investment in research, strengthened prevention programs such as screening for earlier detection, intervention, equitable health care delivery, and sustained application of established cancer control strategies, including smoking prevention and cessation programs, as well as initiatives promoting healthier diets and increased physical activity. Collectively, these efforts are widely recognized as critical to improving cancer outcomes and overall health [11–13,17].
The pathological features of BCa follow a progressive sequence from the transformation of a normal cell to benign proliferation, hyperplasia, atypical ductal hyperplasia (ADH), ductal carcinoma in-situ (DCIS) to invasive ductal (or lobular) carcinoma (IDC) and metastatic diseases [18,19]. It has been reported that the disease phenotype is distinguishable in ADH and progresses along distinct pathways for each of the primary clinical subtypes [20,21]. The genetic signature for disease heterogeneity across subtypes is greater than the heterogeneity of progression from DCIS to IDC within a subtype, suggesting that the disease subtypes have distinct progression pathways [21] or mechanisms. Current gold standard methods of detection and initial disease assessment include physical examination and periodic mammography imaging. However, both methods have low sensitivity and specificity for predicting the stage and grade of disease and can miss smaller masses or generate false positive or false negative results [22–25]. Especially early-on, when masses are at the most effective treatable stage, and this can depend on multiple factors, like heterogeneity in breast tissue architecture based on density [26–28]. Definitive BCa diagnoses will likely always require tissue biopsy, allowing for well-established genetic and molecular evaluation; but this method is invasive, time-consuming and can risk overtreatment in cases where masses are found to be benign/non-malignant. Thus, there is a need for non-invasive screening methods that capture molecular and mechanistic changes defined by the presence of a tumor, such as new biomarkers [29], which can also potentially distinguish between less aggressive and aggressive forms of BCa that will progress and have the potential to become metastatic and a higher propensity for recurrence.
The cancer phenotype can be identified at an early stage because the genes altered in this stage result in further post-transcriptional and -translational modifications as the disease progresses [30]. In addition, our recent studies [31–38] and those of others [39–41] have shown an increased level of common metabolites in BCa tissue. Metabolomics can be used to detect these modifications and identify the contributing and critical factors [42]. Metabolic profiling is of special importance in cancer biology due to profound changes in central metabolism associated with many tumors as established early by biochemical studies [5,43]. Metabolite concentrations in cellular systems are highly dependent on the physiological, environmental and genetic status of an organism and are regarded as the ultimate result of cellular regulation, resulting in the visible phenotypes [44]. Therefore, the comprehensive analysis of metabolite levels and fluxes provides a powerful tool for assessing the degree of perturbation in biological systems [32,38]. We are especially focused on aggressive disease in the AA population, who in the past 10 years have had higher BCa incidence and the highest mortality rates of triple-negative (TN) disease compared to all other populations [8,12–14].
The goals of this exploratory pilot study were to identify novel candidate biomarkers and metabolic mechanisms that could potentially be leveraged for earlier detection and improved classification of BCa progression. As a first step toward this goal, we used breast tissue specimen from AA women with and without BCa and identified distinct metabolic profile differences associated with disease status compared with non-malignant tissues, as well as metabolic alterations across histological grades I-III. The library-matched metabolites were evaluated for associations with established BCa risk factors, including age, body mass index (BMI), smoking status, menopausal status, hormone receptor status, and other demographic and clinicopathological characteristics.
Materials and Methods
Study cohort participants and description of biospecimens
For this study, 48 breast tissue samples (Table 1) were selected from our biorepository at Howard University Cancer Center (HUCC) Tissue and Plasma Bank. Biospecimens were collected from AA women residing in the Washington DC Metropolitan area between 2007 and 2013. Participants included those screened for suspicious BCa lesions, those diagnosed with BCa, and/or undergoing reduction mammoplasty surgery (serving as control tissues) at the Howard University Hospital and Providence Hospital. In collaboration with the surgical teams and Pathology Departments at each institution, excess tissue biospecimens were obtained from the Pathologist, following histopathological conformation of tumor-dense regions. Immediately following collection, fresh tissues were maintained under ultra-cold storage at -80°C. Specimens were either placed directly on dry ice in the operating room or from transferred from the Pathology Department shortly after surgical procedures. Thus, according to the study protocols, no significant degradation of specimen integrity occurred between collection and long-term storage, and no freeze-thaw cycles were introduced that could potentially affect metabolomics analyses. The histopathological diagnosis of all control biospecimens was independently reviewed and confirmed by a board-certified pathologist. Specimens were classified as normal mammoplasty tissue, fibrocystic breast tissue, or fibroadenoma based on established histopathological criteria before inclusion in the metabolomics analysis cohort. In December 2015, biospecimens were shipped to RTI International, and metabolomics data acquisition was performed in 2016 by the Eastern Regional Comprehensive Metabolomics Recourse Core (RTI ERCMRC).
|
Breast tissue type |
Sample size (total 48) |
≤ 54 years |
≥ 55 years |
BMI range (22.1 – 46.5) |
Smoker |
Alcohol |
ER+/- Status |
PR+/- Status |
HER2+/- Status |
Grade (I) |
Grade (II) |
Grade (III) |
|||||||||
|
Yes |
No/F |
Yes |
No |
||||||||||||||||||
|
Mammoplasty -normal |
8 |
6 |
2 |
24.8–34.7 |
|
8 |
2 |
5 |
|
|
|
|
|
|
|||||||
|
Fibrocystic/ Fibroadenoma |
9 |
5 |
4 |
24.1–39.5 |
|
3 |
2 |
1 |
|
|
|
|
|
|
|||||||
|
BCa - IDC |
18 |
9 |
9 |
24.1–43.9 |
8
|
15 |
5
|
15 |
8+ / 9- |
8+ / 8- |
2+ / 14- |
1 |
8 |
9 |
|||||||
|
BCa - InDC |
9 |
5 |
4 |
22.1–44.3 |
0+ / 8- |
3+ / 5- |
2+ / 6- |
x |
2 |
7 |
|||||||||||
|
BCa - IFC |
1 |
0 |
1 |
46.5 |
1+ / 0- |
x |
x |
1 |
|||||||||||||
|
BCa - PMC |
2 |
2 |
0 |
36.8–37.0 |
2+ / 0- |
2+ / 0- |
0+ / 2- |
x |
1 |
1 |
|||||||||||
|
Abbreviations: BCa: Breast Cancer; BMI: Body Mass Index; F: Former Smoker; ER: Estrogen Receptor; PR: Progesterone Receptor; HER2: Human Epidermal Growth Factor 2; InDC: Infiltrating Duct Carcinoma; IFC: Inflammatory Cancer. Receptor positive (+) or negative (-). The age ranges of ≤54 years old and ≥55 years old correlate to average cutoffs for being pre-to-perimenopausal and postmenopausal, respectively. Invasive ductal carcinoma (IDC) samples were described as moderately to poorly differentiated, one pleomorphic carcinoma (PMC) sample was described as lobular, and two BCa samples were missing tissue type metadata. Missing data in the clinical and pathological category columns indicates that this information was missing from the study record or Tumor Registry record. If no data is represented by the field an “x” appears in the table. |
|||||||||||||||||||||
The cohort study from which the biospecimens were collected was conducted in accordance with the Declaration of Helsinki. All participants provided written informed consent for the collection and research use of their biospecimens, including the tissue samples analyzed in this study. Collections were made under the protocols approved by the Institutional Review Boards (IRBs) of Howard University (IRB-12-CMED-39) and Providence Hospital (IRB-2014-0901). Biospecimens were collected along with corresponding demographic and clinical/pathological information. All study participants and samples were internally coded and subsequently re-coded by the ERCMRC conducting the metabolomics analyses to ensure patient confidentiality.
Metabolomics sample preparation and data acquisition
Metabolites were extracted from tissue samples and analyzed by broad spectrum (untargeted) metabolomics using proton (1H) nuclear magnetic resonance (NMR) spectroscopy, as described previously [45–50]. Briefly, 48 frozen tissue samples (~100 mg per sample) were transferred to tubes containing homogenization beads. Sufficient extraction solvent (50:50 Acetonitrile:water) was added to each tissue sample to generate 1 mg/mL lysates using a MagNA Lyser (Roche Life Science, Pleasanton, CA, USA). Samples were centrifuged at 16,000 rpm at 4°C, and 500 µL of supernatant was transferred to clean tubes. An additional 125 µL aliquot from 23 randomly selected samples was pooled to generate analytical quality control (QC) samples. Samples were lyophilized to dryness and reconstituted in 700 µL of phosphate-buffered deuterium oxide (D2O) Master mix containing the Chenomx internal standard (ISTD) [0.6 mM 4,4-dimethyl-4-silapentane-1-sulfonic acid (DSS-D6; Chemical Shift Indicator)] and 0.2 % NaN3 with Imidazole. Tubes were vortexed, centrifuged, and a 600 µL aliquot of each sample was transferred to 5 mm NMR tubes (Bruker-BioSpin, Switzerland) for data acquisition.
NMR spectra were acquired for individual tissue samples and the pooled QC samples using a Bruker Avance III 700 MHz NMR spectrometer (Bruker-BioSpin, Rheinstetten, Germany), equipped with a cryogenically cooled 5 mm Automatic Tuning and Matching Accessory (ATMA) probe. Data were collected at 25°C and a 1D NOESY pre-saturation pulse sequence (noesypr1d) [45]. 1H NMR spectra were preprocessed using ACD NMR Processor 12.0 software (Advanced Chemistry Development, Toronto, ON, Canada). All spectra were binned using intelligent bucketing with width of 0.04 ppm and a 50% looseness factor. Spectral regions from 0.70–9.00 ppm were included, while regions corresponding to water (4.77–4.90 ppm) and methanol (3.33–3.36 ppm) were excluded. Each bin integral was normalized to the total spectral integral. NMR signals in the spectra were matched to metabolites [32] (annotation or identification) using the Chenomx NMR Suite 8.1 Professional software (Chenomx, Edmonton, Alberta, Canada). The Chenomx software contains a pH sensitive internal metabolites library of standards run on a range of NMR frequencies and peak clusters modeled to chemical shift and J-coupling) [51]. In addition, annotations of lipid peaks were based on literature [52]. It should be noted that metabolites in NMR spectra may contain one or more peaks (chemical shift) and peak splitting (J-coupling) based on the chemical structure and chemical environment of the metabolite.
Multivariate analyses
Multivariate analyses, including principal component analysis (PCA) and orthogonal partial least squares discriminant analysis (OPLS-DA), were performed using the normalized binned data which were first Pareto-scaled and mean-centered. Analyses were performed using SIMCA 14.1 (Sartorius Stedim AB, Umeå, Sweden). For this exploratory pilot study, multivariate analysis as an a priori data analysis plan, was used to better understand the differences in phenotypic groups. The PCA scores plots were inspected to confirm that the phenotypic pooled samples clustered tightly within the center of their phenotypic groups and that the total study pool clustered centrally among all samples (Supplementary Figure S1). This QC approach is widely applied in metabolomic studies [53]. Loadings plots and variable influence on projection (VIP) plots were inspected and data lists were exported into Excel. The VIP statistic summarizes the contribution of each bin to group separation (e.g., BCa cases versus controls) in multivariate space [53]. All models were evaluated using 7-fold cross-validation to assess the predictive variation of the model (Q2).
Statistical analyses were performed using SAS 9.4 (SAS Institute Inc., Cary, NC) to calculate fold changes and nominal p-value for bins associated with differences in the VIP scores. For initial case-control comparisons of continuous variables, either t-test assuming unequal variances or the Wilcoxon Rank Sum Test were used because sample sizes were small. As this was an exploratory analysis, p-values were not adjusted for multiple testing [54], but the FDR p-values were calculated and reported when possible. Bins were considered important for distinguishing study groups if they met at least one of the following criteria: 1) VIP≥1.0 with a jack-knife confidence interval not including 0; 2) fold change magnitude ≥2; or 3) p-value <0.10 [55]. All peaks identified in bins that were important for differentiating the study groups were assigned to metabolites using Chenomx NMR Suite 8.1 Professional software (Edmonton, Alberta, Canada), which contained a reference library of approximately 350 compounds at the time of analysis. Subsequently, all 212 bins were evaluated using a consistent rank-based framework and FDR correction, as further described in Section 2.5. Positive signed fold change indicates a higher median in Group 1 than Group 2; where negative values indicate a lower median in Group 1. All raw and processed analytical data, along with associated de-identified metadata, have been deposited in the publicly accessible NIH Common Fund Metabolomics Data Repository:
Pathway analysis
The publicly available MetaboAnalyst 4.0 pathway enrichment platform (Xia Lab, McGill University and Wishart Research Group, University of Alberta, Canada) was used to identify perturbed canonical pathways and to assess enrichment of endogenous metabolic network differences between BCa cases and controls [56,57]. The threshold and p-value (p≤0.05) criteria were included based on the calculated fold-changes (threshold) and p-values (p≤0.10) derived from the binned data for metabolite-based analyses, unless otherwise specified in the table legend.
Statistical analysis
More robust analyses were performed using SPSS to assess any significant correlation between library-matched spectral bins, through multivariate analyses and library-matched metabolite annotations that distinguished breast tissue phenotypes in case versus control groups, with a range of clinical and pathological BCa risk factors. Associations were first evaluated individually with respect to age range (≤54 years old vs. ≥55 years), Body mass index (BMI) (<30 vs. ≥30), tumor Grade (I, II or III), tumor Stage (TNM stages I-IV), lymph node status, estrogen receptor (ER) status (positive + or negative -), progesterone (PR) status (+ or -), HER2 status (+ or -), triple negative breast cancer (TNBC) status (yes or no), family history of cancer (yes or no), smoking status (yes, no, or former), alcohol use (yes or no), and menopausal status (yes or no). Minimum detectable standardized mean differences at 80% power and two-sided alpha=0.05 were calculated to contextualize the limited precision of small subgroup analyses.
Following the univariate analysis, all 212 spectral bins were reanalyzed using two-sided Mann-Whitney U tests for two-group comparisons and Kruskal-Wallis tests for variables with more than two levels. A uniform rank-based framework was used because Shapiro-Wilk testing showed that 47%-72% of bins were non-normal in at least one group across the principal comparisons and because several subgroups were small. Benjamini-Hochberg FDR (BH-FDR) correction was applied separately across the 212 bins within each prespecified tissue comparison and each clinical/pathological variable. PCA/QC assessment repeated cross-validated PLS-DA sensitivity analyses, permutation testing, outlier sensitivity were also conducted. Both nominal p-values and adjusted q-values were evaluated and q<0.05 was considered FDR-supported. Rank-biserial correlations were calculated for two-group comparisons.
Results
Cohort characteristics
Biospecimens utilized for this pilot study were obtained from a cohort of AA women, who provided informed consent to participate and were seen at the Howard University Hospital, the Howard University Cancer Center, or Providence Hospital in Washington DC. Tissue samples were previously collected from women aged 21–78 years and categorized into two age groups (≤54 years and ≥55 years) for analysis. Samples were also classified as one of three types for breast tissue controls with no BCa, as reduction mammoplasty-normal, mammoplasty-with fibrocystic changes or mammoplasty-with fibroadenoma and compared to BCa cases, which included clinically localized disease (atypical ductal hyperplasia [ADH] or ductal carcinoma in situ [DCIS]), or invasive BCa (invasive ductal carcinoma, infiltrating duct carcinoma, inflammatory carcinoma, and pleomorphic carcinoma). Cohort characteristics are detailed in Table 1, along with aggregated corresponding demographic, clinical, and pathological information. No significant differences were observed in the mean age at diagnosis between participants in the fibrocystic tissue group and those in the BCa tissue group (p=0.2628). Similarly, BMI didn’t differ significantly among the groups (p=0.5944). The breakdown of the numbers of samples in each phenotypic tissue group is detailed in Supplementary Table 1.
Metabolomic profiling distinguishes normal breast tissues from benign diseases
All tissue biospecimens were prepared as described in the Materials and Methods section for metabolomics data acquisition using 1H-NMR spectroscopy. Following data acquisition, the raw spectral free induction decays (FIDs) were zero-filled to 64k, and an exponential line broadening factor of 0.5 Hz was applied prior to Fourier transformation. The spectra were then manually phased, baseline-corrected, and referenced to DSS as a part of the QC process. Subsequently, spectra were aligned and binned for further analyses. To determine tissue-level metabolomic differences among the three breast tissue control groups, we first performed pairwise multivariate analyses in SIMCA comparing mammoplasty-normal breast tissues to mammoplasty-with fibrocystic changes and mammoplasty-with fibroadenoma. These groups represented benign and non-malignant breast lesions obtained from women undergoing reduction mammoplasty or breast mass biopsy procedures. Although all three tissue types were initially selected as controls to characterize the metabolic alterations expected to differentiate BCa tumor samples, the orthogonal partial least squares discriminant analysis (OPLS-DA) plot unexpectedly revealed differentiation (based on VIP≥1.0 with a jack-knife confidence interval not including 0; or 2) fold change magnitude ≥2; or 3) p-value <0.10) between the three mammoplasty sample groups (black dots vs orange dots), with the latter two clustering together as a single group in the preliminary multivariate analysis (Figure 1A). The mammoplasty-with fibrocystic changes and mammoplasty-with fibroadenoma tissue groups were analyzed together due to sample numbers and pathobiological similarity compared to fully normal mammoplasty or BCa biospecimens. Even by unsupervised principal component analysis (PCA), differentiation can be seen (Supplementary Figure S1). Although several studies use mammoplasty-normal tissue alone, it is more common to see a mixed combination of all three being used as controls for comparison with BCa. Our results reflect that benign fibrocystic or fibroadenoma tissues differ from mammoplasty-normal tissues not only by histopathological features (i.e., underlying proliferative or structural alterations, microenvironmental inflammation, etc.) but as demonstrated here, also by metabolic profile. Though preliminary, because of unadjusted statistical analyses and small sample sizes, these metabolic differences identified 43 library-matched metabolites (Table 2) that may reflect group separation driven by morphological differences, as we also see distinction in corresponding pathway enrichment analysis (Figure 1B) and for perturbed endogenous metabolomic pathways (Figure 1C). The top five significantly enriched pathways (p<0.05), although for unadjusted measurements, included Ammonia Recycling, Glycine and Serine Metabolism, Aspartate Metabolism, the Urea Cycle and Arginine and Proline Metabolism.
|
Library-matched Metabolites*** |
VIP |
p-value* |
FDR p-value |
Fold Change** |
|
3-Hydroxybutyrate |
1.8 |
0.01 |
0.247 |
1.8 |
|
4-Hydroxybenzoate |
0.8 |
0.151 |
0.370 |
-3 |
|
Alanine |
0.9 |
0.035 |
0.263 |
1.4 |
|
Arginine |
1.3 |
0.012 |
0.247 |
1.6 |
|
Arginine | Lysine |
1.1 |
0.012 |
0.247 |
3.1 |
|
Asparagine (2 bins) |
0.5–0.6 |
0.058–0.081 |
0.262–0.277 |
1.5–2.3 |
|
Asparagine | Glutathione |
0.7 |
0.13 |
0.333 |
2.4 |
|
Aspartate |
0.9 |
0.049 |
0.263 |
1.5 |
|
Aspartate | Dimethylamine |
0.9 |
0.058 |
0.263 |
1.6 |
|
Creatine | Creatinine | Lysine |
1 |
0.13 |
0.333 |
1.8 |
|
Creatine | Tyrosine (2 bins) |
1–1 |
0.081–0.152 |
0.277–0.370 |
1.2–1.4 |
|
Fatty acids (2 bins) |
1.4–1.8 |
0.041–0.069 |
0.263–0.265 |
1.8–1.9 |
|
Formate |
0.5 |
0.112 |
0.316 |
-3.1 |
|
Fumarate |
0 |
1 |
1.000 |
3.4 |
|
Glucose (2 bins) |
0.8–1.1 |
0.069–0.296 |
0.265–0.580 |
-1.9–5.6 |
|
Glutamate | Alanine | Lysine | Arginine | Glucose | Glycerol |
1.4 |
0.024 |
0.263 |
1.5 |
|
Glutamate | Methionine |
1.2 |
0.081 |
0.277 |
1.6 |
|
Glutamine (2 bins) |
0.7–0.8 |
0.081–0.095 |
0.277–0.281 |
1.9–2.1 |
|
Glycerol |
1.1 |
0.049 |
0.263 |
1.5 |
|
Histidine | Methylmalonate |
0.5 |
0.041 |
0.263 |
1.5 |
|
Inosine |
0.5 |
0.058 |
0.263 |
-1.4 |
|
Lactate | Proline |
1.3 |
0.152 |
0.370 |
1.4 |
|
Lactate | Threonine | Unknown |
3.9 |
0.176 |
0.414 |
-1.3 |
|
Leucine |
1.1 |
0.049 |
0.263 |
2.1 |
|
Leucine | Isoleucine |
2.2 |
0.014 |
0.263 |
2.1 |
|
Leucine | Lysine | Arginine (2 bins) |
1–1.3 |
0.058–0.081 |
0.263–0.277 |
1.6–1.9 |
|
Lysine |
0.8 |
0.041 |
0.263 |
2.7 |
|
Methionine |
0.5 |
0.058 |
0.263 |
2 |
|
Methylmalonate (2 bins) |
1.7–1.8 |
0.007–0.012 |
0.247–0.247 |
2–2.4 |
|
Overlapped (15 bins) |
0.2–1.6 |
0.01–0.267 |
0.247–0.529 |
-2.2–4.6 |
|
Proline (2 bins) |
1.1–1.2 |
0.008–0.012 |
0.247–0.247 |
1.7–2.4 |
|
Proline | Glutamate | N-Acetyl amino acids |
2.1 |
0.095 |
0.281 |
1.5 |
|
Propylene Glycol |
0.8 |
0.058 |
0.263 |
1.5 |
|
Sarcosine |
1.1 |
0.069 |
0.265 |
1.9 |
|
Serine | Asparagine | Unknown |
1.1 |
0.095 |
0.281 |
1.6 |
|
Taurine | Glucose | Betaine | TMAO | myo-Inositol | Unknown |
4.2 |
0.029 |
0.263 |
-3.2 |
|
Tyrosine | Unknown |
2.8 |
0.058 |
0.263 |
-4.7 |
|
UDP-N-Acetylglucosamine |
1.2 |
0.029 |
0.263 |
-2.4 |
|
Unknown (4 bins) |
1–5 |
0.017–0.203 |
0.263v0.443 |
-6.7–-1.1 |
|
Unsaturated lipids |
1.4 |
0.119 |
0.332 |
2.5 |
|
VLDL | LDL |
3.6 |
0.095 |
0.281 |
2.4 |
|
VLDL | LDL | HDL (8 bins) |
0.6–2.6 |
0.008–0.13 |
0.247–0.333 |
2–4.4 |
|
Valine |
1.1 |
0.069 |
0.265 |
1.8 |
|
Valine | 3-Hydroxybutyrate |
0.9 |
0.029 |
0.263 |
1.4 |
|
Valine | Isoleucine | Leucine |
1.4 |
0.049 |
0.263 |
1.9 |
|
Important bins (VIP ≥1.0, -OR- fold change magnitude ≥2 -OR- p-value <0.10) differentiating library-matched metabolites identified from comparisons of control breast tissue samples only (mammoplasty-normal vs mammoplasty-with fibrocystic changes and mammoplasty-with fibroadenoma), corresponding to Figure 1A. SIMCA software was used for multivariate analysis to generate OPLA-DA plots, from which VIP scores (≥1) were extracted and exported to Excel. The p-value, False Discovery Rate (FDR) p-value and fold change were calculated using the Wilcoxon Rank Sum Test*. Directionality is based on having a positive fold change, which indicates that the median metabolite level in mammoplasty-normal samples > median in mammoplasty-with fibrocystic changes plus mammoplasty-with fibroadenoma samples**. Metabolite identification or annotation is based on Chenomx library of standards and lipids were matched using literature. Peaks in NMR bins may contain one or more metabolite(s) and one metabolite can span across multiple bins. NMR bins labeled as “Overlapped” could not be assigned to metabolites distinctively using the NMR library, and further 2D experiments are needed for confirmed identification. The NMR signals that could not be matched to metabolites are labeled as “unknown”***. |
||||
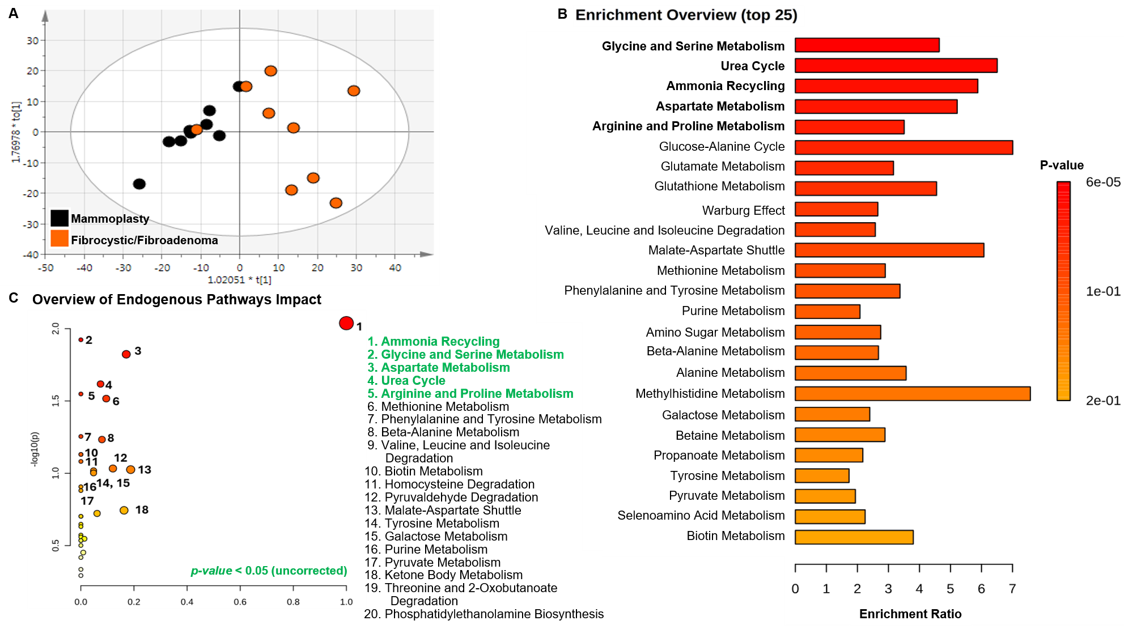
Figure 1. Comparisons of control mammoplasty-normal versus mammoplasty-with fibrocystic changes and mammoplasty-with fibroadenoma breast tissues. A. OPLS-DA multivariate plot demonstrating metabolic separation between control tissue samples from women who underwent reduction mammoplasty surgery versus women who underwent surgical removal of benign fibrocystic or non-malignant fibroadenoma breast lesions. Multivariate model statistics are R2X(cum) =0.599, R2Y(cum) =0.602, Q2 =0.629. B. Overview of metabolic enrichment analysis. C. Overview of significantly different endogenous pathways (p<0.05, unadjusted), where both B and C were analyzed by MetaboAnalyst. Corresponding PCA plot can be reviewed in Figure S2.
Metabolomic profiling distinguishes all controls from BCa biospecimens
Among the tissue cohort sample comparisons, 50 putatively identified, library-matched metabolites were identified as important for differentiating all biospecimens categorized as controls (mammoplasty-normal vs mammoplasty-with fibrocystic changes and mammoplasty-with fibroadenoma) from women with BCa across all stages and grades analyzed (Table 3). These metabolites correspond to the OPLS-DA plot in Figure 2A, in which all breast tissue controls are represented by black dots and all BCa tissues are represented by pink dots. In this preliminary comparison, nine of the 25 top enriched biological pathways (Figure 2B) aligned with the same significantly (p<0.50, unadjusted) differential perturbed endogenous pathway perturbations (Figure 2C). These included alterations in pathways involved in Carnitine Synthesis, Phosphatidylethanolamine Biosynthesis, Methionine Metabolism, Ammonia Recycling, Phospholipid Biosynthesis, Arginine and Proline Metabolism, Betaine Metabolism, Phosphatidylcholine Biosynthesis and Glycine and Serine Metabolism.
|
Library-Matched Metabolites*** |
VIP |
p-value* |
FDR p-value |
Fold Change** |
|
2-Phenylpropionate |
1.5 |
0.991 |
0.995 |
1 |
|
4-Hydroxybenzoate |
1 |
0.142 |
0.568 |
2 |
|
Acetate | Lysine | Arginine |
3.2 |
0.033 |
0.415 |
2.3 |
|
Aspartate | Dimethylamine |
0.9 |
0.093 |
0.519 |
-1.2 |
|
Carnitine| Choline | O-Phosphocholine | O-Acetylcholine | sn-Glycero-3-phosphocholine |
3.5 |
<.001† |
0.033 |
-2.1 |
|
Creatine | Creatinine | Lysine |
1 |
0.102 |
0.542 |
-1.3 |
|
Creatine | Tyrosine (2 bins) |
1–1.4 |
0.041–0.044 |
0.436–0.442 |
-1.2–1.2 |
|
Ethanolamine |
0.9 |
0.084 |
0.519 |
-1.3 |
|
Ethanolamine | Glucose |
1.3 |
0.069 |
0.519 |
-1.3 |
|
Fatty acids |
1.1 |
0.491 |
0.760 |
1.1 |
|
Glucose | Taurine | Proline |
1.5 |
0.019 |
0.334 |
-1.6 |
|
Glutamate |
1.9 |
<.001† |
0.033 |
-1.6 |
|
Glutamate | Alanine | Lysine | Arginine | Glucose | Glycerol |
2.2 |
0.001 |
0.078 |
-1.4 |
|
Glutamate | Methionine |
1.6 |
0.01 |
0.263 |
-1.3 |
|
Glutamate | Succinate |
0.9 |
0.038 |
0.437 |
-1.3 |
|
Glutamine |
0.9 |
0.056 |
0.519 |
-1.3 |
|
Glutathione |
0.7 |
0.069 |
0.519 |
-1.3 |
|
Glycine | Glucose | Glycerol |
1.7 |
0.031 |
0.409 |
-1.2 |
|
Inosine |
1.8 |
0.081 |
0.519 |
3.9 |
|
Inosine | Adenosine |
0.4 |
0.023 |
0.374 |
-3.5 |
|
Lactate | Proline |
3.4 |
<.001† |
0.003 |
-2.1 |
|
Lactate | Threonine | Unknown |
4.7 |
0.089 |
0.519 |
-1.3 |
|
Leucine | Isoleucine |
1.7 |
0.162 |
0.589 |
-1.2 |
|
Maltose | Sucrose |
0.4 |
0.009 |
0.262 |
-3.5 |
|
myo-Inositol | Valine |
1.1 |
0.014 |
0.293 |
-1.2 |
|
Overlapped (8 bins) |
0.1–2.3 |
0.013–0.139 |
0.293–0.566 |
-19.5–3.8 |
|
Proline | Glutamate | N-Acetyl amino acids |
1.5 |
0.256 |
0.645 |
-1.1 |
|
Proline | Methanol |
2.8 |
0.197 |
0.607 |
1.6 |
|
Serine | Asparagine | Unknown |
1.9 |
0.008 |
0.262 |
-1.5 |
|
Taurine | Glucose | Betaine | TMAO | myo-Inositol | Unknown |
2.9 |
0.266 |
0.645 |
1.5 |
|
Tyrosine | Unknown |
2.2 |
0.155 |
0.586 |
2 |
|
UDP-N-Acetylglucosamine (2 bins) |
0.1–0.2 |
0.026–0.204 |
0.395–0.606 |
-19.6–2.9 |
|
Unknown (6 bins) |
0.1–3.9 |
0.017–0.206 |
0.332–0.607 |
-3.6–2.4 |
|
Uracil |
0.2 |
0.09 |
0.519 |
-7.6 |
|
Uridine |
0.4 |
0.007 |
0.262 |
-3.7 |
|
Valine | Isoleucine | Leucine |
1.1 |
0.179 |
0.607 |
-1.2 |
|
VLDL | LDL | HDL |
1.3 |
0.815 |
0.926 |
1 |
|
Important bins (VIP ≥1.0, -OR- fold change magnitude ≥2 -OR- p-value <0.10) differentiating library-matched metabolites were identified from grouping all controls (mammoplasty-normal vs mammoplasty-with fibrocystic changes and mammoplasty-with fibroadenoma) and comparing them with all stages and grades of BCa (Figure 2A). This comparison generated distinct patterns of metabolomic separation, and the metabolites contributing to group discrimination are listed in the table. SIMCA software was used for multivariate analysis to generate OPLA-DA plots, from which VIP scores (≥1) were extracted and exported to Excel. p-value and fold changes were calculated using a t-test assuming unequal variances*. P-values identified with a † have an FDR-corrected p-value <0.05. Directionality is based on having a positive fold change, which indicates that the median metabolite level in combined control mammoplasty tissues was > mean metabolite in BCa tissues**. Metabolite identification or annotation is based on Chenomx library of standards and lipids were matched using literature. Peaks in NMR bins may contain one or more metabolite(s) and one metabolite can span across multiple bins. NMR bins labeled as “Overlapped” could not be assigned to metabolites distinctively using the NMR library, and further 2D experiments are needed for confirmed identification. The NMR signals that could not be matched to metabolites are labeled as “unknown”***. |
||||
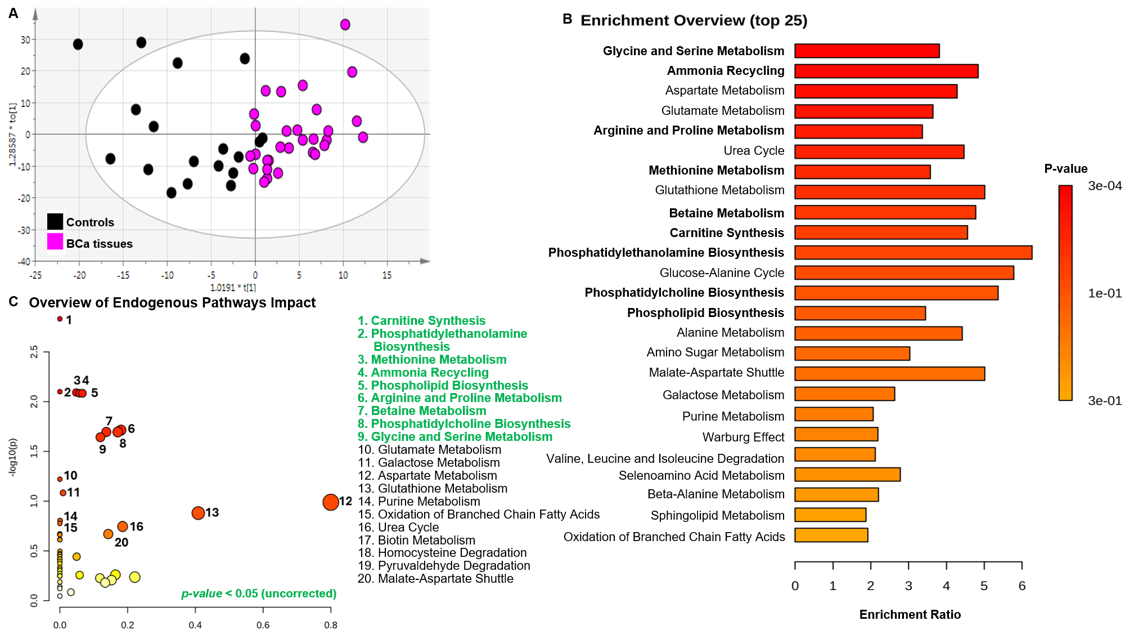
Figure 2. Comparisons of all controls combined (mammoplasty-normal vs mammoplasty-with fibrocystic changes and mammoplasty-with fibroadenoma) versus BCa tissues. A. OPLS-DA multivariate plots demonstrating metabolic separation between all tissue controls compared to tissues from women with BCa (stages I–IV and grades I–III), with multivariate model statistics of R2X(cum) =0.743, R2Y(cum) =0.605, Q2 =0.351. B. Overview of metabolic enrichment analysis. C. Summary of significantly altered endogenous pathways (p<0.05, unadjusted). Analyses presented in B and C were performed using MetaboAnalyst. Corresponding PCA plot containing all study samples can be reviewed in Figure S1, also containing study Pool QC samples denoted by grey dots and red arrows demonstrates low analytical variation.
Metabolites that distinguish histological groups of BCa correlate with BCa risk factors
Having the opportunity to work with biospecimens from an understudied population using metabolomics, we were interested in several other comparative differences and new hypotheses the analytical method might reveal in the exploratory dataset. Since the OPLS-DA scores plot showed a differentiation between the mammoplasty-with fibrocystic changes and mammoplasty-with fibroadenoma samples and mammoplasty-normal BCa samples (Figure 1 and Table 2), we decided to use only the mammoplasty-normal samples in all subsequent analyses as the reference control. The level of biological heterogeneity among control group samples might have diminished detectable differences between comparisons with smaller sample size numbers in the subgroups, that we present in the remaining results.
In the next multivariate comparison between mammoplasty-normal control tissues versus grade (G) I-II BCa samples, the OPLS-DA plot in Figure 3A demonstrates clear separation for nearly all control samples from BCa cases. Interestingly, one control tissue clusters more closely with the cancer cases along the primary component (t[1]) of the OPLS-DA model, suggesting the possibility of a more subtle, progression-related metabolic shift and warrants further investigation. The importance of such future analysis will be discussed in the next section. Figure 3B shows less pronounced separation between control mammoplasty-normal tissues and grade three (GIII) BCa samples. In both panels of Figure 3, additional stratification is provided by coloring the GI–II BCa samples according to estrogen receptor (ER) status, where GI-II, ER+ samples are indicated by blue dots and GI-II, ER- samples are indicated by pink dots (Figure 3A). Likewise, GIII, ER+ samples are indicated by turquoise dots, while GIII, ER- samples are indicated by dark green spots (Figure 3B). In both pairwise comparisons, the mammoplasty-normal control samples are presented as black dots. Distinct metabolic signatures were again identified by multivariate analysis and best visualized in the Venn diagram (Figure 3C), where three metabolites separate early-grade BCa (GI–II), and ten metabolites uniquely separate later-grade disease (GIII) relative to the normal reference control. Supplementary Table S3 provides the full list of all cross-sectional grade-related metabolite differences. Metabolites that are unique to specific comparisons are highlighted in bold and shown in blue font in the table.
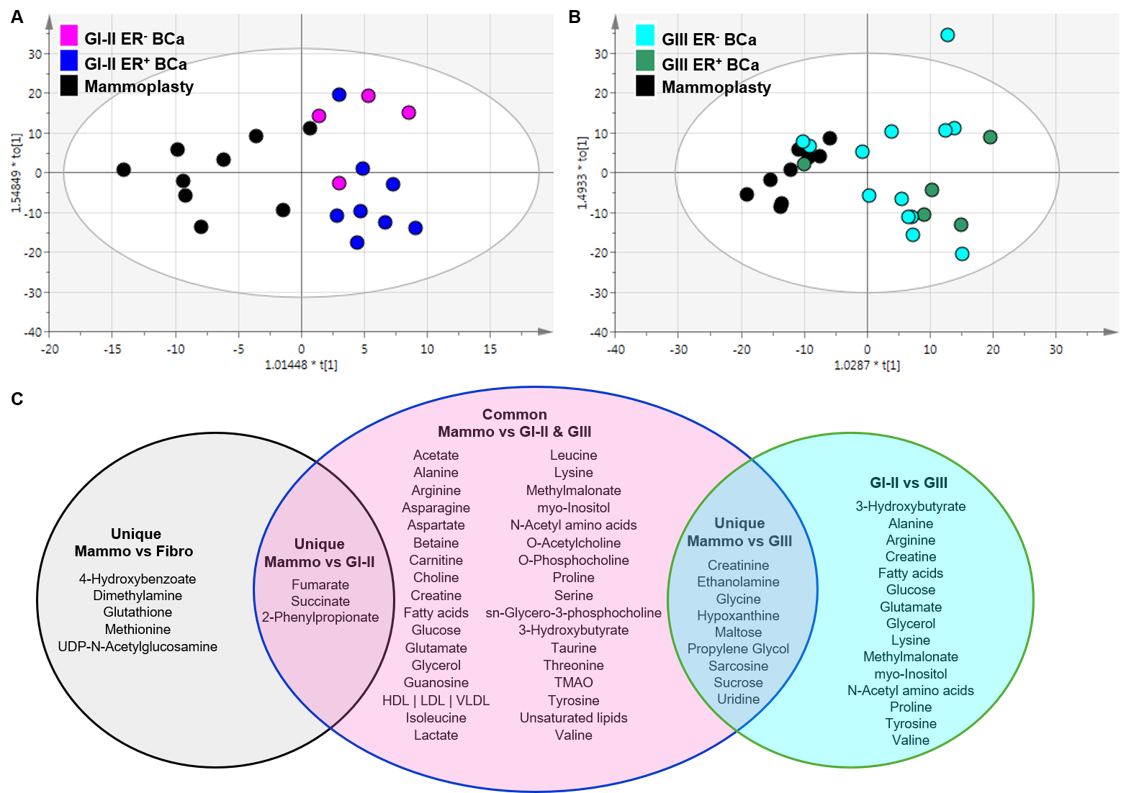
Figure 3. OPLS-DA plot comparisons of control mammoplasty-normal versus BCa tissues across clinical grade. A. Mammoplasty-normal versus GI-II BCa tissues in a pair-wise comparison, where the BCa tissues are different colors just to show how they naturally separate in multivariate space by estrogen receptor (ER) status. Multivariate model statistics are R2X(cum) = 0.604, R2Y(cum) = 0.611, Q2 = 0.041. B. Mammoplasty-normal versus GIII BCa tissues, again where BCa tissues represent one comparison group, but are colored differently to show whether the samples separate by ER status. Multivariate model statistics are R2X(cum) = 0.711, R2Y(cum) =0.699, Q2 =-0.477. Corresponding PCA plots can be viewed in Figure S3 for A. and Figure S4 for B. C. Venn diagram of the common and unique metabolites between these individual analyses. Three were GI-II–specific and ten were GIII–specific.
Several unique metabolites also distinguished ER+ from ER- tissues in both GI-II (Figure 4A) and GIII (Figure 4B) comparisons, where ER status (positivity or negativity) was used for pairwise stratification. Among the metabolites common to both comparisons, five exhibited opposite fold-change directions or magnitude when comparing GI-II to GIII. For example, the graph in Figure 4C shows that myo-inositol, lactate, and proline are elevated in ER- GI-II BCa samples and elevated at the later stage/grade GIII in ER+ tissues. In contrast, arginine and valine display a reciprocal pattern, being elevated in ER+ GI-II tissues, and elevated in ER- GIII BCa tissues. Thus, in ER+ tissues, myo-inositol, lactate, and proline are lower at the earlier GI-II stage of disease and increase in GIII tissues. Likewise, arginine and valine decreased from GI-II to GIII in ER+ BCa tissues. Conversely, for ER- tissues, myo-inositol, lactate, and proline decreased in comparisons between GI-II to GIII, while arginine and valine increased with advancing grade.
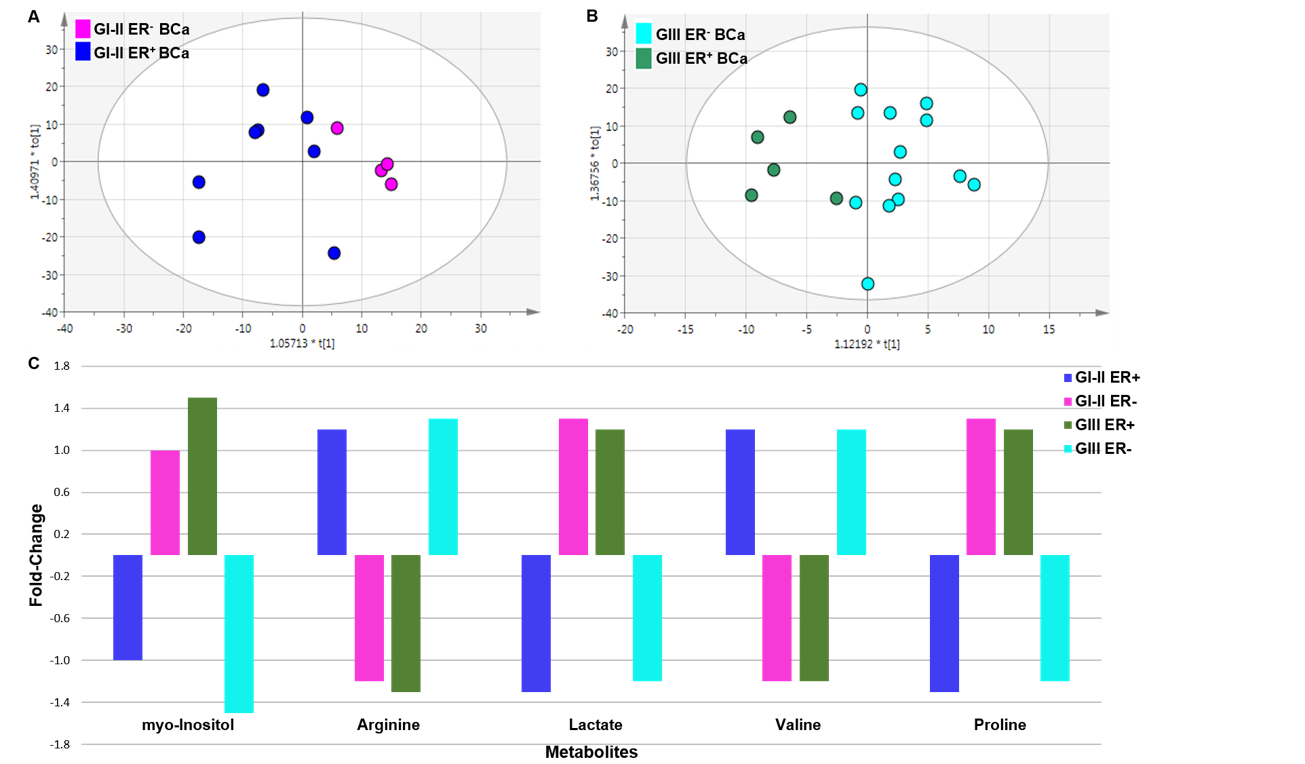
Figure 4. Comparison of BCa tissues based on estrogen receptor (ER) status. A. OPLS-DA plot of GI-II (ER- versus ER+). Multivariate model statistics are R2X(cum) = 0.503, R2Y(cum) = 0.565, Q2 = 0.255. The corresponding PCA plot can be viewed in Figure S5. B. OPLS-DA plot of GIII (ER- versus ER+) BCa tissues. Multivariate model statistics are R2X(cum) = 0.715, R2Y(cum) = 0.756, Q2 = 0.144. The corresponding PCA plot can be viewed in Figure S6. C. The graph illustrates differences among the most altered metabolites based on ER positivity, which have the potential to lead to the identification of subtype- or grade-specific biomarkers in AA women with BCa.
Next, to assess whether BMI was a key differentiating factor in this small cohort, we performed multivariate analysis in SIMCA across all tissue samples and observed a distinct separation pattern in the OPLS-DA plot. However, the model statistics were not strong (R2X(cum)=0.771, R2Y(cum) =0.542, Q2=-0.0889), and the negative Q2 indicated that the model was unlikely to be reproducible in a different dataset so we did not conduct any additional analyses related to BMI. Finally, to determine whether age served as a significant metabolic differentiator independent of BCa in AA women, we defined age thresholds at ≤54 years and 55 years to approximate pre- to peri-menopausal states compared to the post-menopausal state. In a likewise manner, the OPLS-DA multivariate model statistics (R2X(cum)=0.551, R2Y(cum)=0.291, and Q2=-0.45) also had a negative Q2 value and we report no further findings for either multivariate analysis. Although the plots demonstrated separation, as seen in Supplementary Figure S7, we believe that the limitation of small sample numbers overall and an imbalance across some groups comparisons (Supplementary Table 1) are in-part responsible for the poor statistical results in these comparisons, which have been shown in larger datasets to render statistically sound metabolomics data.
More robust secondary analyses using SPSS were performed to evaluate all NMR bins (Supplementary Table 2) in previous comparisons by multivariate analysis and for grade, ER status, BMI, age, and other clinical/pathological variables. Exact sample sizes were: mammoplasty-normal versus Grade I-II, 8 versus 12; mammoplasty-normal versus Grade III, 8 versus 18; Grade I-II ER-positive versus ER-negative, 8 versus 4; Grade III ER-positive versus ER-negative, 5 versus 13; BMI <30 versus ≥30, 18 versus 18; and age ≤54 versus≥55, 28 versus 20. Only two bins (b_89 and b_172) survived BH-FDR correction (p=0.000116 and 0.000202; q=0.0214 for each). Ten bins survived BH-FDR correction in the mammoplasty-normal versus Grade III comparison (minimum q=0.0385). No bin survived FDR in the Grade I-II, ER-status, BMI, or age comparisons. None of the 13 clinical/pathological variables had an association that survived BH-FDR correction. Subgroup findings, reported by multivariate analysis are therefore preliminary and should not be interpreted as validated progression, subtype, or risk-factor signatures. They do, however, provide justification to conduct a follow-up study in a larger cohort, to evaluate the subgroup pairwise comparisons and full study analysis with sufficient power. Currently, this study is underway, with planned enrollment of 300 cases and 300 controls.
Discussion
The primary finding from this investigation is our metabolomics analysis of control tissue biospecimens which represents the first report demonstrating metabolic differentiation among mammoplasty-normal compared to mammoplasty-with fibrocystic changes and mammoplasty-with fibroadenoma, by 1H-NMR spectroscopy in a cohort of AA women (Figure 1, Table 2). These observations, while preliminary, may point to biologically relevant metabolic changes that have the potential to predispose these benign/non-malignant lesions toward malignant changes. However, we are cautious with this new observation, because of the exploratory nature of this pilot study (n=8 versus n=9), and any such finding requires confirmation and validation in both larger and more diverse cohorts. Further investigation regarding the role differentiation of control reduction mammoplasty tissues has for interpreting data where samples with non-malignant changes are used as a reference for BCa remains to be seen.
A secondary observation, also based on multivariate analysis, is from the pairwise comparison between control mammoplasty-normal tissues versus GI-II breast tumor samples, where differentiation included the metabolite 2-phenylpropionate. Though our exploratory study was not adequately powered to evaluate significance, the finding is interesting and could be truly novel in BCa biology. Prior reports have only shown this metabolite as relevant in liver or urinary excreta involved in studies of Chinese natural product hepatotoxicity or long-term use of steroid medications (Figure 3, Table 3). Thus, the presence of 2-phenylpropionate being identified as important in distinguishing cases versus mammoplasty-normal controls also requires further validation studies to fully understand the role this metabolite may play in BC etiology or disease progression.
Beginning in the early 1990s, a significant shift occurred in the understanding of the relationship between benign breast conditions, such as fibrocystic disease and fibroadenoma disease, and subsequent risk of BCa. Earlier views, dating from the 1920s to the early 40s, suggested no association between these benign conditions and BCa risk compared with women without such diseases. This perspective evolved to recognize a modestly increased likelihood of carcinoma [58]; and later to evidence indicating a two- to fourfold elevated risk [59], particularly among women with a familial history of BCa in the preceding four decades. Notably, this shift in understanding was driven primarily by findings from pathological studies. Thus, conditions once considered entirely benign and unrelated to BCa development, were re-evaluated after accumulating experimental and epidemiological evidence alongside ongoing refinement in pathological classification, challenged this dogma [60–74]. These advances led to a more nuanced understanding, indicating no increased risk among women without a family history and/or in the absence of specific morphology-based pathological features.
In one of our previous investigations, we identified a significant epigenetic alteration characterized by elevated DNA methylation level in the P1 promoter region of ESRα (p=0.0001) in non-malignant fibroadenoma compared with ER-negative BCa tumors. In the same cohort of AA women, on which the metabolomics data presented herein are based, we also observed a two-fold increase in ESRα expression in both benign tissue types (fibrocystic and fibroadenoma) [75]. Even so, the literature remains inconsistent on this topic. It is therefore important to emphasize that the most common forms of fibrocystic breast changes typically observed in women between the ages of 30 and 50 years old, are not associated with an increased risk of developing BCa compared with women in the general population without such benign lesions, particularly in the absence of a family history of BCa or histological evidence of proliferative hyperplasia [76,77]. However, when uncertainty remains, the most appropriate course of action is to pursue diagnostic clarification, often through biopsy.
Only two prior studies reported findings using high-resolution liquid-chromatography coupled to mass-spectrometry (LC-MS). Hines et al, distinguished fibroadenoma from BCa in a total of six biospecimens [78], while Liu et al. more recently applied MS-based metabolomics to differentiate four TNBC samples from four fibroadenoma samples, in conjugation with microbiome profiles [79]. In a third study, Raman spectroscopy was used to define a biochemical fingerprint distinguishing breast phyllodes tumors from fibroadenomas [80]. Consistent with findings from the tissue- based MS studies, our data similarly suggest that glutathione level was higher in mammoplasty-normal tissue compared with the mammoplasty-with fibrocystic changes and mammoplasty-w fibroadenoma (Table 2).
In addition, in this pilot study we observed increased levels of glutathione, glutamine, carnitine, creatine, creatinine, choline, O-phosphocholine, O-acetylcholine, and sn-glycero-3-phosphocholine (Table 3), consistent with previous published findings from MS-studies in both tissue and serum comparing control and BCa samples. Our preliminary multivariate results demonstrate metabolic distinction between histologically normal breast tissues obtained from healthy women who underwent reduction mammoplasty surgery (n=8) and those from healthy women who had undergone surgery for benign fibrocystic disease or non-malignant fibroadenoma removal (n=9) (Figure 1A, Table 2), together with corresponding impacted endogenous biological pathways.
Although non-malignant, these lesions may be classified as non-proliferative or proliferative in nature and can exhibit obstructive features and morphological elements of noninvasive hyperplasia [59]. In a manner analogous to BCa, which is clinically characterized by six to seven genetically, molecularly, morphologically, and pathologically distinct subtypes, fibrocystic changes and fibroadenoma are also sub-divided into a spectrum of morphological and pathological variants. Accordingly, future technological and analytical advances may further refine our understanding of benign breast disease, potentially revealing a more complex elevated relationship with BCa etiology than is currently appreciated.
In our next analysis comparing phenotypic groups across all tissue types, (Figures 1A, 2A, 3A, and 3B), again distinct metabolic signatures emerged spanning mammoplasty-normal controls grouped with mammoplasty-w fibrocystic change and -w fibroadenoma controls, compared to BCa stratified by grade and stage (Supplementary Table S3) in discreet pairwise comparisons. These metabolites are most clearly illustrated in the Venn diagram (Figure 3C), which highlights several metabolites unique to each preliminary group comparison. For example, five metabolites were uniquely library-matched in Chenomx for the comparison differentiation between mammoplasty-normal controls and mammoplasty-w fibrocystic change and -w fibroadenoma, including 4-hydroxybenzoate, dimethylamine, glutathione, methionine, and UDP-N-acetylglucosamine. Because it is a pilot, it is fundamental to contextualize these findings within the literature, which substantiates that glutathione, a key determinant of cellular redox balance and detoxification capacity, may play a central role in regulating or reflecting the metabolic alterations observed in the other four metabolites, given its critical function in maintaining cellular homeostasis. It is also important to note that both 4-hydroxybenzoate and UDP-N-acetylglucosamine (UDP-GlcNAc) were likely elevated in mammoplasty-w fibrocystic changes and mammoplasty-w fibroadenoma tissues by approximately 2-to 3-fold (Table 2), whereas dimethylamine, glutathione and methionine were likely higher in the mammoplasty-normal tissues, with increases ranging from 1.6- to 2.4-fold compared with mammoplasty-w fibrocystic changes and mammoplasty-w fibroadenoma lesions.
Again, because our results are based on multivariate analysis findings in this small exploratory cohort, we did a deeper review of the literature to seek possible interpretation of the observed, putatively annotated spectral regions that matched to metabolites (Chenomx library) in the comparison between fully histologically normal breast tissue and those with benign breast diseases and found that 4-hydroxybenzoic acid esters belong to the class of compounds known as parabens. These compounds were established more than two decades ago to exhibit estrogenic activity and influence cell proliferation in BCa cellular models [81]. Despite improvements in environmental regulation of parabens to limit our vast exposure to these compounds because of their detrimental impacts on human health (i.e., genotoxicity and promoting cellular proliferation) [82], they are still used to some degree as a preservative in food products to increase shelf-life by blocking microbial growth, in cosmetics and pharmaceuticals, where benzyl-paraben compounds render some of the greatest toxic effects [83]. Downstream toxic metabolites from parabens and similar environmental exposures to compounds like polycyclic aromatic hydrocarbons (PAHs), which have also been linked to malignant initiation across several tissue types, all rely on glutathione and its associated transferases or GSTs for detoxification by the formation of glutathione conjugates for removal [83,84].
In a similar manner, the observed upregulation of UDP-GlcNAc in benign breast disease tissues, relative to normal reduction mammoplasty tissue, aligns with established evidence linking increased glucose flux and accumulation of glycolytic intermediates (i.e., UDP-sugars) to the metabolic reprogramming that supports high-energy demand states in malignant tissues, commonly described as the Warburg Effect [85]. Beyond glycolysis, UDP-GlcNAc may also contribute to increased synthesis of tumor-supportive extracellular matrix components, such as hyaluronan [86], thereby promoting a microenvironment that can facilitate pro-tumorigenic processes. Although not exclusive to any single comparison, both glutamine and glutamate emerged as important metabolites across all multivariate analyses and may be pointing to functioning in concert with glucose metabolism through glutaminyls and the hexosamine biosynthetic pathway. This activity has been shown to support synthesis through UDP-GlcNAc [87–90] as an alternative energy generating and biosynthetic route.
Finally, we propose and will test in future investigations, that the elevated glutathione observed in mammoplasty-normal breast tissue, identified as important in the discreet pairwise multivariate comparisons, could be reflecting a more robust detoxification capacity supporting cellular homeostasis. In contrast, this system comparatively diminished in mammoplasty-w fibrocystic changes and mammoplasty-w fibroadenoma tissues, which may suggest a shift away from the fully normal metabolic state observed in reduction mammoplasty-normal samples (Table 2). Though preliminary and needing further validation, this metabolic alteration was further supported by pathways analyses, where it emerged as a significantly perturbed endogenous pathway (unadjusted) in the non-discreet comparison grouping all control tissues versus all BCa tissues (Figures 2B and 2C).
In the 1990s, glutathione along with glutathione S-transferases (GSTs) and associated cytochrome P450 enzymes, acting in concert as a major antioxidant detoxification system, particularly in the liver, came to be understood in an increasingly complex light. Initially, considered as potential important determinants of breast tissue susceptibility to carcinogenic compounds (including chemotherapeutics) [91], they were subsequently linked to the regulation of key cancer hallmark, including the evasion of apoptosis and promotion of cellular proliferation [92]. Ultimately, these systems were recognized as major contributors to tumor-driven multi-drug resistance against chemotherapeutic agents and other xenobiotics [93]. From the 1990s to the present, a substantial body of evidence has accumulated detailing the roles of glutathione and its associated superfamily of enzymes across multiple malignancies, notably in BCa [32,94–100]. Collectively, this work nominally (until validation) underscores their broad involvement in virtually all major mechanistic hallmarks of cancer, further highlighting their central role in tumor biology and progression [85].
In analyses comparing all three types of control tissues with BCa tumor tissues (Figure 2A), a subset of control samples (black dots) clusters more closely with, and in some cases overlap, the BCa samples (pink dots) along the primary t[1] axis in the OPLS-DA multivariate plot. Beyond validation of this preliminary result in a larger cohort, future analyses will focus on delineating the metabolic differences among these more discreet sample subsets, with the possibility of identifying progression-specific metabolic phenotypes. Such insights may enable the development of more selective biomarkers that capture the transition from normalcy to benign disease and ultimately to malignancy. In addition, identification of these types of biomarkers could help refine early disease detection, complement imaging modalities, and support more precise characterization of disease onset prior to definitive diagnosis, staging, and grading through tissue biopsy. Additionally, three metabolites uniquely distinguished mammoplasty-normal from GI-II BCa tissues (Figure 3A), include the organic dicarboxylic acids fumarate and succinate. These metabolites are key intermediates of the citric acid cycle [101] and potentially point to the elevated energetic demands characteristic of tumor tissue relative to normal breast tissue. Notably, succinate has also been more recently implicated in anti-tumor immunity, where it has been shown to modulate mitochondrial function and influence CD8+ T-cell activity [102,103].
The third metabolite uniquely identified by library-matching in this group comparison was 2-phenylpropionate, for which no prior reports were found linking it to any type of breast tissue, either mammoplasty-normal or BCa tumors. However, two metabolomics-based studies have reported it in other biological contexts; where disruption of 2-phenylpropionate homeostasis was among four key metabolic perturbations associated with dose-dependent hepatotoxicity induced by the traditional Chinese medicine genipin [104]; and when examining the long-term effects of the glucocorticoid prednisone on gut mycobiome dysbiosis in a rat model [105], a positive correlation between levels of 2-phenylpropionate associated with fungal species. These reports are grounded in the observation that 2-phenylpropionate represents a key structural moiety within the compounds under investigation, such as genipin, or that it rises as an altered microbial metabolite associated with the metabolism of various fungal and bacterial species [105–108,]. This observation also supports our ongoing investigations into potential interactions between the gut microbiome and BCa etiology, in which dysbiosis may facilitate the translocation of microbe populations from the typically indolent gut microenvironment. Within this framework, such microbial shifts may plausibly acquire pathogenic potential and contribute to disease initiation and early progression [109–111].
In Figure 3B, mammoplasty-normal tissues were compared with GIII BCa tissues, yielding a more extensive list of nine unique metabolites that may reflect the hallmark of increased metabolic dysregulation with advancing disease. We want to highlight hypoxanthine and uridine for further discussion. The purine metabolite hypoxanthine was preliminarily observed to be elevated in GIII BCa samples, showing a 1.7-fold increase relative to mammoplasty-normal controls. In a case-control cohort of women from the United Arab Emirates, hypoxanthine was also identified as a significantly differential metabolite using MS-based metabolomics, and associated with disruptions in endocrine and immune-related metabolic pathways [112]. The same research group further reported its direct link in key hallmark mechanisms underlying BCa metastasis (i.e., upregulation of lipid metabolism in an ER+ cell line model) [113]. With respect to uridine in BCa progression [114], it has been associated previously with stemness in more advanced and aggressive TNBC cell lines [115], and has also been implicated in the promotion of a stem-like phenotype through stress-induced gut dysbiosis via LRP5/β-catenin signaling pathway [116].
Similar to findings from other metabolomics studies of BCa cell models, plasma, and tissue biospecimens, both the mammoplasty-normal versus GI-II (Figure 3A) and mammoplasty-normal versus GIII (Figure 3B) comparisons could be pointing to considerations that, although not exclusive to these groupings, low density lipoprotein (LDL) and very low-density lipoprotein (VLDL) levels were reduced in the BCa samples relative to controls. In the literature, lipoprotein changes have been suggested to be potentially protective against BCa risk [117] and reflect alterations in cancer related immunity processes, particularly in more aggressive GIII TNBC samples [118]. Collectively, these metabolites may therefore complement uniquely altered features as part of a broader biomarker panel for monitoring disease progression. Our preliminary results may help better understand what that biomarker panel will ultimately look like, after validation in larger and more diverse cohort investigations specifically designed to evaluate metabolic progression.
Pathway analysis across the comparison groups also revealed distinct differences, with Ammonia Recycling emerging as a significantly perturbed pathway (p= 0.02–0.008) in both the mammoplasty-normal versus mammoplasty-w fibrocystic change and mammoplasty-w fibroadenoma and the all controls grouped versus all BCa tissue comparisons. This pathway has previously been shown to facilitate tumor adaptation by enabling BCa cells and tissue to detoxify accumulated ammonia within the tumor microenvironment, while recycling it for amino acids synthesis. In this way, it supports enhanced cellular proliferation and increased biomass accumulation during tumor growth [119,120]. While preliminary and needing to be confirmed in larger cohort studies and with more robust statistical methods, the observed pathway changes typically reflect growth-supporting biosynthetic programs that are consistent with the increased biomass demands of proliferating cells. Notably, the metabolic process underlying the Warburg Effect, a fundamental hallmark of cancer metabolism, was also enriched in both comparisons, even though only the second analysis included BCa tumor tissues. This observation is interesting and clearly requires further investigation.
Limitations
We acknowledge that as an exploratory pilot, our study has five major limitations. Firstly, although intentionally designed to focus on women who self-identified as AA, ancestry was not further characterized or genetically confirmed using ancestry-informative markers. While this may be considered a limitation for certain statistical analyses, we contextualized our findings by comparing them with studies of similar objectives that employed the same metabolomics platform (1H NMR), in order to assess the generalizability of our results and determine whether observed metabolic patterns were specific to this cohort of women with disease. Secondly, participants were recruited primarily from the Washington, DC region in close proximity to Howard University, a community-based hospital serving a lower-resourced population within the metropolitan area. To help mitigate potential selection bias, we included participants recruited from a second clinical site, Providence Hospital, located approximately three miles northeast of Howard University, and about 15 minutes near the Washington DC-Maryland border. This additional recruitment site represented a distinct patient population with a different socioeconomic demographic of participants, thereby broadening the diversity of the cohort. Thirdly, our study was supported by pilot program funding, and the resulting sample size of tissue biospecimens, especially across subgroups, was limited, which constrains statistical power. In addition to the overall size of the cohort evaluated, there were also imbalances in the subgroups analyzed, which likely contributed to many metabolites falling out of significance (by unadjusted multivariate analyses) and resulting in no significant associations between specific metabolites and clinical/pathological parameters after BH-FDR correction was applied in secondary statistical analyses. Although larger cohorts will be necessary for full reproducibility and independent validation, metabolomics has been widely recognized as a highly sensitive analytical approach capable of detecting robust biochemical differences between distinct phenotypes, even in studies with relatively small sample size (e.g., n=5 per group) when evaluated using multivariate analytical framework [121–123]. Thus, we are confident in progressing toward validation of these findings in a larger cohort study and are currently conducting an observational trial at the Howard University Cancer Center. This study will include concordant biospecimens of plasma, urine, and tissue from an expanded cohort (n=300 cases and 300 controls). Fourthly, some of the corresponding metadata provided by the Tumor Registry were incomplete for certain variables used in statistical analyses. As a result, the total number of samples included in each model varied depending on the variability of complete metadata across comparative groups. Smoking status and alcohol use were the categories with the highest proportion of missing data. This is reflected in Table 1, where the totals for clinical and pathological variables do not always add up to the overall number of tissue samples (n=48). Lastly, results of this discovery study were based on binned NMR data. Although Chenomx software contains a pH sensitive experimental library of standards for library matching, the binning approach can result in more than one bin per metabolite or more than one metabolite in a bin. In addition, lipid annotations were based on the literature. Additional 2D and/ or multidimensional NMR experiments are needed to further confirm metabolite identity with confidence. In addition, findings of this study need to be confirmed by using a targeted metabolomics study using metabolite standards and calibration curves. Metabolite pathways found to be perturbed in this study can be interrogated by using metabolites in those pathways using a similar approach.
Conclusions
Our exploratory pilot study was designed to identify metabolites that distinguish between cases and controls and histological differences of BCa across stage and grade of disease. We identified several promising candidates that will serve as a starting point to identify associated proteins and enzymes related to metabolism that results in these metabolites after validation. Further, their identification allows for hypothesis development to discover potential targets that may serve as biomarkers for earlier detection of disease or to monitor disease progression in an understudied population, based on our exploratory cross-sectional grade findings. Our current results and ongoing research establish a path to achieving these goals. As presented findings derive from a pilot study, a targeted metabolomics approach could be used to confirm annotations, while further investigation in a larger cohort focused on AA women, as well as replication in more diverse populations, is required to determine whether the observed metabolite differences are specific to this group. This observational trial is underway. Currently, we are also conducting validation studies for enzymes related to the N-acetyl amino acid metabolites and testing them by immunohistochemistry in tissue microarrays representing over 200 BCa biospecimens from AA women with and without BCa. Ultimately, we hope to identify and develop clinically useful biomarkers for earlier detection of BCa, prior to confirmation by tissue biopsy, that can improve clinical care for all women with BCa; as well as identify ones that help explain metabolic contributions that result health disparate outcomes.
Abbreviations
The following abbreviations are used in this manuscript:
BCa: Breast Cancer; TNBC: Triple Negative Breast Cancer; AA: African American; CA: Caucasian; 1H NMR: Proton Nuclear Magnetic Resonance Spectroscopy; ER: Estrogen Receptor; PR: Progesterone Receptor; HER2: HER2/neu, Human Epidermal Growth Factor 2 Receptor; HUCC: Howard University Cancer Center; QC: Quality Control; Mammo: Mammoplasty; GI-II: Grade one to two; GIII: Grade Three; HDL: High Density Lipoprotein; LDL: Low Density Lipoprotein; VLDL: Very Low-Density Lipoprotein; TMAO: Trimethylamine N-oxide; MS: Mass Spectrometry
Conflicts of Interest
The authors declare they have no conflicts of interest.
Funding
Tissue samples were retrieved from Dr. Kanaan’s biorepository, established and maintained with funding support from the Howard University College of Medicine (U400042) Bridge Funds and the Pilot Study Awards Program (BFPSAP), as well as the NIH/NCI Howard/Hopkins Partnership (2U54 CA091431-06). Metabolomics data acquisition and analysis were funded by the NIH Common Fund Metabolomics Phase 1 program (U24DK097193, Sumner PI), and NC State Funds to the Sumner Lab at UNC Chapel Hill.
Author Contributions
Y.M.K., R.L.C. and T.J.N. conceptualized the study. D.A.S., Y.M.K., R.L.C., T.J.N., R.L.D., L.R.S., V.T.F. and S.J.S. designed the study. Y.M.K., T.J.N., R.L.D., V.T.F., K.B., E.C-S. and D.A.B. coordinated the clinical studies for the collection and repository of biospecimens from cohorts of African American women at Howard University Hospital, Howard University Cancer Center, and Providence Hospital. D.A.S., L.B., W.W.P. and S.L.M. prepared samples, acquired the data and performed the preliminary analyses. L.B., D.A.B. and E.C-S. organized patient sample metadata. S.L.M. and L.R.S. performed metabolomics data and statistical analyses used to generate figures and tables. D.A.S., L.B. and W.W.P. reviewed and summarized results to draft the preliminary manuscript. D.A.S., L.R.S. and Y.K.M. completed the manuscript. Y.M.K and S.J.S. secured necessary funding for this project. All authors
Institutional Review Board Statement
The study was conducted in accordance with the Declaration of Helsinki and approved by the Institutional Review Boards at Howard University (IRB-12-CMED-39) and Providence Hospital (IRB-2014-0901).
Informed Consent Statement
Written informed consent was obtained from all participants enrolled in cohort studies, from whom fresh excess surgical breast tissue samples, as well as clinical and pathological data, were collected. The study protocols were approved by the Howard University IRB and Providence Hospital IRB.
Data Availability Statement
All raw and normalized metabolomics data, analytical parameters, and associated metadata supporting the conclusions of this study are publicly available through the NIH Common Fund Data Repository and Coordinating Center Metabolomics Workbench (http://www.metabolomicsworkbench.org/; Project ID PR000338; http://dx.doi.org/10.21228/M8X01N), breast tissue dataset (Study ID: ST000438).
Acknowledgments
The authors thank Mr. Zachery Acuff, Mr. Andrew Novohatny, and Mrs. Tammy Cavallo for their assistance with manuscript preparation.
References
2. Cunningham JE, Montero AJ, Garrett-Mayer E, Berkel HJ, Ely B. Racial differences in the incidence of breast cancer subtypes defined by combined histologic grade and hormone receptor status. Cancer Causes Control. 2010 Mar;21(3):399–409.
3. Samuel CA, Pinheiro LC, Reeder-Hayes KE, Walker JS, Corbie-Smith G, Fashaw SA, et al. To be young, Black, and living with breast cancer: a systematic review of health-related quality of life in young Black breast cancer survivors. Breast Cancer Res Treat. 2016 Nov;160(1):1–5.
4. Dunmore C, Plummer P, Regan G, Mattingly D, Jackson S, Millikan R. Re: race and differences in breast cancer survival in a managed care population. J Natl Cancer Inst. 2000 Oct 18;92(20):1690–1.
5. Greenlee RT, Murray T, Bolden S, Wingo PA. Cancer statistics, 2000. CA Cancer J Clin. 2000 Jan-Feb;50(1):7–33.
6. Lee JS, Lo PK, Fackler MJ, Argani P, Zhang Z, Garrett-Meyer E, et al. A comparative study of Korean with Caucasian breast cancer reveals frequency of methylation in multiple genes correlates with breast cancer in young, ER, PR-negative breast cancer in Korean women. Cancer Biol Ther. 2007 Jul;6(7):1114–20.
7. Smigal C, Jemal A, Ward E, Cokkinides V, Smith R, Howe HL, et al. Trends in breast cancer by race and ethnicity: update 2006. CA Cancer J Clin. 2006 May-Jun;56(3):168–83.
8. DeSantis CE, Siegel RL, Sauer AG, Miller KD, Fedewa SA, Alcaraz KI, et al. Cancer statistics for African Americans, 2016: Progress and opportunities in reducing racial disparities. CA Cancer J Clin. 2016 Jul;66(4):290–308.
9. DeSantis CE, Fedewa SA, Goding Sauer A, Kramer JL, Smith RA, Jemal A. Breast cancer statistics, 2015: Convergence of incidence rates between black and white women. CA Cancer J Clin. 2016 Jan-Feb;66(1):31–42.
10. National Cancer Institute. SEER cancer stat facts: female breast cancer [Internet]. Bethesda (MD): National Cancer Institute; [cited 2026 Oct 5]. Available from: https://seer.cancer.gov/statfacts/html/breast.html
11. Siegel RL, Miller KD, Jemal A. Cancer statistics, 2015. CA Cancer J Clin. 2015 Jan-Feb;65(1):5–29.
12. Siegel RL, Miller KD, Jemal A. Cancer statistics, 2016. CA Cancer J Clin. 2016 Jan-Feb;66(1):7–30.
13. Siegel RL, Kratzer TB, Giaquinto AN, Sung H, Jemal A. Cancer statistics, 2025. CA Cancer J Clin. 2025 Jan-Feb;75(1):10–45.
14. Saka AH, Giaquinto AN, McCullough LE, Tossas KY, Star J, Jemal A, et al. Cancer statistics for African American and Black people, 2025. CA Cancer J Clin. 2025 Mar-Apr;75(2):111–40.
15. Richard Nixon Presidential Library and Museum. White House Conference on Food, Nutrition and Health (White House Central Files: Staff Member and Office Files). Yorba Linda (CA): Richard Nixon Presidential Library and Museum; 1969.
16. Richard Nixon Presidential Library and Museum: White House Conference on Food, Nutrition, Health: Final report to the President. Washington: The White House; 1970.
17. The White House. Biden-Harris Administration national strategy on hunger, nutrition, and health. Washington, DC: The White House; 2022.
18. Beckmann MW, Niederacher D, Schnürch HG, Gusterson BA, Bender HG. Multistep carcinogenesis of breast cancer and tumour heterogeneity. J Mol Med (Berl). 1997 Jun;75(6):429–39.
19. Roylance R, Gorman P, Harris W, Liebmann R, Barnes D, Hanby A, et al. Comparative genomic hybridization of breast tumors stratified by histological grade reveals new insights into the biological progression of breast cancer. Cancer Res. 1999 Apr 1;59(7):1433–6.
20. Perou CM, Sørlie T, Eisen MB, van de Rijn M, Jeffrey SS, Rees CA, et al. Molecular portraits of human breast tumours. Nature. 2000 Aug 17;406(6797):747–52.
21. Dalgin GS, Alexe G, Scanfeld D, Tamayo P, Mesirov JP, Ganesan S, et al. Portraits of breast cancer progression. BMC Bioinformatics. 2007 Aug 6;8:291.
22. Dass SA, Tan KL, Selva Rajan R, Mokhtar NF, Mohd Adzmi ER, Wan Abdul Rahman WF, et al. Triple Negative Breast Cancer: A Review of Present and Future Diagnostic Modalities. Medicina (Kaunas). 2021 Jan 12;57(1):62.
23. Epp J, Rajapakshe R. Breast cancer risk predictions by birth cohort and ethnicity in a population-based screening mammography program. Br J Radiol. 2022 Aug 1;95(1136):20211388.
24. Ghanbarzadeh Dagheyan A, Molaei A, Obermeier R, Westwood A, Martinez A, Martinez Lorenzo JA. Preliminary Results of a New Auxiliary Mechatronic Near-Field Radar System to 3D Mammography for Early Detection of Breast Cancer. Sensors (Basel). 2018 Jan 25;18(2):342.
25. Seo M, Cho N, Bae MS, Koo HR, Kim WH, Lee SH, et al. Features of Undiagnosed Breast Cancers at Screening Breast MR Imaging and Potential Utility of Computer-Aided Evaluation. Korean J Radiol. 2016 Jan-Feb;17(1):59–68.
26. Bodewes FTH, van Asselt AA, Dorrius MD, Greuter MJW, de Bock GH. Mammographic breast density and the risk of breast cancer: A systematic review and meta-analysis. Breast. 2022 Dec;66:62–8.
27. Holder EX, Bigham Z, Nelson KP, Barnard ME, Palmer JR, Bertrand KA. Mammographic density and breast cancer risk among Black American women. Int J Cancer. 2025 Mar 15;156(6):1173–80.
28. Singh T, Khandelwal N, Singla V, Kumar D, Gupta M, Singh G, et al. Breast density in screening mammography in Indian population - Is it different from western population? Breast J. 2018 May;24(3):365–8.
29. Bleicher RJ. Timing and Delays in Breast Cancer Evaluation and Treatment. Ann Surg Oncol. 2018 Oct;25(10):2829–38.
30. Garnis C, Buys TP, Lam WL. Genetic alteration and gene expression modulation during cancer progression. Mol Cancer. 2004 Mar 22;3:9.
31. Kanaan YM, Sampey BP, Beyene D, Esnakula AK, Naab TJ, Ricks-Santi LJ, et al. Metabolic profile of triple-negative breast cancer in African-American women reveals potential biomarkers of aggressive disease. Cancer Genomics Proteomics. 2014 Nov-Dec;11(6):279–94.
32. Stewart DA, Winnike JH, McRitchie SL, Clark RF, Pathmasiri WW, Sumner SJ. Metabolomics Analysis of Hormone-Responsive and Triple-Negative Breast Cancer Cell Responses to Paclitaxel Identify Key Metabolic Differences. J Proteome Res. 2016 Sep 2;15(9):3225–40.
33. Ashwini K Esnakula TJN, Luisel J Ricks-Santi, Sylvia Dasi, Henry Paul Jr, Robert L DeWitty, Jr, et al. Metabolomic transmethylation profiling reveals differences in ER- compared to ER + breast cancer in African American Women. In: 101st Annual Meeting of United States and Canadian Academy of Pathology (USCAP); 2012 March 17-23; BC, Canada: Mod Pathol.
34. Esnakula AK, Naab T, Ricks-Santi LJ, Dasi S, Paul H, DeWitty RL, et al. Metabolomic Transmethylation Profiling Reveals Differences in ER- Compared to ER plus Breast Cancer in African-American Women. In: 101st Annual Meeting of United States and Canadian Academy of Pathology (USCAP) 2012 March 17-23 2012; Vancouver, BC, Canada. Mod Pathol. 2012 Feb;25:37A (Abstract#143).
35. Esnakula AK, Ricks-Santi LJ, Frederick WAI, DeWitty Jr RL, Kanaan Y. Metabolomic Profiling Reveals Increased Arginine Metabolism in ER- Breast Cancers from African American Women [abstract]. In: 102nd Annual Meeting of United States and Canadian Academy of Pathology (USCAP): 2013 March 2-6 2013; Baltimore, MD, USA. : Mod Pathol.
36. Esnakula AK, Ricks-Santi LJ, Frederick WAI, DeWitty Jr RL, Kanaan Y. Fumarate, an Oncometabolite is Elevated in ER-Breast Cancers from African American Women [abstract]. In: 102nd Annual Meeting of United States and Canadian Academy of Pathology (USCAP): 2013 March 2-6 2013; Baltimore, MD, USA. : Mod Pathol. Feb; 26:39A (Abstract#152); 2013.
37. Sun X, Stewart DA, Sandhu R, Kirk EL, Pathmasiri WW, McRitchie SL, et al. Correlated metabolomic, genomic, and histologic phenotypes in histologically normal breast tissue. PLoS One. 2018 Apr 18;13(4):e0193792.
38. Winnike JH, Stewart DA, Pathmasiri WW, McRitchie SL, Sumner SJ. Stable Isotope-Resolved Metabolomic Differences between Hormone-Responsive and Triple-Negative Breast Cancer Cell Lines. Int J Breast Cancer. 2018 Sep 30;2018:2063540.
39. Dupont WD, Page DL, Parl FF, Vnencak-Jones CL, Plummer WD Jr, Rados MS, et al. Long-term risk of breast cancer in women with fibroadenoma. N Engl J Med. 1994 Jul 7;331(1):10–5.
40. Asiago VM, Alvarado LZ, Shanaiah N, Gowda GA, Owusu-Sarfo K, Ballas RA,et al. Early detection of recurrent breast cancer using metabolite profiling. Cancer Res. 2010 Nov 1;70(21):8309–18.
41. Giskeødegård GF, Lundgren S, Sitter B, Fjøsne HE, Postma G, Buydens LM, et al. Lactate and glycine-potential MR biomarkers of prognosis in estrogen receptor-positive breast cancers. NMR Biomed. 2012 Nov;25(11):1271–9.
42. Lee A, Lam CW. Application of Metabolic Biomarkers in Breast Cancer: A Literature Review. Ann Lab Med. 2025 May 1;45(3):229–46.
43. Warburg O. Ueber die Wirkung von Wasserstoffperoxyd auf Krebszellen und auf embryonale Zellen [The effect of hydrogen peroxide on cancer cells and on embryonic cells]. Acta Unio Int Contra Cancrum. 1958;14(1):55–7.
44. Fiehn O, Kristal B, van Ommen B, Sumner LW, Sansone SA, Taylor C, et al. Establishing reporting standards for metabolomic and metabonomic studies: a call for participation. OMICS. 2006 Summer;10(2):158–63.
45. Beckonert O, Keun HC, Ebbels TM, Bundy J, Holmes E, Lindon JC, et al. Metabolic profiling, metabolomic and metabonomic procedures for NMR spectroscopy of urine, plasma, serum and tissue extracts. Nat Protoc. 2007;2(11):2692–703.
46. Sumner S, Snyder R, Burgess J, Myers C, Tyl R, Sloan C, Fennell T. Metabolomics in the assessment of chemical-induced reproductive and developmental outcomes using non-invasive biological fluids: application to the study of butylbenzyl phthalate. J Appl Toxicol. 2009 Nov;29(8):703–14.
47. Sumner SC, Fennell TR, Snyder RW, Taylor GF, Lewin AH. Distribution of carbon-14 labeled C60 ([14C]C60) in the pregnant and in the lactating dam and the effect of C60 exposure on the biochemical profile of urine. J Appl Toxicol. 2010 May;30(4):354–60.
48. Sumner SJ, Burgess JP, Snyder RW, Popp JA, Fennell TR. Metabolomics of urine for the assessment of microvesicular lipid accumulation in the liver following isoniazid exposure. Metabolomics. 2010 Jun 1;6(2):238–49.
49. Pathmasiri W, Pratt KJ, Collier DN, Lutes LD, McRitchie S, Sumner SC. Integrating metabolomic signatures and psychosocial parameters in responsivity to an immersion treatment model for adolescent obesity. Metabolomics. 2012 Dec;8(6):1037–51.
50. Church RJ, Wu H, Mosedale M, Sumner SJ, Pathmasiri W, Kurtz CL, et al. A systems biology approach utilizing a mouse diversity panel identifies genetic differences influencing isoniazid-induced microvesicular steatosis. Toxicol Sci. 2014 Aug 1;140(2):481–92.
51. Sumner SCJ PW, Carlson JE, McRitchie SL, and Fennell TR. Metabolomics. In: Edited by Hodgson, Robert C. Smart. Molecular and Biochemical Toxicology Volume In Press, 5th Edition edn. New York: J Wiley and Sons; 2016.
52. Bender R, Lange S. Adjusting for multiple testing--when and how? J Clin Epidemiol. 2001 Apr;54(4):343–9.
53. Xia J, Wishart DS. Web-based inference of biological patterns, functions and pathways from metabolomic data using MetaboAnalyst. Nat Protoc. 2011 Jun;6(6):743–60.
54. Pang Z, Lu Y, Zhou G, Hui F, Xu L, Viau C, et al. MetaboAnalyst 6.0: towards a unified platform for metabolomics data processing, analysis and interpretation. Nucleic Acids Res. 2024 Jul 5;52(W1):W398–W406.
55. DAVIS HH, SIMONS M, DAVIS JB. CYSTIC DISEASE OF THE BREAST: RELATIONSHIP TO CARCINOMA. Cancer. 1964 Aug;17:957–78.
56. Vorherr H. Fibrocystic breast disease: pathophysiology, pathomorphology, clinical picture, and management. Am J Obstet Gynecol. 1986 Jan;154(1):161–79.
57. Budai B, Számel I, Sulyok Z, Német M, Bak M, Ottó S, et al. Characteristics of cystic breast disease with special regard to breast cancer development. Anticancer Res. 2001 Jan-Feb;21(1B):749–52.
58. KARPAS CM, LEIS HP, OPPENHEIM A, MERSHEIMER WL. RELATIONSHIP OF FIBROCYSTIC DISEASE TO CARCINOMA OF THE BREAST. Ann Surg. 1965 Jul;162(1):1–8.
59. Murad TM, Swaid S, Pritchett P. Malignant and benign papillary lesions of the breast. Hum Pathol. 1977 Jul;8(4):379–90.
60. Shirley SE. Beyond fibrocystic disease. The evolving concept of pre-malignant breast disease. West Indian Med J. 1999 Dec;48(4):173–8.
61. Castells X, Domingo L, Corominas JM, Torá-Rocamora I, Quintana MJ, Baré M, et al. Breast cancer risk after diagnosis by screening mammography of nonproliferative or proliferative benign breast disease: a study from a population-based screening program. Breast Cancer Res Treat. 2015 Jan;149(1):237–44.
62. Cote ML, Ruterbusch JJ, Alosh B, Bandyopadhyay S, Kim E, Albashiti B, et al. Benign breast disease and the risk of subsequent breast cancer in African American women. Cancer Prev Res (Phila). 2012 Dec;5(12):1375–80.
63. Li W, Ray RM, Lampe JW, Lin MG, Gao DL, Wu C, et al. Dietary and other risk factors in women having fibrocystic breast conditions with and without concurrent breast cancer: a nested case-control study in Shanghai, China. Int J Cancer. 2005 Jul 20;115(6):981–93.
64. Louro J, Román M, Posso M, Comerma L, Vidal C, Saladié F, et al. Differences in breast cancer risk after benign breast disease by type of screening diagnosis. Breast. 2020 Dec;54:343–8.
65. Nassar A, Visscher DW, Degnim AC, Frank RD, Vierkant RA, Frost M, et al. Complex fibroadenoma and breast cancer risk: a Mayo Clinic Benign Breast Disease Cohort Study. Breast Cancer Res Treat. 2015 Sep;153(2):397–405.
66. Socolov D, Anghelache I, Ilea C, Socolov R, Carauleanu A. Benign breast disease and the risk of breast cancer in the next 15 years. Rev Med Chir Soc Med Nat Iasi. 2015 Jan-Mar;119(1):135–40.
67. Tice JA, O'Meara ES, Weaver DL, Vachon C, Ballard-Barbash R, Kerlikowske K. Benign breast disease, mammographic breast density, and the risk of breast cancer. J Natl Cancer Inst. 2013 Jul 17;105(14):1043–9.
68. Bhatt AA, Harper LK, Anderson S, Solanki MH, Ataya DK. Cystic Breast Disease: What to Do When It's Not So Cystic. J Breast Imaging. 2025 Mar 18;7(2):233–48.
69. Kumar N, Babu A, Singh S, Lakhera KK, Patel P, Gurjar B, et al. Patterns and Prevalence of Benign Breast Diseases: An Epidemiological Chart Review Analysis of 5965 Patients from North Western India. Indian J Surg Oncol. 2025 Oct;16(5):1264–9.
70. Malherbe K, Khan M, Fatima S: Fibrocystic Breast Disease. In: StatPearls. edn. Treasure Island (FL): StatPearls Publishing. 2025.
71. Sherman ME, Vierkant RA, Masters M, Radisky DC, Winham SJ, Degnim AC, et al. Benign Breast Disease, NSAIDs, and Postmenopausal Breast Cancer Risk in the CPS-II Cohort. Cancer Prev Res (Phila). 2023 Mar 1;16(3):175–84.
72. Dasi S, Naab TJ, Kwabi-Addo B, Apprey V, Beyene D, Dewitty RL Jr, et al. Methylation of ESRα Promoters in Benign Breast Tumors Could Be a Signature for Progression to Breast Cancer in African American Women. Cancer Genomics Proteomics. 2025 Mar-Apr;22(2):208–30.
73. DeMarco C. Breast cysts and breast cancer: How can you tell the difference? Cancerwise [Internet]. Houston (TX): UT MD Anderson Cancer Center; 2022 Sep 19 [cited 2026 Oct 5]. Available from: https://www.mdanderson.org/cancerwise/breast-cysts-and-breast-cancer--how-can-you-tell-the-difference.h00-159542901.html
74. Hartmann LC, Sellers TA, Frost MH, Lingle WL, Degnim AC, Ghosh K, et al. Benign breast disease and the risk of breast cancer. New England Journal of Medicine. 2005 Jul 21;353(3):229–37.
75. Hines KM, Ballard BR, Marshall DR, McLean JA. Structural mass spectrometry of tissue extracts to distinguish cancerous and non-cancerous breast diseases. Mol Biosyst. 2014 Nov;10(11):2827–37.
76. Liu J, Shi J, Zhang T, Chen M, Li Z, Lu C, et al. Serum and Fecal Metabolite Profiles Linking With Gut Microbiome in Triple-Negative Breast Cancer Patients. Breast Cancer (Auckl). 2024 Oct 5;18:11782234241285645.
77. Wu Y, Wang Y, He C, Wang Y, Ma J, Lin Y, et al. Precise diagnosis of breast phyllodes tumors using Raman spectroscopy: Biochemical fingerprint, tumor metabolism and possible mechanism. Anal Chim Acta. 2023 Dec 1;1283:341897.
78. Byford JR, Shaw LE, Drew MG, Pope GS, Sauer MJ, Darbre PD. Oestrogenic activity of parabens in MCF7 human breast cancer cells. J Steroid Biochem Mol Biol. 2002 Jan;80(1):49–60.
79. Finot F, Kaddour A, Morat L, Mouche I, Zaguia N, Cuceu C, et al. Genotoxic risk of ethyl-paraben could be related to telomere shortening. J Appl Toxicol. 2017 Jun;37(6):758–71.
80. Dagher Z, Borgie M, Magdalou J, Chahine R, Greige-Gerges H. p-Hydroxybenzoate esters metabolism in MCF7 breast cancer cells. Food Chem Toxicol. 2012 Nov;50(11):4109–14.
81. Merrick BA, Brooks AM, Foley JF, Mansfield BK, Selkirk JK. Translocation of benzo(a)pyrene reactive metabolites across human mammary epithelial cell membranes. PLoS One. 2025 Dec 3;20(12):e0337395.
82. Hanahan D, Weinberg RA. Hallmarks of cancer: the next generation. Cell. 2011 Mar 4;144(5):646–74.
83. Oikari S, Kettunen T, Tiainen S, Häyrinen J, Masarwah A, Sudah M, et al. UDP-sugar accumulation drives hyaluronan synthesis in breast cancer. Matrix Biol. 2018 Apr;67:63–74.
84. Newsholme P, Lima MM, Procopio J, Pithon-Curi TC, Doi SQ, Bazotte RB, et al. Glutamine and glutamate as vital metabolites. Braz J Med Biol Res. 2003 Feb;36(2):153–63.
85. Newsholme P, Procopio J, Lima MM, Pithon-Curi TC, Curi R. Glutamine and glutamate--their central role in cell metabolism and function. Cell Biochem Funct. 2003 Mar;21(1):1–9.
86. Tian Y, Du W, Cao S, Wu Y, Dong N, Wang Y, et al. Systematic analyses of glutamine and glutamate metabolisms across different cancer types. Chin J Cancer. 2017 Nov 7;36(1):88.
87. Wang L, Li JJ, Guo LY, Li P, Zhao Z, Zhou H, et al. Molecular link between glucose and glutamine consumption in cancer cells mediated by CtBP and SIRT4. Oncogenesis. 2018 Mar 13;7(3):26.
88. Subedi M, Bajaj S, Kumar MS, Yc M. An overview of tramadol and its usage in pain management and future perspective. Biomed Pharmacother. 2019 Mar;111:443–51.
89. Smyj R, Wang XP, Han F. Tramadol hydrochloride. Profiles Drug Subst Excip Relat Methodol. 2013;38:463–94.
90. Saeed I, La Caze A, Hollmann MW, Shaw PN, Parat MO. New Insights on Tramadol and Immunomodulation. Curr Oncol Rep. 2021 Aug 27;23(11):123.
91. Zhao Y, Zhang H, Yang Y, Chen WD, Wang YD. Monoaminylation in Human Health and Disease: State of the Field, Challenges, and Emerging Directions. Adv Sci (Weinh). 2026 Mar;13(16):e20653.
92. Tsikas D. Analysis, biology and significance of dimethylamine, trimethylamine and trimethylamine N-oxide in humans and in the marine ecosystem. J Chromatogr B Analyt Technol Biomed Life Sci. 2025 May 15;1258:124602.
93. Forrester LM, Hayes JD, Millis R, Barnes D, Harris AL, Schlager JJ, et al. Expression of glutathione S-transferases and cytochrome P450 in normal and tumor breast tissue. Carcinogenesis. 1990 Dec;11(12):2163–70.
94. Dabrosin C, Ollinger K, Ungerstedt U, Hammar M. Variability of glutathione levels in normal breast tissue and subcutaneous fat during the menstrual cycle: an in vivo study with microdialysis technique. J Clin Endocrinol Metab. 1997 May;82(5):1382–4.
95. Salinas AE, Wong MG. Glutathione S-transferases--a review. Curr Med Chem. 1999 Apr;6(4):279–309.
96. Fang J, Xu R, Cao Y, Zhao Z, Li W, Lin L, et al. Reduction-responsive RNAi nanoplatform for enhanced cancer sonoimmunotherapy via dual inhibition of mitophagy and Nrf2 pathways. Theranostics. 2025 Jul 11;15(16):7973–89.
97. Gamcsik MP. Detecting Glutathione and Related Antioxidants as Biomarkers in Patient Breast Tumor Tissues: An Update in the Age of Metabolomics. Oxid Med Cell Longev. 2025 Dec 10;2025:1811206.
98. Mehdi M, Menon MKC, Seyoum N, Bekele M, Tigeneh W, Seifu D. Blood and Tissue Enzymatic Activities of GDH and LDH, Index of Glutathione, and Oxidative Stress among Breast Cancer Patients Attending Referral Hospitals of Addis Ababa, Ethiopia: Hospital-Based Comparative Cross-Sectional Study. Oxid Med Cell Longev. 2018 Mar 26;2018:6039453.
99. Mohamed MM, Sabet S, Peng DF, Nouh MA, El-Shinawi M, El-Rifai W. Promoter hypermethylation and suppression of glutathione peroxidase 3 are associated with inflammatory breast carcinogenesis. Oxid Med Cell Longev. 2014;2014:787195.
100. Wang H, Yang F, Wu Y, Zhang Z, Zhang C. Targeting the miR-325-3p/GSTP1 axis overcomes paclitaxel resistance in triple-negative breast cancer by inducing ferroptosis. Genes Genomics. 2025 Oct;47(10):983–96.
101. Wang L, Wang Y, Liu C, Zhao Y. The USP8/CEP55/CHMP6 Axis Orchestrates Triple-Negative Breast Cancer Progression by Regulating Ferroptosis and Macrophage M2 Polarization. Clin Breast Cancer. 2026 Jan;26(1):317-329.e1.
102. Xu S, Yang SQ. Inhibition of IRE1α kinase increases ferroptosis resistance in triple-negative breast cancer cells. Oncol Lett. 2026 Feb 10;31(4):130.
103. Schatton D, Frezza C. Fumarate. Trends in Endocrinology & Metabolism. 2025 Jan 15;36(8):778–9.
104. Ma K, Cheng H, Wang L, Xiao H, Liu F, Yang Y, et al. Succinate preserves CD8+ T cell fitness to augment antitumor immunity. Immunity. 2025 Oct 14;58(10):2505-2523.e8
105. Xia Z, Li Z, Jiang P. Deciphering the antitumor immune effects of succinate. Trends Endocrinol Metab. 2026 Jan;37(1):1-3.
106. Lyu D, Zhang F, Qin J, Gao X, Zhang H, Wei Y. Targeted Metabolomics and Network Pharmacology to Screen Endogenous Biomarkers Indicating Dose-Dependent Liver Injury Induced by Genipin and the Mechanism Uncovered. Arch Pharm (Weinheim). 2025 Nov;358(11):e70134.
107. Li W, Shu Y, Zhang J, Wu M, Zhu GH, Huang WY, et al. Long-term prednisone treatment causes fungal microbiota dysbiosis and alters the ecological interaction between gut mycobiome and bacteriome in rats. Front Microbiol. 2023 Jun 5;14:1112767.
108. Chen CJ, Vijaya Krishna R, Tsai CC, Wu WH, Chao LK, Hwang KH, et al. Structure and functions of gamma-dodecalactone isolated from Antrodia camphorata for NK cell activation. Bioorg Med Chem. 2010 Sep 15;18(18):6896–904.
109. Mayer JM, Bartolucci C, Maître JM, Testa B. Metabolic chiral inversion of anti-inflammatory 2-arylpropionates: lack of reaction in liver homogenates, and study of methine proton acidity. Xenobiotica. 1988 May;18(5):533–43.
110. Shi X, Liu F, Bian Q. [Enantioseparation of 2-phenylcarboxylic acid esters by capillary gas chromatography]. Se Pu. 2016 Jan;34(1):85–8.
111. Shapira I, Sultan K, Lee A, Taioli E. Evolving concepts: how diet and the intestinal microbiome act as modulators of breast malignancy. Int Sch Res Notices. 2013;2013(1):693920.
112. Al-Ansari MM, AlMalki RH, Dahabiyeh LA, Abdel Rahman AM. Metabolomics-Microbiome Crosstalk in the Breast Cancer Microenvironment. Metabolites. 2021 Nov 4;11(11):758.
113. Thu MS, Chotirosniramit K, Nopsopon T, Hirankarn N, Pongpirul K. Human gut, breast, and oral microbiome in breast cancer: A systematic review and meta-analysis. Front Oncol. 2023 Mar 17;13:1144021.
114. Shakartalla SB, Bouzid A, Altaie AM, Ashmawy NS, Al Shareef ZM, Husseiny MI, et al. Hypoxanthine activates PI3K/AKT pathway and lipid metabolism, hallmarks in breast cancer metastasis. Med Oncol. 2025 Jun 16;42(7):263.
115. Yin J, Su Z, Hu X, Sun H, Sun Z, Zhou S, et al. CARM1-mediated hypoxanthine-enriched exosomes rewire inosine metabolism and impair CD8+ T cell antitumor function. Cell Death Differ. 2026 Aug;33(8):1667–84.
116. Liu K, Zhang S, Liu Y, Hu X, Gu X. Advancements in pseudouridine modifying enzyme and cancer. Front Cell Dev Biol. 2024 Dec 16;12:1465546.
117. Lu L, Xue L, Jiang S, He G, Deng X. The pseudouridine synthase PUS7 is associated with stemness and represents a potential therapeutic target in triple-negative breast cancer cells. Sci Rep. 2026 Jan 19;16(1):2411.
118. Cui B, Luo H, He B, Liu X, Lv D, Zhang X, et al. Gut dysbiosis conveys psychological stress to activate LRP5/β-catenin pathway promoting cancer stemness. Signal Transduct Target Ther. 2025 Mar 5;10(1):79.
119. Xiao J, Hao Y, Wu X, Zhao X, Xu B, Xiao C, et al. Nuclear magnetic resonance-determined lipoprotein profile and risk of breast cancer: a Mendelian randomization study. Breast Cancer Res Treat. 2023 Jul;200(1):115–26.
120. Tian Z, Rao Q, He Z, Zhao W, Chen L, Liu J, et al. Effect of 1 H-NMR serum lipoproteins on immunotherapy response in advanced triple-negative breast cancer patients. Cancer Sci. 2023 Oct;114(10):3924–34.
121. Spinelli JB, Yoon H, Ringel AE, Jeanfavre S, Clish CB, Haigis MC. Metabolic recycling of ammonia via glutamate dehydrogenase supports breast cancer biomass. Science. 2017 Nov 17;358(6365):941–46.
122. Shan M, Lyssiotis CA. When Cancer Cells Are Given Lemo[NH3]s, They Make Lemo[NH3]ade. Cell Metab. 2017 Dec 5;26(6):811–3.
123. Chen Y, Li EM, Xu LY. Guide to Metabolomics Analysis: A Bioinformatics Workflow. Metabolites. 2022 Apr 15;12(4):357.