Abstract
Background: As previous studies have demonstrated that heart failure (HF) verification is inconsistent, the use of administrative databases to predict heart failure (HF) readmission or all-cause mortality (ACM) requires HF verification. The Framingham Criteria for HF (CHF1 score>4) and European HF guidelines are algorithms that assesses symptoms, physical examination, radiologic findings, echocardiography and brain natriuretic peptide (BNP). We hypothesized that CHF1 score>4 or BNP>100 pg/ml (verifiable HF) will not occur in all patients but if present will predict HF readmission and ACM.
Methods: We queried the electronic medical record from a community-based practice for a HF diagnosis between 2008-2016. We included patients with >3 months follow-up with interpretable Doppler echocardiograms. We recorded demographics, Doppler-echo variables, CHF score>4, BNP, HF readmission, and ACM with follow-up up to 2113 days.
Results: HF phenotypes included preserved ejection fraction (271 patients), mid-range ejection fraction (224 patients), and reduced ejection fraction (144 patients). Verifiable HF varied from 56.9%-60.3%. Patients with verifiable HF had increased ACM for individual phenotypes (HR=2.22 to 3.40, p=0.0009 to <0.0001). Similarly, verifiable HF resulted in increased HF readmission during follow-up for individual phenotypes (HR=1.60-3.50, p=0.0158 to <0.0001). For patients previously readmitted, ACM was increased in patients with HFpEF, HFrEF, and all phenotypes combined despite CHF1 scores<4 and BNP<100 pg/ml.
Conclusions: Verifiable HF predicted ACM and HF readmission in all individual phenotypes. HF readmission also predicted subsequent ACM despite CHF1 scores<4 and BNP<100 pg/ml.
Keywords
Heart failure, Mortality, Readmission, Heart failure phenotypes
Abbreviations
A: Peak atrial velocity; ACM: All-Cause Mortality; BNP: Brain Natriuretic Peptide; CHF1 score: Framingham heart failure score at the time of study entry; E: Peak rapid filling velocity; e’: Peak mitral annular early diastolic velocity; HF: Heart Failure; HFmrEF: Heart Failure with mid-range Ejection Fraction; HFpEF: Heart Failure with preserved Ejection Fraction; HFrEF: Heart Failure with reduced Ejection Fraction; LV: Left Ventricular
Introduction
The use of administrative databases to determine predictors for heart failure (HF) readmission, cardiovascular, or all-cause mortality (ACM) requires HF coding that is verifiable. It is assumed that administrative databases have HF verified via coders based on physician documentation and additional criteria. Using HF as a diagnosis because it resides on a problem list had a 40% accuracy [1]. Using a decision tool to assess HF resulted in 49-56% of patients actually having HF [2]. Interestingly, in the presence of an implantable cardioverter-defibrillator only 44-55% had HF [3]. In another study, having a HF designation resulted in 65-70% having verifiable HF [4]. Clearly, the diagnosis of HF depends on the dataset examined (specialized HF service vs. no specialized HF service) and may not be well substantiated following chart review using a variety of diagnostic algorithms. This may be further exacerbated in institutions and rural areas without an organized heart failure service. Finally, the clinical diagnosis of HF has greater verification with the use of both clinical predictors and brain natriuretic peptide (BNP) measurements [5,6].
Variable HF algorithms have been used to verify the presence of HF. The Framingham Criteria for HF (CHF1 score >4) is one such algorithm that takes into account symptoms, physical examination, and radiologic findings but its development preceded the use of BNP [7]. BNP values >100 pg/ml have been used in the emergency room visits to determine if patients have HF in the BNP study [6]. Lower values have been utilized with the European guidelines using values >35 pg/ml along with clinical criteria to verify [8]. Furthermore, variations of the CHF1 score >4 and BNP are often used together to qualify patients for inclusion into HF studies [9,10]. Finally, Huusko [11] demonstrated in a large Finnish database that HF readmission was related to subsequent ACM. We hypothesized that in rural areas without an organized HF service, HF verification (CHF1 score >4 or BNP >100 pg/ml) will be met in <2/3rd of patients designated as HF; but if these criteria are met, they will be predictive of HF readmission and ACM across all HF phenotypes. Using a rural database derived from an area without an organized HF service, the goals of this study are (a) to determine the percentage of patients with verifiable HF for all phenotypes based on CHF1 scores >4 and BNP>100 pg/ml in a cohort of patients labelled as prevalent HF; (b) to determine whether CHF1 scores >4 and BNP are predictive of HF readmission and ACM; and (c) to examine the relation of ACM to previous HF readmission for all phenotypes based on a CHF1 score >4 or BNP >100 pg/ml.
Methods
Patients
This study complies with the Declaration of Helsinki and received expedited approval by the Quillen College of Medicine Institutional Review Board. The Quillen College of Medicine clinical practice is contained in a single electronic medical record (Allscripts, Touchworks, Chicago, IL) and was queried for HF diagnosis using ICD-9 codes (428.xx), or previous HF admission or emergency department visit and therapy (intravenous diuretics). There were 898 patients with prevalent HF that were identified: HF admission (809 patients) or emergency room visit (89 cases). Exclusions included patients not followed at least 60 days (32 patients), having pericardial disease (3 patients), congenital heart disease (8 patients), moderate or greater aortic valve disease (16 patients), greater than mild primary mitral valve disease (18 patients), organic tricuspid valve disease (2 patients), or did not have an ejection fraction measured, reported or estimated by echocardiography or any other technique (180 patients). Consequently, 639 patients were included in the study and were followed for a time period of 60 days to a maximal time period of 2113 days (through October 1, 2016) with median of 1481 days.
A review of patient outpatient records was performed to determine the age, sex, and prevalence of coronary disease, previous myocardial infarction, diabetes, hypertension, and hyperlipidemia. All ECG’s were re-read. Height, weight, blood pressure, and heart rate at the time of the echocardiogram were recorded. Medications were reviewed at the time of 1st and subsequent visits to determine the use of angiotensin converting enzyme inhibitors, angiotensin receptor blockers, beta blockers, aldosterone antagonists, nitrates, hydralazine, diuretic, calcium channel blockers, digoxin and statins. Coronary disease was defined as having evidence of >50% lesion in any coronary artery by coronary angiography, abnormal myocardial perfusion scan, ECG criteria evidence of an old myocardial infarction [12] or evidence of myocardial infarction using the universal definition [13]. Diabetes was defined as a fasting glucose ≥ 126 mg%, post prandial blood glucose ≥ 200 mg%, hemoglobin A1C ≥ 6.5%, or taking anti-diabetic medications. Hypertension was defined as blood pressure >140/90 or taking anti-hypertensive medications. Hyperlipidemia was defined as total cholesterol >200 mg%, triglycerides >150 mg%, or taking lipid lowering medications. Chronic obstructive pulmonary disease was defined as dyspnea, chronic cough or sputum production with pulmonary function testing confirming the presence of persistent airflow limitation. Body mass index was calculated from each patient’s height and weight, and obesity was defined as a body mass index >30 kg/m2. Laboratory data was reviewed and median BNP, percentage of patients with BNP >100 pg/ml, mean hemoglobin, creatinine values, troponin I and total bilirubin were recorded. The prevalence of atrial fibrillation was determined by examining the EKG of each patient at each visit or hospitalization. Evidence of verifiable HF was determined using the Framingham HF criteria (Supplementary Table 1) requiring either 2 major criteria or 1 major and 2 minor criteria (CHF1 score>4) [7] or a BNP level >100 pg/ml.
Inpatient and outpatient records were examined to determine if patients were seen in the Emergency Department and treated with intravenous diuretics or readmitted for HF following the initial contact with the health care system. Medical records were assessed for each subsequent admission to determine if HF was the primary reason for admission based on CHF1 score >4 or BNP levels >100 pg/ml, and especially a response to decongestive therapy. ACM was determined from medical records, conversation with family, and examining obituaries and/or the national death index. Time from being 1st seen to HF readmission or ACM was determined.
Patients were assigned to HF phenotypic groups based on LV ejection fraction. LV ejection fraction ≥ 50% was termed HF with preserved ejection fraction (HFpEF, n=271). LV ejection fraction=40-49% was termed HF with mid-range ejection fraction (HFmrEF, n=224). LV ejection fraction <40% was termed HF with reduced ejection fraction (HFrEF, n=144).
Echocardiography
All images were digitally obtained from 3-5 (5 if atrial fibrillation) consecutive cardiac cycles using a Phillips iE33 (Cleveland, Ohio) with a 2.5 mHz broad band transducer (X5) at held end expiration. Doppler echocardiography was obtained from multiple ultrasonic windows to provide views of all cardiac chambers and valves. Transmitral pulsed Doppler was obtained from 1-2 × 1-2 mm sample volume placed at the tips of the mitral leaflets. Spectral tissue Doppler was obtained from the septal and lateral mitral annuli using a 5 × 5 mm pulsed Doppler sample volume.
Calculated echocardiographic parameters
All measurements were re-measured and are the average of 3-5 (5 if atrial fibrillation) consecutive cardiac cycles and were performed according to the recommendation of the American Society Echocardiography guidelines [14]. We calculated LV end diastolic and end systolic volumes (using Simpson’s rule), LV mass, and left atrial volumes and indexed these measures to body surface area. Ejection fraction was calculated as (LV end diastolic volume-LV end systolic volume) divided by LV end diastolic volume. End diastolic basal right ventricular basal dimension and tricuspid annular systolic plane excursion was measured as described by the American Society of Echocardiography guidelines [10].
From transmitral Doppler, peak rapid filling velocity (E), peak atrial filling velocity (A), E/A were obtained based on American Society of Echocardiography Guidelines [15]. Spectral Doppler of the septal and lateral mitral annulus were analyzed for the peak rapid lengthening velocity (e’) and averaged. The E/e’ was calculated [15]. Tricuspid regurgitation velocity was obtained from a CW transducer using multiple windows. Using the modified Bernoulli equation, right ventricular systolic pressure was estimated with the addition of an estimate of right atrial pressure based on American Society of Echocardiography recommendations [15,16].
Data were expressed as mean ± standard deviation for normally distributed continuous variables as determined by Kolmogorov-Smirnov test. For data that was not normally distributed, median and interquartile ranges were computed. Categorical data was expressed as a percentage of the group having that attribute. Differences between groups were determined using 1-way analysis of variance or analysis of variance on ranks. If the F value was <0.05, the differences between individual groups was determined by Dunn’s test. Differences in percentages among groups were determined using chi-square. Multivariate logistic regression was performed to determinate the independent correlates of HF verification (CHF1 score >4 or BNP >100 pg/ml) by incorporating all variables that differed with regard to presence of verifiable HF with p<0.1. Univariate and multivariate Cox proportional analysis was performed to determinate the predictors of ACM or HF. Based on univariate relation of variables with p<0.10 for HF readmission or ACM, multivariate analysis was utilized to assess the relation of the above chosen variables on ACM and HF. Adjusted Kaplan-Meier curves were constructed to determine hazard ratios for ACM or HF for each independent multivariate correlate. Log rank testing was performed to determine significance. Schoenfeld residuals were utilized to check the proportional hazards assumption. Receiver operating characteristic curves were constructed to determine the predictability of a CHF score >4 or BNP >100 pg/ml for predicting for HF readmission and ACM. Statistics were performed by Prism GraphPad (San Diego, CA) and SAS (Cary, NC).
Results
We defined verifiable HF as a CHF1 score>4 or BNP>100 pg/ml. For all phenotypes combined, the percentage of patients with a CHF1 score>4 or BNP>100 pg/ml was 58.5%. Tables 1 and 2 summarizes the results for demographics, medications, laboratory parameters, and Doppler-echo parameters for HF phenotypes. In patients with HFpEF (Table 1), the percentage of patients with verifiable HF was 57.9%. Patients with verifiable HF had a greater prevalence of atrial fibrillation, lower hemoglobin, higher creatinine, lower systolic blood pressure, greater LV mass index, more abnormal diastolic function indices (left atrial volume index, E/e’, E/A, tricuspid regurgitation velocity), larger right ventricular size, greater HF readmission, and ACM. In patients with HFmrEF (Table 1), the percentage of patients with verifiable HF was 60.3%. Patients with verifiable HF were older, had greater creatinine, higher total bilirubin, larger end diastolic LV volume and mass index, more abnormal diastolic function indices, reduced tricuspid annular plane systolic excursion, and greater HF readmission and ACM.
In patients with HFrEF (Table 2), verifiable HF was noted in 56.9%. Patients with verifiable HF were older, had a higher prevalence of atrial fibrillation, more elevated creatinine, total bilirubin, LV mass index, greater left atrial volume index, higher tricuspid regurgitation velocity and estimated right atrial pressure, greater RV size, increased HF readmission and ACM. For all phenotypes combined (Table 2), patients with verifiable HF were older, had a higher prevalence of atrial fibrillation, higher heart rate, more elevated creatinine, larger LV end diastolic volume and mass index, more abnormal diastolic function indices, greater right ventricular size and reduced performance, greater HF readmission, and greater ACM.
Table 3 summarizes the multiple logistic regression analysis for univariate and multivariate predictors for verifiable HF (CHF1 score >4 or BNP >100m pg/ml). For HFpEF, left atrial volume index, systolic blood pressure, atrial fibrillation, and creatinine were independent multivariate predictors for verifiable HF. For HFmrEF, LV end diastolic volume index, creatinine, atrial fibrillation, and left atrial volume index were multivariate independent predictors for verifiable HF. For HFrEF, total bilirubin and creatinine were multivariate independent predictors for verifiable HF. For all phenotypes combined, atrial fibrillation, creatinine, tricuspid regurgitation velocity, and E/e’ were independent predictors for verifiable HF. Age was only a univariate predictor for HFrEF and all phenotypes combined.
Figure 1 demonstrates Kaplan-Meier curves derived from the multivariate Cox proportional analysis for HF readmission for each phenotype by CHF1 score and BNP. All phenotypes individually and combined demonstrated increased subsequent HF readmission (hazard ratios varying between 1.60-3.50, p=0.0158 to p<0.0001) for CHF1 scores >4 or BNP >100 pg/ml. Figure 2 demonstrates Kaplan-Meier curves derived from the multivariate Cox proportional analysis for ACM for each phenotype by CHF1 score and BNP. All phenotypes individually and combined demonstrated increased ACM (hazard ratios varying from 2.22-3.40, p=0.0009 to p<0.0001) for CHF1 scores >4 or BNP >100 pg/ml. Figure 3 summarizes the results for individual phenotypes and all phenotypes combined with regard to eventual ACM based on prior HF readmission, CHF1 score and BNP. Previous HF readmission was associated with increased ACM in patients with HFpEF, HFrEF, and all phenotypes combined despite CHF1 score <4 and BNP <100 pg/ml. Similarly, ACM was also increased in all phenotypes combined and HFpEF based on HF readmission with CHF1 score >4 or BNP >100 pg/ml.
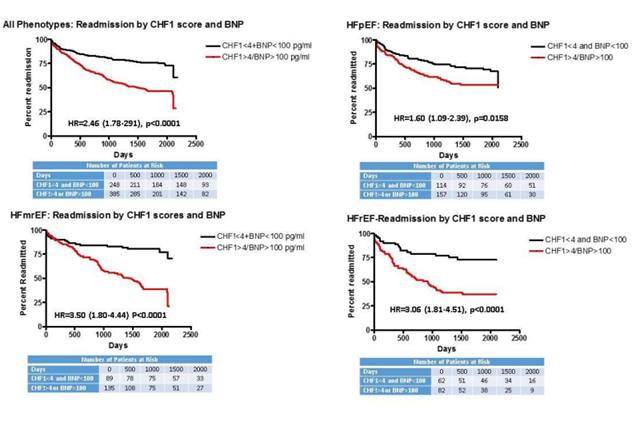
Figure 1: Readmission by CHF1 score and BNP: Kaplan Meier curves for heart failure readmission based on Framingham Heart Failure Score (CHF1) and brain natriuretic peptide level (BNP) level at study entry are plotted: upper left-all phenotypes; upper right-heart failure with preserved ejection fraction (HFpEF); lower left-heart failure with mid-range ejection fraction (HFmrEF); lower right-heart failure with reduced ejection fraction (HFrEF).
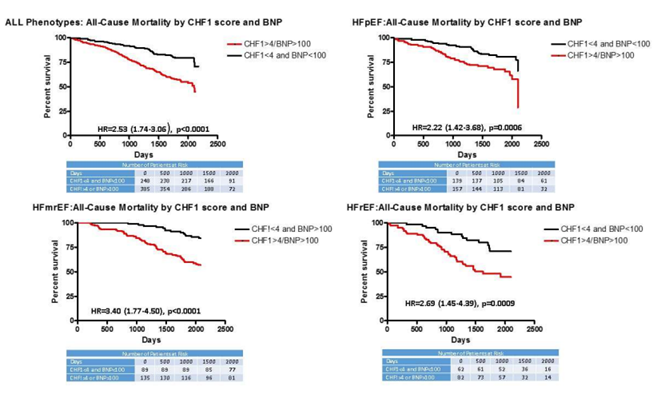
Figure 2. All-Cause Mortality by CHF1 score and BNP: Kaplan Meier curves for all-cause mortality based on CHF1 score and BNP level at study entry are plotted: upper left-for all phenotypes; upper right-HFpEF; lower left-HFmrEF; and lower right-HFrEF.
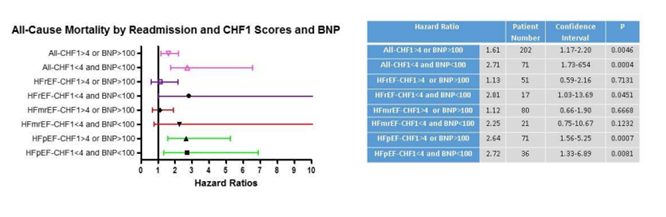
Figure 3: All-Cause Mortality by Readmission and CHF1 score and BNP: Forest plots for all-cause mortality based on previous readmission and CHF1 scores and BNP levels for all phenotypes combined, HFpEF, HFmrEF, and HFrEF are shown.
The results for receiver operating curves for prediction of ACM and HF readmission demonstrate modest predictability for ACM of a CHF1 score>4 or BNP>100 pg/ml (verifiable HF) for individual phenotypes and all phenotypes combined (Table 4a). Verifiable HF was associated with increased ACM for HFpEF (AUC=0.581, p=0.016), for HFmrEF (AUC=0.574, p=0.019, for HFrEF (AUC=0.575, p=0.029) and for all phenotypes combined (AUC=0.599, p<0.001). Table 4b demonstrates moderate predictability for HF readmission by verifiable HF for HFmrEF (AUC=0.708, p<0.001), for HFrEF (AUC=0.679, p<0.001) and for all phenotypes combined, (AUC=0.633, p<0.001).
|
|
HFpEF |
HFmrEF |
||
|
|
CHF1 score <4 and BNP <100 (n=114) |
CHF1 score >4 or BNP >100 (n=157) |
CHF1 score <4 and BNP <100 (n=89) |
CHF1 score>4 or BNP>100 (n=135) |
|
Age (years) |
63 ± 12 |
67 ± 11 |
72 ± 12 |
76 ± 11** |
|
Sex (M/F) |
75/39 |
90/67 |
32/57 |
67/68 |
|
Coronary Disease (%) |
55.2 |
59.9 |
64.0 |
72.5 |
|
Myocardial Infarction (%) |
21.0 |
30.0 |
33.7 |
34.8 |
|
Diabetes Mellitus (%) |
58.9 |
61.7 |
58.4 |
47.4 |
|
Hypertension (%) |
92.9 |
89.8 |
88.8 |
94.1 |
|
Hyperlipidemia (%) |
79.8 |
73.9 |
80.9 |
82.2 |
|
Atrial fibrillation (%) |
10.5 |
28.7** |
13.5 |
25.1* |
|
COPD (%) |
38.2 |
39.1 |
36.9 |
35.6 |
|
Obesity (%) |
60.8 |
64.6 |
42.2 |
42.6 |
|
ACEI/ARB (%) |
63.6 |
71.2 |
68.0 |
69.3 |
|
Beta Blockers (%) |
74.6 |
79.6 |
68.5 |
78.5 |
|
Aldosterone blocker (%) |
18.4 |
18.5 |
8.9 |
11.1 |
|
Nitrates/hydralazine (%) |
7.1 |
7.4 |
7.5 |
8.1 |
|
Digoxin (%) |
5.3 |
9.6 |
11.2 |
10.4 |
|
Hemoglobin (g/dl) |
13.3 ± 2.1 |
12.3 ± 2.2*** |
11.8 ± 1.9 |
12.4 ± 1.9 |
|
Creatinine (mg/dl) |
1.12 ± 0.54 |
1.39 ± 0.90** |
1.14 ± 0.48 |
1.72 ± 0.36*** |
|
Troponin I (ng/ml) |
0.88 ± 5.14 |
1.22 ± 4.05 |
0.09 ± 0.47 |
0.46 ± 2.64 |
|
Bilirubin (mg/dl) |
0.60 ± 0.35 |
0.65 ± 0.38 |
0.62 ± 0.36 |
0.74 ± 0.45* |
|
Systolic BP (mm Hg) |
137.4 ± 23.3 |
127.8 ± 22.4*** |
131.0 ± 23.2 |
125.7 ± 23.2 |
|
Heart Rate (beats/min) |
77.1 ± 14.4 |
79.3 ± 15.4 |
74.2 ± 13.0 |
75.9 ± 16.1 |
|
LVEDVI (ml/m2) |
51.3 ± 22.0 |
52.4 ± 19.6 |
57.5 ± 17.0 |
63.2 ± 25.0* |
|
Ejection Fraction (%) |
57.5 ± 3.1 |
56.0 ± 3.2 |
46.8 ± 2.2 |
46.6 ± 2.2 |
|
LV Mass Index (g/m2) |
95.8 ± 30.1 |
105.8 ± 30.7* |
94.2 ± 27.7 |
111.0 ± 33.7*** |
|
LAVI (ml/m2) |
29.0 ± 8.2 |
39.7 ± 13.6*** |
29.5 ± 12.8 |
38.8 ± 15.6*** |
|
E (cm/s) |
91.3 ± 26.9 |
106.8 ± 35.2*** |
93.8 ± 31.0 |
104.8 ± 32.5* |
|
E/A |
1.29 ± 0.48 |
1.32 ± 0.76* |
1.04 ± 0.40 |
1.49 ± 1.09*** |
|
E/e’ |
12.5 ± 4.4 |
13.9 ± 5.8* |
12.3 ± 4.6 |
16.0 ± 7.3**** |
|
SVI (ml/m2) |
34.4 ± 11.5 |
35.4 ± 15.3 |
37.4 ± 12.6 |
36.4 ± 14.1 |
|
TR velocity (m/s) |
2.63 ± 0.59 |
2.90 ± 0.57*** |
2.62 ± 0.54 |
3.01 ± 0.60*** |
|
RAP (mm Hg) |
5.8 ± 3.7 |
7.7 ± 4.6* |
6.2 ± 4.1 |
8.5 ± 4.9* |
|
TAPSE (mm) |
15.0 ± 6.1 |
13.6 ± 6.1 |
15.1 ± 5.2 |
12.7 ± 4.7** |
|
RV base (cm) |
3.5 ± 0.8 |
4.1 ± 0.9** |
3.8 ± 0.8 |
4.0 ± 0.8 |
|
Readmission (%) |
31.0 |
45.2* |
21.3 |
59.2*** |
|
All-cause mortality (%) |
20.1 |
31.2* |
15.7 |
42.9*** |
|
ACEI/ARB: Angiotensin Converting Enzyme Inhibitor/Angiotensin Receptor blocker; BP: Blood Pressure; BNP: Brain Natriuretic Peptide; CHF1: Framingham heart failure score; COPD: Chronic Obstructive Pulmonary Disease; E: Peak mitral filling velocity; E/A: E/Peak atrial filling velocity; E/e’: E/Peak average diastolic mitral annular velocity; HFpEF: Heart Failure with preserved Ejection Fraction; HFmrEF: Heart Failure with mid-range Ejection Fraction; LAVI: Left Atrial Volume Index; LVEDVI: LV End Diastolic Volume Index; RAP: Right Atrial; RV: Right Ventricular, SVI: Stroke Volume Index; TR: Tricuspid Regurgitation; TAPSE: Tricuspid Annular Plane Systolic Excursion; Statistics: *p<0.05, **p<0.01, ***p<0.001 vs. CHF1<4 and BNP<100 pg/ml. |
||||
|
|
HFrEF |
All Phenotypes |
||
|
|
CHF1 score <4 and BNP <100 (n=62) |
CHF1 score >4 or BNP >100 (n=82) |
CHF1 score <4 and BNP <100 (n=265) |
CHF1 score >4 or BNP >100 (n=374) |
|
Age (years) |
73 ± 17 |
79 ± 13** |
68 ± 14 |
73 ± 12*** |
|
Sex (M/F) |
30/32 |
42/40 |
102/146 |
181/204 |
|
Coronary Disease (%) |
51.6 |
58.5 |
57.6 |
63.1 |
|
Myocardial Infarction (%) |
22.6 |
23.1 |
25.8 |
29.9 |
|
Diabetes Mellitus (%) |
35.4 |
46.3 |
46.7 |
55.0* |
|
Hypertension (%) |
82.3 |
89.0 |
90.0 |
90.4 |
|
Hyperlipidemia (%) |
64.5 |
72.0 |
76.6 |
76.3 |
|
Atrial fibrillation (%) |
18.4 |
32.7* |
12.5 |
27.9** |
|
COPD (%) |
35.9 |
34.8 |
37.2 |
36.9 |
|
Obesity (%) |
32.7 |
34.1 |
47.1 |
49.6 |
|
ACEI/ARB (%) |
65.2 |
57.8 |
62.3 |
61.3 |
|
Beta Blockers (%) |
62.9 |
73.1 |
71.0 |
76.4 |
|
Aldosterone blocker (%) |
12.9 |
13.4 |
14.1 |
14.8 |
|
Nitrates/hydralazine (%) |
9.6 |
11.0 |
8.6 |
9.4 |
|
Digoxin (%) |
9.6 |
17.0 |
8.1 |
11.7 |
|
Hemoglobin (g/dl) |
12.9 ± 1.9 |
11.7 ± 2.0 |
12.7 ± 2.1 |
12.7 ± 2.5 |
|
Creatinine (mg/dl) |
1.01 ± 0.45 |
1.33 ± 0.86** |
1.19 ± 1.02 |
1.40 ± 1.17** |
|
Troponin I (ng/ml) |
0.59 ± 3.01 |
0.29 ± 1.49 |
0.20 ± 1.25 |
0.05 ± 0.09 |
|
Bilirubin (mg/dl) |
0.50 ± 0.19 |
0.64 ± 0.32** |
0.63 ± 0.55 |
0.85 ± 0.57 |
|
Systolic BP (mm Hg) |
126.9 ± 22.9 |
129.1 ± 24.7 |
132.2 ± 25.4 |
125.9 ± 21.9 |
|
Heart Rate (beats/min) |
77.7 ± 13.6 |
77.2 ± 11.6 |
77.8 ± 15.2 |
87.2 ± 21.9* |
|
LVEDVI (ml/m2) |
60.9 ± 16.7 |
65.0 ± 20.9 |
54.9 ± 19.5 |
61.8 ± 23.8** |
|
Ejection Fraction (%) |
35.1 ± 3.8 |
36.4 ± 4.1 |
48.9 ± 7.0 |
47.8 ± 7.6 |
|
LV Mass Index (g/m2) |
107.1 ± 25.4 |
128.6 ± 27.3** |
98.6 ± 28.9 |
113.4 ± 31.5*** |
|
LAVI (ml/m2) |
34.8 ± 17.0 |
40.3 ± 17.7* |
29.3 ± 13.2 |
38.2 ± 16.8*** |
|
E (cm/s) |
114.8 ± 39.7 |
113.3 ± 40.6 |
95.6 ± 30.5 |
107.8 ± 37.4***. |
|
E/A |
1.30 ± 0.80 |
1.46 ± 0.84 |
1.12 ± 0.53 |
1.41 ± 0.91*** |
|
E/e’ |
14.3 ± 6.0 |
15.9 ± 8.1 |
12.6 ± 4.7 |
15.0 ± 7.3*** |
|
SVI (ml/m2) |
44.4 ± 17.6 |
40.0 ± 18.9 |
37.6 ± 14.2 |
37.1 ± 15.8 |
|
TR velocity (m/s) |
2.79 ± 0.64 |
3.01 ± 0.49* |
2.66 ± 0.61 |
2.96 ± 0.56*** |
|
RAP (mm Hg) |
5.7 ± 4.2 |
8.6 ± 4.5** |
5.8 ± 3.9 |
8.2 ± 4.7*** |
|
TAPSE (mm) |
15.8 ± 5.8 |
14.2 ± 5.6 |
15.5 ± 5.5 |
13.5 ± 5.5** |
|
RV base (cm) |
3.4 ± 0.8 |
3.7 ± 0.6* |
3.6 ± 0.6 |
3.93 ± 0.86* |
|
Readmission (%) |
25.8 |
62.1*** |
26.6 |
53.2*** |
|
All-cause mortality (%) |
22.6 |
47.6** |
19.0 |
39.7*** |
|
For Abbreviations refer Table 1 and HFrEF: Heart failure; Statistics: *p<0.05, **p<0.01, ***p<0.001 vs CHF1<4 and BNP<100 pg/ml. |
||||
|
Phenotype |
Variable |
Univariate Odds ratio (confidence interval) |
P |
Multivariate Odds ratio (confidence interval) |
P |
|
HFpEF |
LAVI |
1.09 (1.04-1.26) |
0.005 |
1.04 (1.01-1.16) |
0.017 |
|
|
Systolic BP |
0.95 (0.92-0.98) |
<0.001 |
0.98 (0.97-0.99) |
0.006 |
|
|
Atrial fibrillation |
3.75 (1.69-7.71) |
<0.001 |
2.74 (1.29-5.81) |
0.009 |
|
|
Creatinine |
2.27 (1.21-4.17) |
0.003 |
1.85 (1.12-3.08) |
0.014 |
|
|
Hemoglobin |
0.88 (0.71-0.98) |
0.029 |
0.93 (0.81-1.12) |
0.267 |
|
|
TR velocity |
1.31 (1.01-1.87) |
0.044 |
1.22 (0.89-1.91) |
0.391 |
|
HFmrEF |
LVEDVI |
1.04 (1.02-1.09) |
<0.001 |
1.02 (1.01-1.04) |
0.006 |
|
|
Creatinine |
2.29 (1.34-4.75) |
<0.001 |
1.92 (1.15-3.21) |
0.012 |
|
|
Atrial fibrillation |
3.39 (1.58-6.51) |
<0.001 |
2.21 (1.08-4.77) |
0.029 |
|
|
LAVI |
1.07 (1.02-1.09) |
0.021 |
1.04 (1.01-1.07) |
0.038 |
|
|
LV mass index |
1.38 (1.01-1.81) |
0.036 |
1.11 (0.95-1.69) |
0.142 |
|
|
E/e’ |
1.56 (1.10-4.66) |
0.039 |
1.41 (0.88-3.91) |
0.312 |
|
|
TR velocity |
1.22 (1.01-1.96) |
0.048 |
1.18 (0.82-1.45) |
0.432 |
|
HFrEF |
Total Bilirubin |
9.82 (1.51-69.9) |
<0.001 |
9.20 (1.33-63.9) |
0.005 |
|
|
Creatinine |
2.98 (1.04-8.77) |
0.008 |
2.71 (1.01-7.80) |
0.029 |
|
|
Age |
1.05 (1.01-1.11) |
0.019 |
1.03 (0.96-1.09) |
0.231 |
|
|
LVMI |
1.28 (1.01-1.78) |
0.041 |
1.19 (0.89-2.01) |
0.389 |
|
All Phenotypes |
Atrial fibrillation |
3.11 (1.51-6.91) |
<0.001 |
2.76 (1.32-5.76) |
0.006 |
|
Creatinine |
1.98 (1.42-3.78) |
<0.001 |
1.72 (1.17-2.54) |
0.007 |
|
|
|
TR velocity |
2.11 (1.41-3.12) |
0.002 |
1.81 (1.15-2.83) |
0.010 |
|
|
E/e’ |
1.09 (1.02-1.14) |
0.011 |
1.06 (1.01-1.12) |
0.035 |
|
|
LVMI |
1.31 (1.02-1.79) |
0.025 |
1.22 (0.96-1.61) |
0.092 |
|
|
LAVI |
1.06 (1.02-1.11) |
0.031 |
1.05 (0.95-1.09) |
0.214 |
|
|
Age |
1.04 (1.01-1.09) |
0.036 |
1.03 (0.90-1.12) |
0.321 |
|
Phenotype |
Condition |
AUC |
Confidence Interval |
P value |
|
HFpEF |
CHF1 Score>4 or BNP>100 pg/ml |
0.581 ± 0.034 |
0.515-0.647 |
0.016 |
|
HFmrEF |
CHF1 Score>4 or BNP>100 pg/ml |
0.574 ± 0.032 |
0.512-0.636 |
0.019 |
|
HFrEF |
CHF1 Score>4 or BNP>100 pg/ml |
0.575 ± 0.031 |
0.504-0.635 |
0.029 |
|
All Phenotypes |
CHF1 Score>4 or BNP>100 pg/ml |
0.599 ± 0.018 |
0.564-0.633 |
<0.001 |
|
Phenotype |
Condition |
AUC |
Confidence Interval |
P value |
|
HFpEF |
CHF1 Score >4 or BNP >100 pg/ml |
0.560 ± 0.034 |
0.493-0.627 |
0.077 |
|
HFmrEF |
CHF1 Score >4 or BNP >100 pg/ml |
0.708 ± 0.030 |
0.648-0.767 |
<0.001 |
|
HFrEF |
CHF1 Score >4 or BNP >100 pg/ml |
0.679 ± 0.038 |
0.604-0.755 |
<0.001 |
|
All Phenotypes |
CHF1 Score >4 or BNP >100 pg/ml |
0.633 ± 0.019 |
0.596-0.670 |
<0.001 |
Discussion
Our findings indicate that in a community-based HF cohort in the absence of a HF service, 56.9-60.3% fulfilled either the Framingham HF criteria or had a BNP >100 pg/ml at the time of entry into the period of observation. Second, for patients with CHF1 score >4 or BNP >100 pg/ml at the time of onset of care, there was increased ACM and increased HF readmission. Third, as a novel and unexpected finding, subsequent ACM by previous HF readmission was increased in HFpEF, HFrEF, and in all phenotypes combined despite CHF1 scores <4 and BNP <100 pg/ml. Also, subsequent ACM by previous HF readmission was noted in HFpEF and in all phenotypes combined with CHF1 score >4 or BNP >100 pg/ml. Additionally, older patients tended to have a greater percentage of patients with verifiable HF but was only a univariate predictor likely due to its relation to other co-morbidities including chronic renal disease, atrial fibrillation, and systolic blood pressure.
Previous Literature
The use of administrative databases to determine predictors for HF readmission and ACM requires accurate designation as to whether patients who have been coded as having HF actually have HF. Using HF as a diagnosis because of ICD coding, being listed on a problem list [1], using a decision tool to determine the presence of HF [2], and even the presence of an implantable cardioverter-defibrillator [3] demonstrated a disappointing percentage of patients with verifiable HF. Clearly the diagnosis of HF depends on the dataset examined and is not well substantiated following chart review using a variety of HF algorithms for diagnosis. The novelty of our study is that each patient’s medical record was exhaustively reviewed and HF verification was determined using both the Framingham criteria and BNP >100 pg/ml. Several algorithms have been used to verify HF. The Framingham HF Criteria is one such algorithm that takes into account symptoms, physical exam, and radiologic findings but its development preceded the use of BNP [8]. In the past, multiple studies have used variations of the Framingham HF criteria with the addition of BNP [8-10]. More recently, the 2016 European Society of Cardiology HF guidelines requires for a HF diagnosis an assessment of HF probability including underlying predisposition, symptoms, physical examination or abnormal ECG. If >1 of these criteria are present, then BNP can be evaluated and if abnormal (>35 pg/ml), echocardiography can be obtained. Finally, using national VA data, HFpEF patients with HF could be identified using a variation of the Framingham HF score and elevated natriuretic peptides and demonstrated an 86% sensitivity and 78% specificity when applied to 100 HFpEF patients and 100 normal patients for identifying HF, but without outcome data [15]. Finally, in a large Finnish database, Huusko [11] did note that HF readmission was associated with subsequent ACM but did not exhaustively verify HF with individual chart review. The data generated in our study demonstrated verification of HF in approximately 60% of patients. We make 1 additional observation in that verified HF is associated with both increased HF readmission and ACM.
Limitations
As this was a retrospective evaluation of a rural based outpatient practice without an ambulatory HF service, it is limited by numbers and population diversity. This may have been a particular issue in patients with HF readmission who subsequently sustained ACM. Second, the use of sacubitril/valsartan was recently introduced into the region and had not been utilized during the period of observation by any patient due to physician-patient decision and cost. Third, data abstraction was based on chart review of both inpatient and outpatient recorded symptoms and medications. ACM was based on chart review, national death index, and obituary review and may not have reflected all mortality. Cardiovascular mortality could not be discerned nor medication compliance. The influence of non-cardiovascular mortality among the HF phenotypes could not be determined recognizing that non-cardiovascular mortality may be higher in HFpEF than other phenotypes. The obvious underutilization of angiotensin converting enzyme inhibitors/angiotensin receptor blockers, beta blockers, and aldosterone antagonists are likely related to not having an ambulatory HF service in this rural area. Nevertheless, underutilization has been noted in numerous databases and retrospective studies. Furthermore, optimal dosing was not evaluated in this study with regard to outcomes because of changing dosing in many patients for unclear reasons. Fourth, HF readmissions may have occurred outside the East Tennessee area. The additional hospital system’s records in the area were available and reviewed for admissions as patients may use both systems. Fifth, laboratory values were not available in all patients for BNP (11% missing), with a non-significant difference among HF phenotypes ranging from 5-14%. Sixth, the use of BNP>100 pg/ml was chosen to ensure greater likelihood that the elevation was related to HF and not related to other co-morbidities. Furthermore, the European Heart Failure guidelines use 35 pg/ml as a corroborating level for HF diagnosis [8]. Finally, the percentage of patients with implantable cardio-defibrillators and/or cardiac resynchronization therapy was small as the average ejection fraction in HFrEF was 37% (18 patients had implantable defibrillators and 6 with cardiac resynchronization therapy). As this was retrospective study, there may be additional unknown differences among HF phenotypic groups that were not accounted for.
Clinical Implications
HF coding by ICD-9 codes and even as a discharge diagnosis can only be corroborated in approximately 60% of patients seen in a community-based university rural practice using either CHF1 score >4 or BNP >100 pg/ml to verify HF. ICD coding is performed by coders with chart review of physician notes, accompanying laboratory and imaging support. Specific HF criteria including the European Guidelines of the Framingham Heart failure criteria are inconsistently utilized. The validity of using HF verification is supported by an increase in ACM and HF readmission for all phenotypes combined and individually though the area under the receiver operating curves were modest for ACM and moderate for HF readmission. Despite this clear limitation, it would appear that clinical verification of HF would be important to more effectively predict prognosis in all phenotypes. One novel finding was that we noted increased ACM with previous HF readmission in patients with CHF1 scores <4 and BNP <100 pg/ml in HFpEF, HFrEF, and all phenotypes combined suggesting that HF readmission is a risk for ACM. This may occur because each HF readmission is verified in this study. There clearly exists the possibility that chart review did not capture the necessary symptoms, physical signs, or radiologic signs supporting HF when the patients entered the study. Furthermore, noncardiovascular mortality may also occur and specifically in the HFpEF phenotype.
The mere presence of a HF diagnosis should alert the clinician to look carefully at the historical, clinical, BNP levels, and radiologic data to determine if there is support for this diagnosis. HF verification by the clinician will help identify a group of patients whose outcomes are likely to be worse. In the absence of a HF clinic, each clinician should verify if the patient has HF by using natriuretic peptides and clinical criteria. Obesity and chronic lung disease of varying etiologies may be mistaken for HF though their prevalence was similar in all HF phenotypes with and without verifiable HF. Although deconditioning may be a factor, we had no data regarding functional capacity. The use of echocardiography can assist in determination of phenotype, chamber size and function, estimation of LV filling pressure, and may improve clinical accuracy. Use of administrative databases to predict outcomes in patients with HF should be re-evaluated carefully. HF databases should be assembled with significant granular detail to actually determine if clinical evidence of HF exists.
Conclusion
In conclusion, the presence of HF as a diagnosis by ICD code or discharge diagnosis can be verified using the Framingham HF Score or a BNP >100 pg/ml in approximately 60%. When HF is verifiable, there is evidence of increased ACM and increased HF readmission. For patients previously readmitted, ACM was increased in HFpEF, HFrEF, and in all phenotypes combined despite CHF1 scores <4 and BNP <100 pg/ml. ACM by previous HF readmission was also noted in HFpEF and in all phenotypes combined with CHF1 score >4 or BNP >100 pg/ml. Verifying HF by either clinical criteria (Framingham Heart Failure criteria or the European HF Guidelines) and/or the use of natriuretic peptides will identify patients labelled as HF with greatest risk of an adverse outcome.
Conflicts of Interest
There are no conflicts of interest of any author.
Funding Source
We would like to acknowledge the American Heart Association summer medical student stipend for support of Danielle Kelvas, M.D between her 1st and 2nd year of medical school.
Contribution
Steven J. Lavine, M.D conceived the study, designed the approach, assisted in the acquisition of the data, analyzed the data, and wrote the manuscript. Ghulum Murtaza, M.D assisted in obtaining approximately 1/3 of the patients entered in the study and assisted in determining readmission and vital status of the patients. Similarly, Zia Ur Rahman assisted in obtaining 1/3 of the patients entered in the study and also analyzed and obtained all data from the other hospital system in the East Tennessee area. Danielle Kelvas, M.D was a 1st year medical student participating in her American Heart Association summer student project which included entering in 1/3 of the patients, designed approaches to determining whether patients were readmitted, and confirming vital status of the patients. Timir K. Paul, M.D. assisted in the drafting of the manuscript and supervising Dr. Murtaza and Dr. Rahman.
References
2. Banerjee D, Thompson C, Bingham A, Kell C, Duhon J, Grossman H. An electronic medical record report improves identification of hospitalized patients with heart failure. Journal of Cardiac Failure. 2016 May 1;22(5):402-5.
3. Kaspar M, Fette G, Güder G, Seidlmayer L, Ertl M, Dietrich G, et al. Underestimated prevalence of heart failure in hospital inpatients: a comparison of ICD codes and discharge letter information. Clinical Research in Cardiology. 2018 Sep;107(9):778-87.
4. Carey SA, Bass K, Saracino G, East CA, Felius J, Grayburn PA, et al. Probability of accurate heart failure diagnosis and the implications for hospital readmissions. The American Journal of Cardiology. 2017 Apr 1;119(7):1041-6.
5. Steg PG, Joubin L, McCord J, Abraham WT, Hollander JE, Omland T, et al. Breathing Not Properly Multinational Study Investigators. B-type natriuretic peptide and echocardiographic determination of ejection fraction in the diagnosis of congestive heart failure in patients with acute dyspnea. Chest. 2005 Jul 1;128(1):21-9.
6. Maisel AS, McCord J, Nowak RM, Hollander JE, Wu AH, Duc P, et al. Bedside B-type natriuretic peptide in the emergency diagnosis of heart failure with reduced or preserved ejection fraction: results from the Breathing Not Properly Multinational Study. Journal of the American College of Cardiology. 2003 Jun 4;41(11):2010-7.
7. McKee PA, Castelli WP, McNamara PM, Kannel WB. The natural history of congestive heart failure: the Framingham study. New England Journal of Medicine. 1971 Dec 23;285(26):1441-6.
8. Ponikowski P, Voors AA, Anker SD, Bueno H, Cleland JG, Coats AJ, et al. ESC Scientific Document Group. 2016 ESC Guidelines for the diagnosis and treatment of acute and chronic heart failure: The Task Force for the diagnosis and treatment of acute and chronic heart failure of the European Society of Cardiology (ESC) Developed with the special contribution of the Heart Failure Association (HFA) of the ESC. European Heart Journal. 2016 Jul 14;37(27):2129-200.
9. Pitt B, Pfeffer MA, Assmann SF, Boineau R, Anand IS, Claggett B, et al. Spironolactone for heart failure with preserved ejection fraction. The New England Journal of Medicine. 2014 Apr 10;370(15):1383-92.
10. McMurray JJ, Packer M, Desai AS, Gong J, Lefkowitz MP, Rizkala AR, et al. Angiotensin–neprilysin inhibition versus enalapril in heart failure. The New England Journal of Medicine. 2014 Sep 11;371:993-1004.
11. Huusko J, Tuominen S, Studer R, Corda S, Proudfoot C, Lassenius M, et al. Recurrent hospitalizations are associated with increased mortality across the ejection fraction range in heart failure. ESC Heart Failure. 2020 Oct;7(5):2406-17.
12. Burgess DC, Hunt D, Li L, Zannino D, Williamson E, Davis TM, et al. Incidence and predictors of silent myocardial infarction in type 2 diabetes and the effect of fenofibrate: an analysis from the Fenofibrate Intervention and Event Lowering in Diabetes (FIELD) study. European Heart Journal. 2010 Jan 1;31(1):92-9.
13. Bonaca MP, Wiviott SD, Braunwald E, Murphy SA, Ruff CT, Antman EM, et al. American College of Cardiology/American Heart Association/European Society of Cardiology/World Heart Federation universal definition of myocardial infarction classification system and the risk of cardiovascular death: observations from the TRITON-TIMI 38 trial (Trial to Assess Improvement in Therapeutic Outcomes by Optimizing Platelet Inhibition With Prasugrel–Thrombolysis in Myocardial Infarction 38). Circulation. 2012 Jan 31;125(4):577-83.
14. Lang RM, Badano LP, Mor-Avi V, Afilalo J, Armstrong A, Ernande L, et al. Recommendations for cardiac chamber quantification by echocardiography in adults: an update from the American Society of Echocardiography and the European Association of Cardiovascular Imaging. European Heart Journal-Cardiovascular Imaging. 2015 Mar 1;16(3):233-71.
15. Nagueh SF, Smiseth OA, Appleton CP, Byrd BF, Dokainish H, Edvardsen T, et al. Recommendations for the evaluation of left ventricular diastolic function by echocardiography: an update from the American Society of Echocardiography and the European Association of Cardiovascular Imaging. European Journal of Echocardiography. 2016 Jul 15;17(12):1321-60.
16. Tsao CW, Lyass A, Enserro D, Larson MG, Ho JE, Kizer JR, et al. Temporal trends in the incidence of and mortality associated with heart failure with preserved and reduced ejection fraction. JACC: Heart Failure. 2018 Aug;6(8):678-85.