Abstract
Computational Fluid Dynamics (CFD) is a well-established and accepted tool for simulation and prediction of complex physical phenomena e.g., in combustion, aerodynamics or blood circulation. Recently CFD has entered the medical field due to the readily available high computational power of current graphics processing units, GPUs. Efficient numerical codes, commercial or open source, are available now. Thus, a wide range of medical themes is available for CFD almost in real-time in the medical environment now.
The available methods are on the point of reaching a usability status ready for everyday clinical use as a potential medical decision support system, provided adherence to the appropriate patient data protection rules and proper certification as a medical device.
This contribution outlines the current range of activities in our clinic in the field of Lattice-Boltzmann CFD based on CT and / or MR imagery and flashlights the following three areas: simulating the effect of nasal stents on breathing, predicting clinical Rhinomanometry and Rhinometry, and the numerical estimation of resection volumes for surgery to improve nasal breathing. The set of required methods is outlined, the three areas are discussed and summarized. The results presented are very preliminary insights into current research and need to be subject to further detailed evaluation, of course.
The results presented are very promising first steps in the direction of both digital patient diagnosis and therapy prediction. However, thorough and in-depth evaluation of the methods themselves and proper clinical studies to assess the merits of the technology are still required.
Keywords
Nasal airflow, Laser Doppler anemometry, Computational fluid dynamics, Breathing simulation, Nasal airflow optimization, Rhinomanometry, Surgery, Simulation, Diagnosis prediction
Abbreviations
3D: Three-dimensional; CFD: Computational Fluid Dynamics; CT: Computer Tomography; HPDR: High Pressure Drop Region; MRI: Magnetic Resonance Imaging; CT: Computed Tomography; LB: Lattice Boltzmann; LDA: Laser Doppler Anemometry.
Introduction
Numerical prediction of complex physical phenomena in the medical domain almost always implies complex geometries, boundary conditions and challenging physical questions. Paradigmatically, nasal airflow is of interest as this might be a tool to improve the current success rate of septoplasty and sinus surgery [1,2] as patient satisfaction studies suggest [3]. According to current clinical guidelines preoperative planning of surgery of the nasal cavity is, in addition to 2D/3D radiologic imaging and nasal endoscopy more and more including additional Rhinomanometry and acoustic Rhinometry data [4]. The success of surgical intervention in general and specifically in optimizing nasal breathing (i.e., airflow), strongly depends on the surgeon’s experience. It might thus be worthy to investigate whether digital aids could help doctors to improve this situation. Moreover, consequent use of available digital patient data eventually could help advancing the current state of medical practice.
Lattice Boltzmann (LB) fluid flow simulations are simple and fast [5] to simulate nasal airflow. In the microscopic description state of a gas/fluid by a Newtonian fluid model every particle is assigned position and velocity. As this is impossible to realize in numerical simulations the computational model builds on statistical considerations on base of velocity distribution functions.
As with any simulation tool, LB simulations need to be validated against ground truth. This was done in a thorough investigation where simulations and Laser Doppler Anemometry, LDA, of a physical (3D printed) and a 3D reconstruction of a 3D-CT image stack was performed [6]. A simplified phantom and an anonymous patient CT data set were segmented to show only tissue and air [7] of which the tissue part was 3D printed [8]. This allowed a realistic reproduction of the paranasal sinuses, especially the main nasal cavity that is providing the predominant nasal airflow for breathing at the zones of the inferior/middle turbinates. LDA measurements and CFD simulations were found to be in good agreement. It is thus justified to use the LB simulation tool in this context.
A novel medical device for treating snoring conditions is finding more and more patient acceptance [9]; this nasal stent made from Nitinol widens the nasal air passage between lower and middle turbinate during overnight use. Currently daytime use for sports activities of this device seems to be a new field of use. Available anonymous MR imagery were used in CFD simulations to assess the physical effects of these stents on nasal airflow with and without the nasal stent. In addition, the prediction tool for surgery was run on these data sets.
For an exceptional single case CT and MR imagery, and Rhinomanometry and Rhinometry data, all anonymous, allowed an initial test run of the LB simulation framework for predicting clinical diagnoses.
The basic idea behind all these approaches is to use CFD to calculate streamlines and pressure drops with given boundary conditions of pressure, flow, and anatomy. Analysis of the effects of the Alaxo Stents and the prediction of surgical resection volumes relies on the determination of certain high-pressure-drop regions along streamlines (see Materials and Methods section), whereas the simulations of Rhinomanometry and Rhinometry basically employ evaluating the volume flux and the cross-sections of the paranasal sinuses in coronal slice orientations, respectively.
The investigations were predominately based on anonymous CT datasets, being the clinical standard imagery; CT and MR imaging were used for predicting diagnostic Rhinomanometry and Rhinometry data; MR data were used for simulating the Alaxo stents. The nature of the 3D imaging modality used to generate the three-dimensional volumes to run the CFD simulations is defined by the clinical availability or the diagnostic requirements; other than that, simulation does not put constraints on the medical imagery used. The three-dimensional patient imagery has to allow the generation of meshes, three-dimensional surfaces, of the boundary between air and tissue only. Some minor adjustments in the specific segmentation approaches might become necessary for different medical imaging modalities.
Material and Methods
Stent MR data (Siemens, T1 mpr_ns_sag_fast, Echo Train Length 1, Flip angle 15, Inversion time 760 ms, 0.488 × 0.488 × 1 mm³, 512 × 512 × 103). MR data comparison to Rhinomanometry (t1_mpr_ns_tra, 0.9375 × 0.9375 × 1.2 mm³, 208 × 256 × 128)
CT data comparison to Rhinomanometry (Siemens SOMATOM, beam current 88 mA, convolution kernel H30 s, spatial resolution 0.3 ×0.3 ×0.3 mm³, 536 × 536 × 440)
Medical imaging data
The study was conducted in accordance with local ethical guidelines as stipulated by the 7th revision of the Declaration of Helsinki. No ethics committee approval for this anonymized retrospective study was needed. All anonymous data used in the computations originate from patients who voluntarily agreed to anonymized use of their data for further scientific purposes; some data were acquired at different times and therefore not all physiologic states of relevance (e.g., status of the nasal cycle) are known. For one patient CT and MR data, Rhinomanometry and Rhinometry were available to allow a comparison of clinical and computed diagnoses. CT data were acquired with swollen nasal mucosa (i.e., with present infection or acute allergic state); MR data were acquired in a normal condition of the nasal mucosa. The actual state of the nasal cycle was not taken into consideration.
The computational time of one simulation was about 4 minutes on a CPU XEON (E5 1650 V3) with twelve threads and 32 GB RAM (4 × 8 GB DDR4-2133) and a NVIDIA RTX 2080 Ti graphics card (GPU). The fluid flow simulations were performed on GPU. The Rhinomanometry curve was simulated within less than 3 hours.
Preparation of radiologic 3D data
All data sets were thresholded and segmented [7,10] to show air and tissue spaces only. At the in- and outlets (i.e., nostrils and nasopharynx) cuboids (60 × 40 × 20 mm³) were added as proper boundary volumes for the LB simulations. The resulting mesh form this volume was obtained with [11] and was saved in .stl format for the simulations. Nasal airflow cross-sections were obtained from the segmented data in coronal views in steps of 5 mm from the nostrils in posterior direction with 3D Slicer [10] and were compared to the data of acoustic Rhinometry.
LB Simulation and Optimization
Inhalation was simulated with a constant air flow rate of 0.6 l/s for reasons of computational stability with Sailfish CFD [5]. Inlet and outlet were set to ambient pressure, respectively, and at the outlet a flow boundary condition was set. Simulations started with velocity increasing from zero until a quasi-stationary solution was achieved. The physical situation gives a Reynolds number (Re) indicating turbulences that were handled with the LB large eddy simulation (LES) option of Sailfish. CFD simulations served to find high-pressure drop regions in the three-dimensional flow field, HPDRs, to indicate zones of surgical removal of tissue to optimize nasal breathing; air-flow cross-section was increased until less than 5 HPDRs were found [Berger et al, JCARS under review]. From the initial set of HPDRs users manually selected the ones most appropriate to clinical requirements. Cases of septum deviations served as examples in this investigation. The data with nasal splints in place were simulated accordingly.
In order to simulate clinical Rhinomanometry data for inspiration and expiration of both nostrils air flow was increased from 0 to 600 ml/s in increments of 50 ml/s. In the segmented model one nostril was blocked to resemble clinical Rhinomanometry. For comparing with simulations clinical Rhinomanometry data were approximated by the Bernoulli equation [12].
Results
Table 1 shows that nasal stents reduce the pressure drops between inlet and outlet cuboids significantly. The optimizations clearly show that applying a nasal stent leads to results that compare well to simulated surgery results with very small pressure drops. Details in Berger et al, JCARS under review. Table 2 shows that the geometry of the nasal cavity with applied stent would require much less surgical optimization than the one indicated by the amount of tissue to be resected in the simulations.
|
|
Pressure drops [Pa] |
|||
|
|
without stent, from CFD |
without stent, CFD optimized geometry |
with stent, |
with stent, CFD optimized geometry |
|
Patient 1 |
371 |
11 |
200 |
16 |
|
Patient 2 |
148 |
12 |
148 |
10 |
|
Patient 3 |
241 |
13 |
69 |
16 |
|
|
Resection Volume [cm³] |
|
|
|
without stent |
with stent |
|
Patient 1 |
14.6 |
10.2 |
|
Patient 2 |
6.89 |
6.52 |
|
Patient 3 |
12.52 |
5.14 |
Figure 1 shows that in the data sets without stent HPDRs are identified at locations where the nasal stent is actually positioned, red points. For patient 2 simulations with and without stent gave the same results; however, a 148 Pa pressure drop is most likely due to the fact that the air-flow cross-section at the nasopharynx was much smaller without stent indicating a different physiologic / anatomic status.
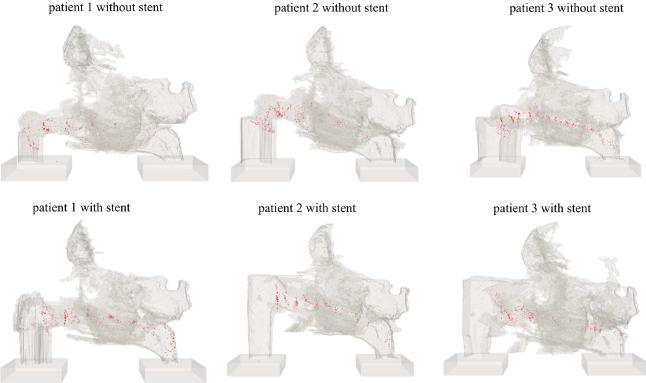
Figure 1: Segmented nasal cavity with found high pressure drop regions (HPDRs) – red points. With applied stents the number of HPDRs is much smaller.
In (Figure 2) the corresponding estimated resection volume was determined. Where the nasal stent was in place, no further optimization was proposed, indicating that a nasal stent “optimized” nasal breathing. (Table 2) shows the estimated corresponding calculated resection volumes.
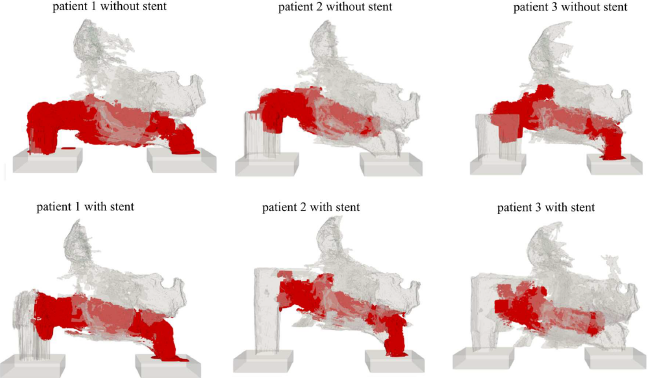
Figure 2: Segmented nasal cavity and estimated resection volume (red).
Figure 3 shows the comparison simulated and measured acoustic Rhinometry and Rhinomanometry data [13]. The left panel shows the LB simulation results (points) superimposed to Rhinometry data (lines). The root mean square error (RMSE) of the pressure drops between swollen left and right nasal cavity between the Bernoulli approximated Rhinomanometry data and simulation was 60.25 Pa and 148.43 Pa, respectively. Detumesced right and left sides differed by 8.40 Pa and 58.23 Pa, respectively [13]. The right panel of (Figure 3) right shows the segmentation results and acoustic Rhinometry data. The airflow cross-section RMSE of the left cavity, not swollen was 0.81 cm², swollen 2.32 cm²; right: not swollen 0.63 cm², swollen 1.54 cm². In all investigations, simulation and segmentation based on MRI datasets are in better accordance with measurements than investigations based on CT datasets. In a recent study it was found that LB simulations provided excellent correlation (r=0.97, p<0.001) of measured and simulated Rhinomanometry and Rhinometry data [Berger et al JCARS, under review].
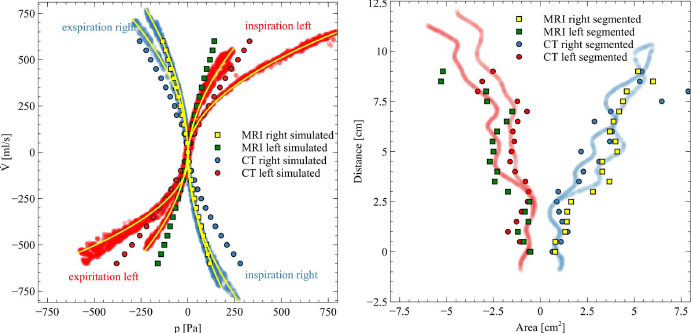
Figure 3: Left: Comparison of Rhinomanometry measurement data with LB simulation results based on CT and MRI dataset of the same patient. On the abscissa the pressure drop [Pa] between nostril and throat is shown, on the ordinate the flow rate () ml/s is depicted. Yellow lines are Bernoulli approximations [13]. Right: Comparison of acoustic Rhinometry measurement data with segmentation results of the same patient. The distance in cm is the acoustic Rhinometry distance from the measurement device, at the simulations those are in coronal direction from nostril.
Figure 4 shows optimization results with the LB method based on the CT dataset of the patient for whom CT, MR, Rhinomanometry and acoustic Rhinometry data were available. Coronal slices close to the nasal valve are depicted. Magenta shows the calculated resection volume.
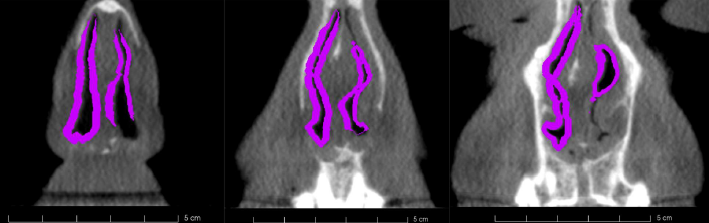
Figure 4: Optimization results of the CT data of the patient with Rhinomanometry and Rhinometry data. Coronal airflow cross-sections. Background: CT image, Magenta: suggested resection volume.
Discussion
This short communication shows extensions to the work [6], and to our current work (partly still under review and revision). All previous investigations were performed with CT datasets that allowed easy automated segmentation of air and tissue spaces. MRI imagery is susceptible to the segmentation approach implemented and manual segmentation had to be used. This is a minor issue but does not hamper the methodology presented allowing – from a clinical perspective – sufficient alignment of simulated patient findings with clinical data. Concerning the potential power of CFD simulation the presented results could be a promising step in the direction of new tools for clinicians to predict anatomical areas and volumes to surgically treat problems of nasal breathing. The results suggest that a careful selection of the time-point of imaging is required so that simulations actually can build on the “real” clinical situation and is not affected by changes to the nasal mucosa induced e.g., the topical application of local decongestants or the nasal cycle.
The 3D mesh was deformed randomly, approximating surgical changes and were subject to CFD simulations. 3D printed models with the changed geometry were validated against LDA measurements. The root mean square error of the velocity near the nasal valve of LDA measurements and LB simulations was 0.071. Changes in the geometry had similar effects on simulation and measurement; the results found are in quite good agreement and suggest that further investigations in this direction might present a fruitful route to pursue.
Concerning the simulations of nasal stents, the data suggest that the resection volumes predicted are smaller when the stent is applied. Consequently, the nasal stent “optimizes” the relevant available intranasal volume for breathing since the proposed resection volume is minor.
Conclusion
LB fluid flow simulations have some potential in the preoperative planning process to improve the surgical outcome of surgeries to improve nasal breathing. Compared to CT, MRI is considered to be harmless for patients and similarly useful for LB CFD simulations. Segmentation of MR data, however, is somewhat more difficult than segmentation of CT data.
Conflicts of Interest
None of the authors declare any conflict of interest.
References
2. Chambers KJ, Horstkotte KA, Shanley K, Lindsay RW. Evaluation of improvement in nasal obstruction following nasal valve correction in patients with a history of failed septoplasty. JAMA Facial Plastic Surgery. 2015 Sep 1;17(5):347-50.
3. Prakash B. Patient satisfaction. Journal of Cutaneous and Aesthetic Surgery. 2010 Sep;3(3):151.
4. Demirbas D, Cingi C, Çakli H, Kaya E. Use of rhinomanometry in common rhinologic disorders. Expert Review of Medical Devices. 2011 Nov 1;8(6):769-77.
5. Januszewski M, Kostur M. Sailfish: A flexible multi-GPU implementation of the lattice Boltzmann method. Computer Physics Communications. 2014 Sep 1;185(9):2350-68.
6. Berger M, Pillei M, Mehrle A, Recheis W, Kral F, Kraxner M, et al. Nasal cavity airflow: Comparing laser doppler anemometry and computational fluid dynamic simulations. Respiratory Physiology & Neurobiology. 2021 Jan 1;283:103533.
7. Nakano H, Mishima K, Ueda Y, Matsushita A, Suga H, Miyawaki Y, et al. A new method for determining the optimal CT threshold for extracting the upper airway. Dentomaxillofacial Radiology. 2013 Mar;42(3):26397438.
8. Dremel, “Dremel 3D20 - Operations manual.” 2015.
9. Alaxo GmbH: Neue Stent-Therapien bei Schnarchen, Schlafapnoe und behinderter Nasenatmung Alaxo GmbH: Neue Stent-Therapien bei Schnarchen, Schlafapnoe und behinderter Nasenatmung. 2020.
10. Fedorov A, Beichel R, Kalpathy-Cramer J, Finet J, Fillion-Robin JC, Pujol S, et al. 3D Slicer as an image computing platform for the Quantitative Imaging Network. Magnetic Resonance Imaging. 2012 Nov 1;30(9):1323-41.
11. Lorensen WE, Cline HE. Marching cubes: A high resolution 3D surface construction algorithm. ACM Siggraph Computer Graphics. 1987 Aug 1;21(4):163-9.
12. Landau LD, Lifshitz EM. Quantum mechanics: non-relativistic theory. Elsevier; 2013 Oct 22.
13. Giannarou S, Hacihaliloglu I. IJCARS-IPCAI 2020 special issue: 11th conference on information processing for computer-assisted interventions-part 1. International Journal of Computer Assisted Radiology and Surgery. 2020 May 1:1.